随笔分类 - echarts
摘要: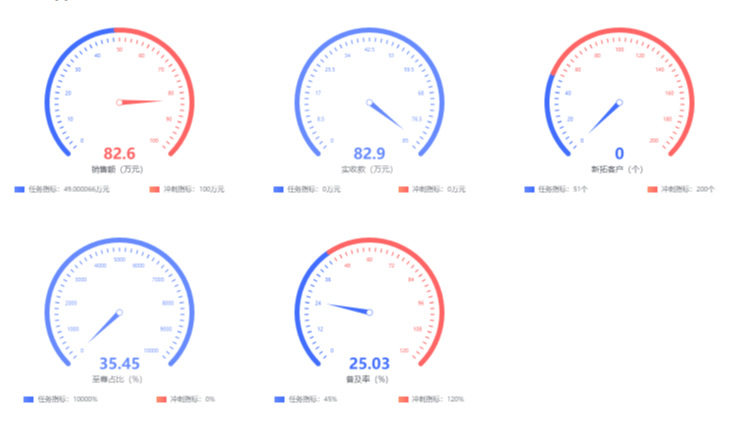 1、仪表盘组件 GaugeChart/index.tsx(组件中的nightFlag是适配黑夜模式,获取公共状态中的值) import React, { useEffect, useRef } from 'react' import styles from './index.less' import
阅读全文
1、仪表盘组件 GaugeChart/index.tsx(组件中的nightFlag是适配黑夜模式,获取公共状态中的值) import React, { useEffect, useRef } from 'react' import styles from './index.less' import
阅读全文
1、仪表盘组件 GaugeChart/index.tsx(组件中的nightFlag是适配黑夜模式,获取公共状态中的值) import React, { useEffect, useRef } from 'react' import styles from './index.less' import
阅读全文
摘要: 1、下载插件 npm i echarts 2、components/ColorLine.vue <template> <div class="color-line" :id="id"></div> </template> <script> const echarts = require('echar
阅读全文
1、下载插件 npm i echarts 2、components/ColorLine.vue <template> <div class="color-line" :id="id"></div> </template> <script> const echarts = require('echar
阅读全文
1、下载插件 npm i echarts 2、components/ColorLine.vue <template> <div class="color-line" :id="id"></div> </template> <script> const echarts = require('echar
阅读全文
摘要:举个例子吧,就做这个了: 打开之后是这样的: 操作: 1、准备工作:就差一个option配置项了 2、开心地将option粘过来,报错了,没有ROOT_PATH 3、添加ROOT_PATH(let ROOT_PATH = 'https://echarts.apache.org/examples'),
阅读全文
摘要:问题:China.js的地图在页面上没有显示,并且报错: 原因分析:main.js中已经全局引入echarts了,其他的柱状图和折线图可以正常显示了 这里使用的是china.js: 解决: 查看页面: china地图已经出来了
阅读全文
摘要:1、安装插件:npm install echarts --save 2、引入echarts import echarts from 'echarts' 3、为ECharts准备一个具备大小(宽高)的Dom <div id="main" style="width: 600px;height:400px
阅读全文
摘要:### eCharts 官方文档:基本介绍、示例、API文档、配置项 实例 >官方实例 文档 >教程、配置项手册 echarts基本使用:(App.vue) ①安装插件: npm install echarts(项目名不能和插件名相同) ②引入: import echarts from "echar
阅读全文
摘要:npm ERR! code ENOSELF npm ERR! Refusing to install package with name "echarts" under a package npm ERR! also called "echarts". Did you name your proje
阅读全文
