node_exporter+prometheus+grafana服务器监控
环境:centos7
思路:node_exporter插件收集服务器数据——prometheus存储插件收集的数据——grafana展示prometheus收集的数据
下载对应系统最新软件包prometheus和监控插件node_exporter
1、配置node_exporter成服务并修改端口
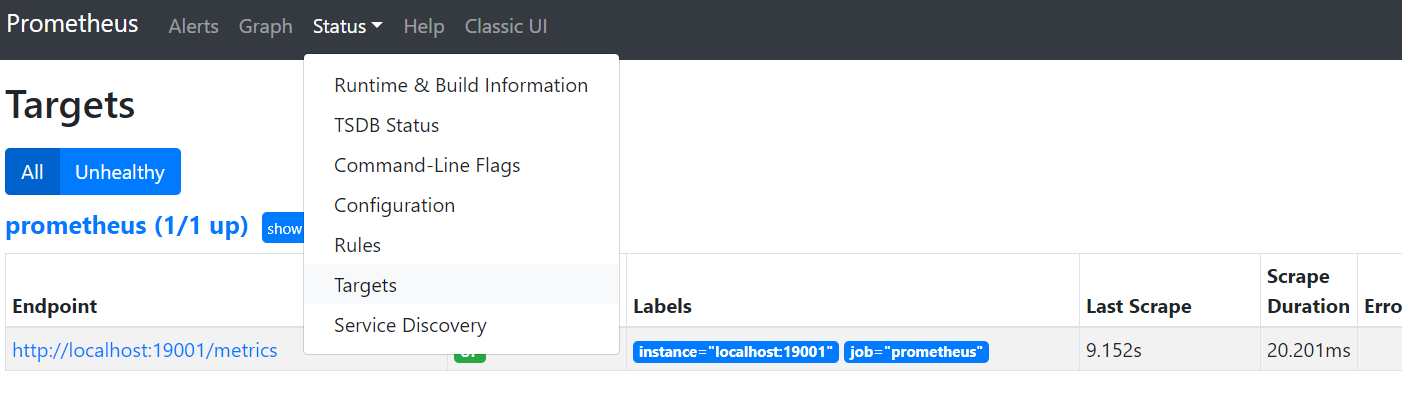
tar -zxvf node_exporter-1.0.1.linux-amd64.tar.gz
cd node_exporter-1.0.1.linux-amd64 && cp node_exporter /usr/local/bin/

centos创建一个.service文件
cat << EOF > /usr/lib/systemd/system/node_exporter.service

[Unit]
Description=node_exporter
After=network.target
[Service]
Type=simple
User=root
ExecStart=/usr/local/bin/node_exporter --web.listen-address=:19001
Restart=on-failure
[Install]
WantedBy=multi-user.target
EOF

启动服务
systemctl daemon-reload
systemctl start node_exporter && \
systemctl status node_exporter && \
systemctl enable node_exporter
验证:http://ip:19001/metrics

2、prometheus安装配置成服务
cat << EOF > /usr/lib/systemd/system/prometheus.service
[Unit]
Description=Prometheus
Documentation=https://prometheus.io/
After=network.target

[Service]
Type=simple
User=root
ExecStart=/prometheus-2.24.1.linux-amd64/prometheus --config.file=/prometheus-2.24.1.linux-amd64/prometheus.yml --web.enable-lifecycle --storage.tsdb.retention=90d --web.listen-address=:19190
Restart=on-failure

[Install]
WantedBy=multi-user.target
EOF
启动服务
systemctl daemon-reload
systemctl start prometheus.service && \
systemctl status prometheus.service && \
systemctl enable prometheus.service
验证:http://ip:19190
配置文件修改
[root@node1 prometheus-2.24.1.linux-amd64]# cat prometheus.yml |grep -v '#'
global:
alerting:
  alertmanagers:
  - static_configs:
    - targets:
rule_files:
scrape_configs:
  - job_name: 'prometheus'
    static_configs:
    - targets: ['localhost:19001']
3、grafana安装
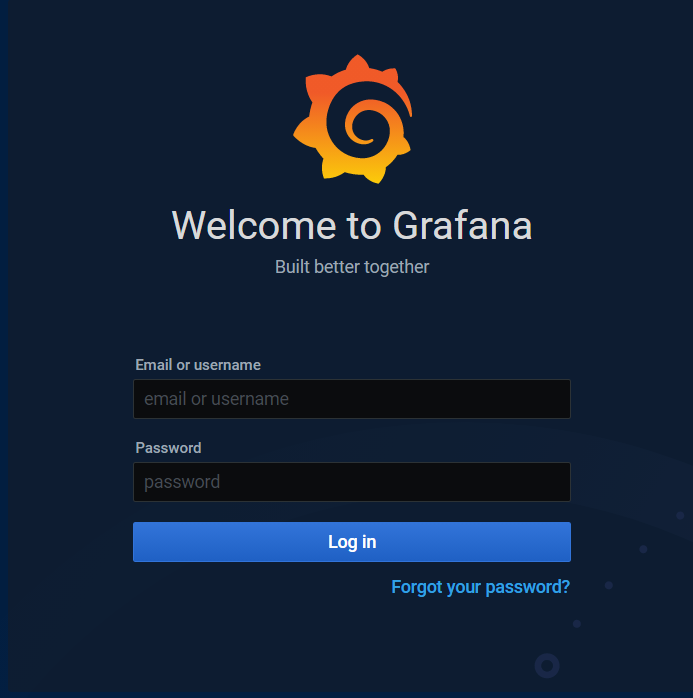
https://www.cnblogs.com/imyalost/p/9873641.html 参考
下载网址:https://grafana.com/grafana/download/7.3.7
wget https://dl.grafana.com/oss/release/grafana-7.3.7-1.x86_64.rpm
sudo yum install grafana-7.3.7-1.x86_64.rpm
下载安装完成后,输入命令 systemctl start grafana-server   启动服务,打开浏览器,输入IP+端口,3000为Grafana的默认侦听端口。
系统默认用户名和密码为admin/admin,第一次登陆系统会要求修改密码,修改密码后登陆,界面显示如下:
4、grafana配置数据源prometheus,官网下载数据显示模板并导入,显示结果如下图所示:

做一个决定,并不难,难的是付诸行动,并且坚持到底。

 浙公网安备 33010602011771号