Grafana Query类型模板变量的使用
一、背景
假设我有2种类型的服务器,一种是本地电脑(每个指标名称都存在{nodename=‘mac-local’}),一种是阿里云服务器(每个指标名称都存在{nodename=‘aliyun’}),同时每个指标下都存在一个 {instance=‘具体的服务器的ip地址’}标签。
即我们采集的时间序列大致上都有如下标签:
eg:
node_uname_info{nodename='xxxx',instance='yyyy'}
二、需求
我们想监控一下每台主机的cpu的使用情况。同时不能在一个图形上显示出所有的机器的cpu使用率,需要根据用户的选择而显示。即要出现下图所示的结果,这个情况我们可以通过grafana的模板变量来实现。
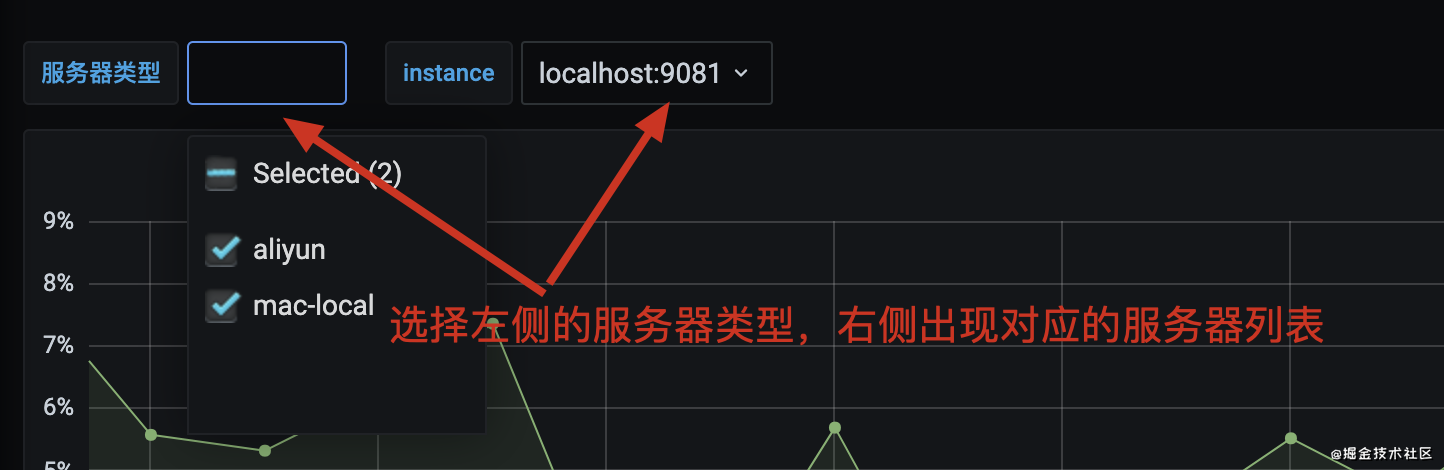
从上图可以,instance的出现是根据 服务器类型 的选择而不同的。
三、实现步骤
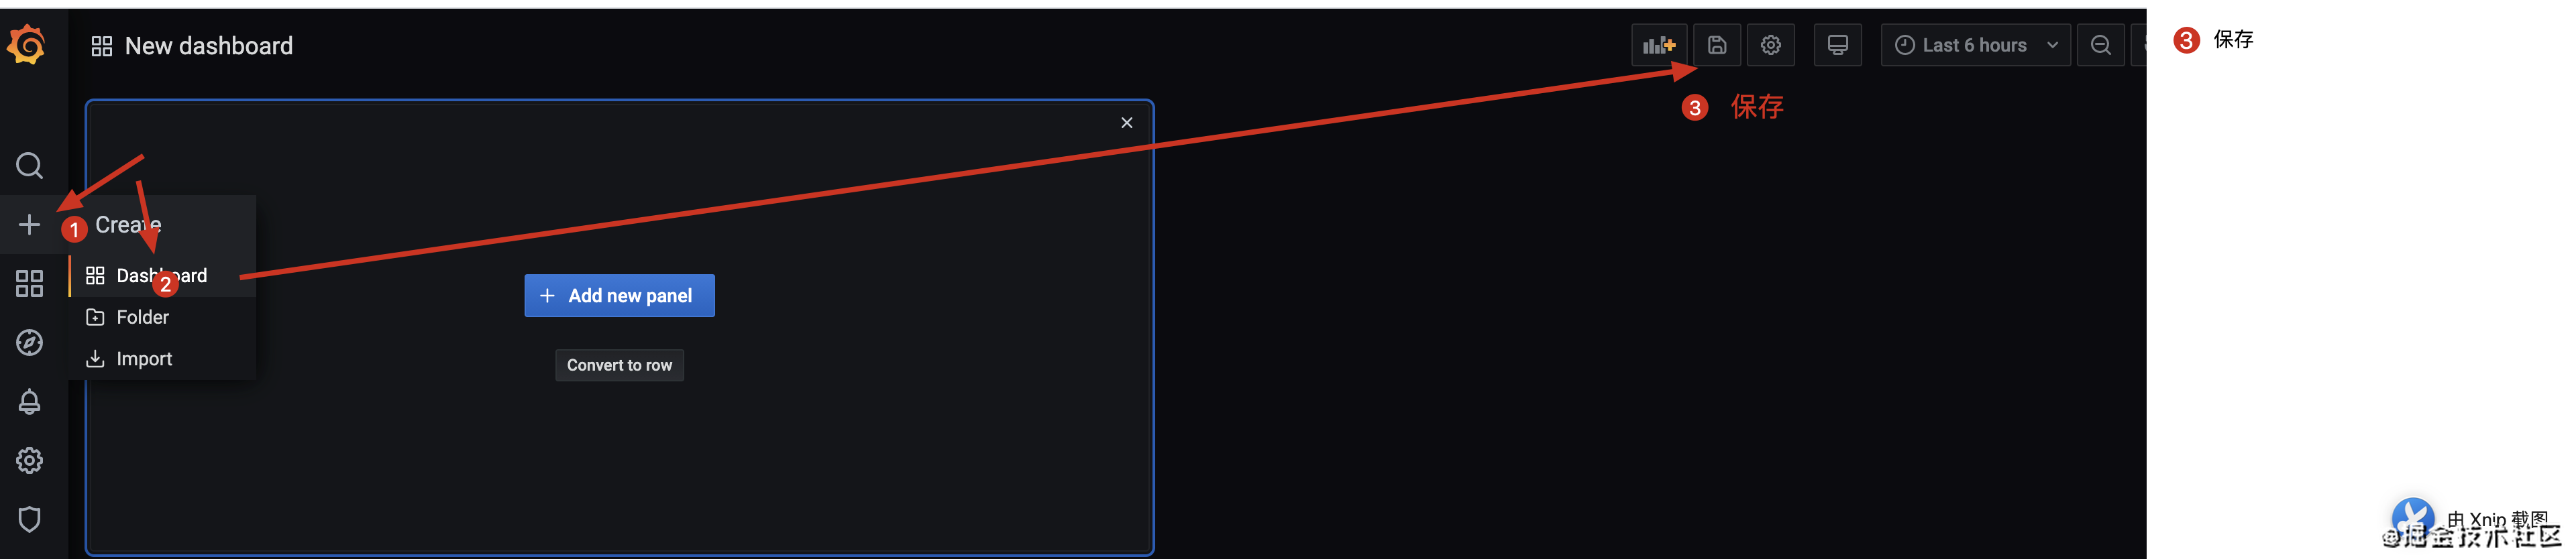
1、创建一个Dashboard
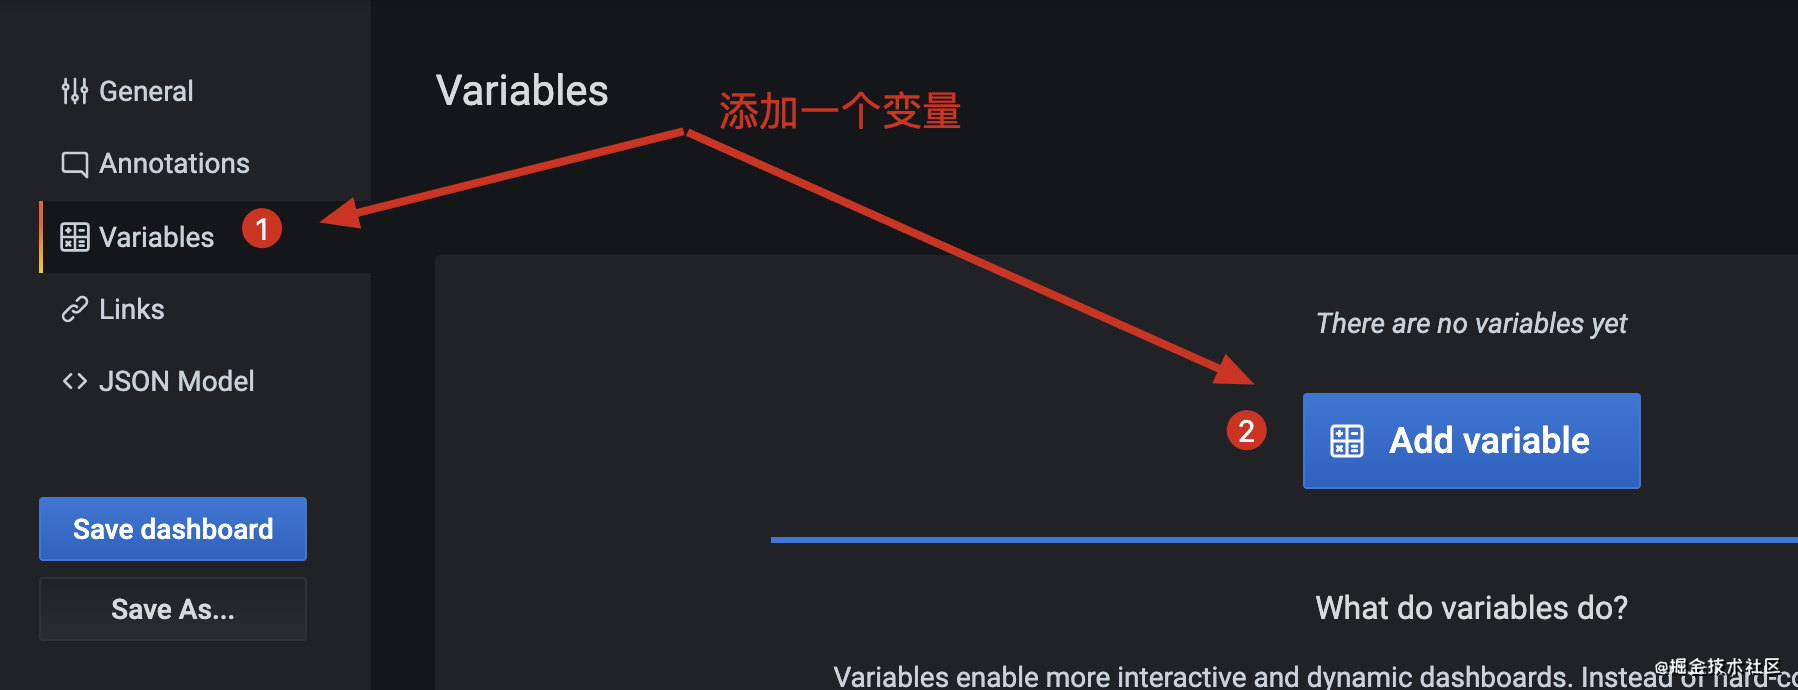
2、设置模板变量
1、在Dashboard页面点击小齿轮⚙️图标。

2、点击创建一个变量
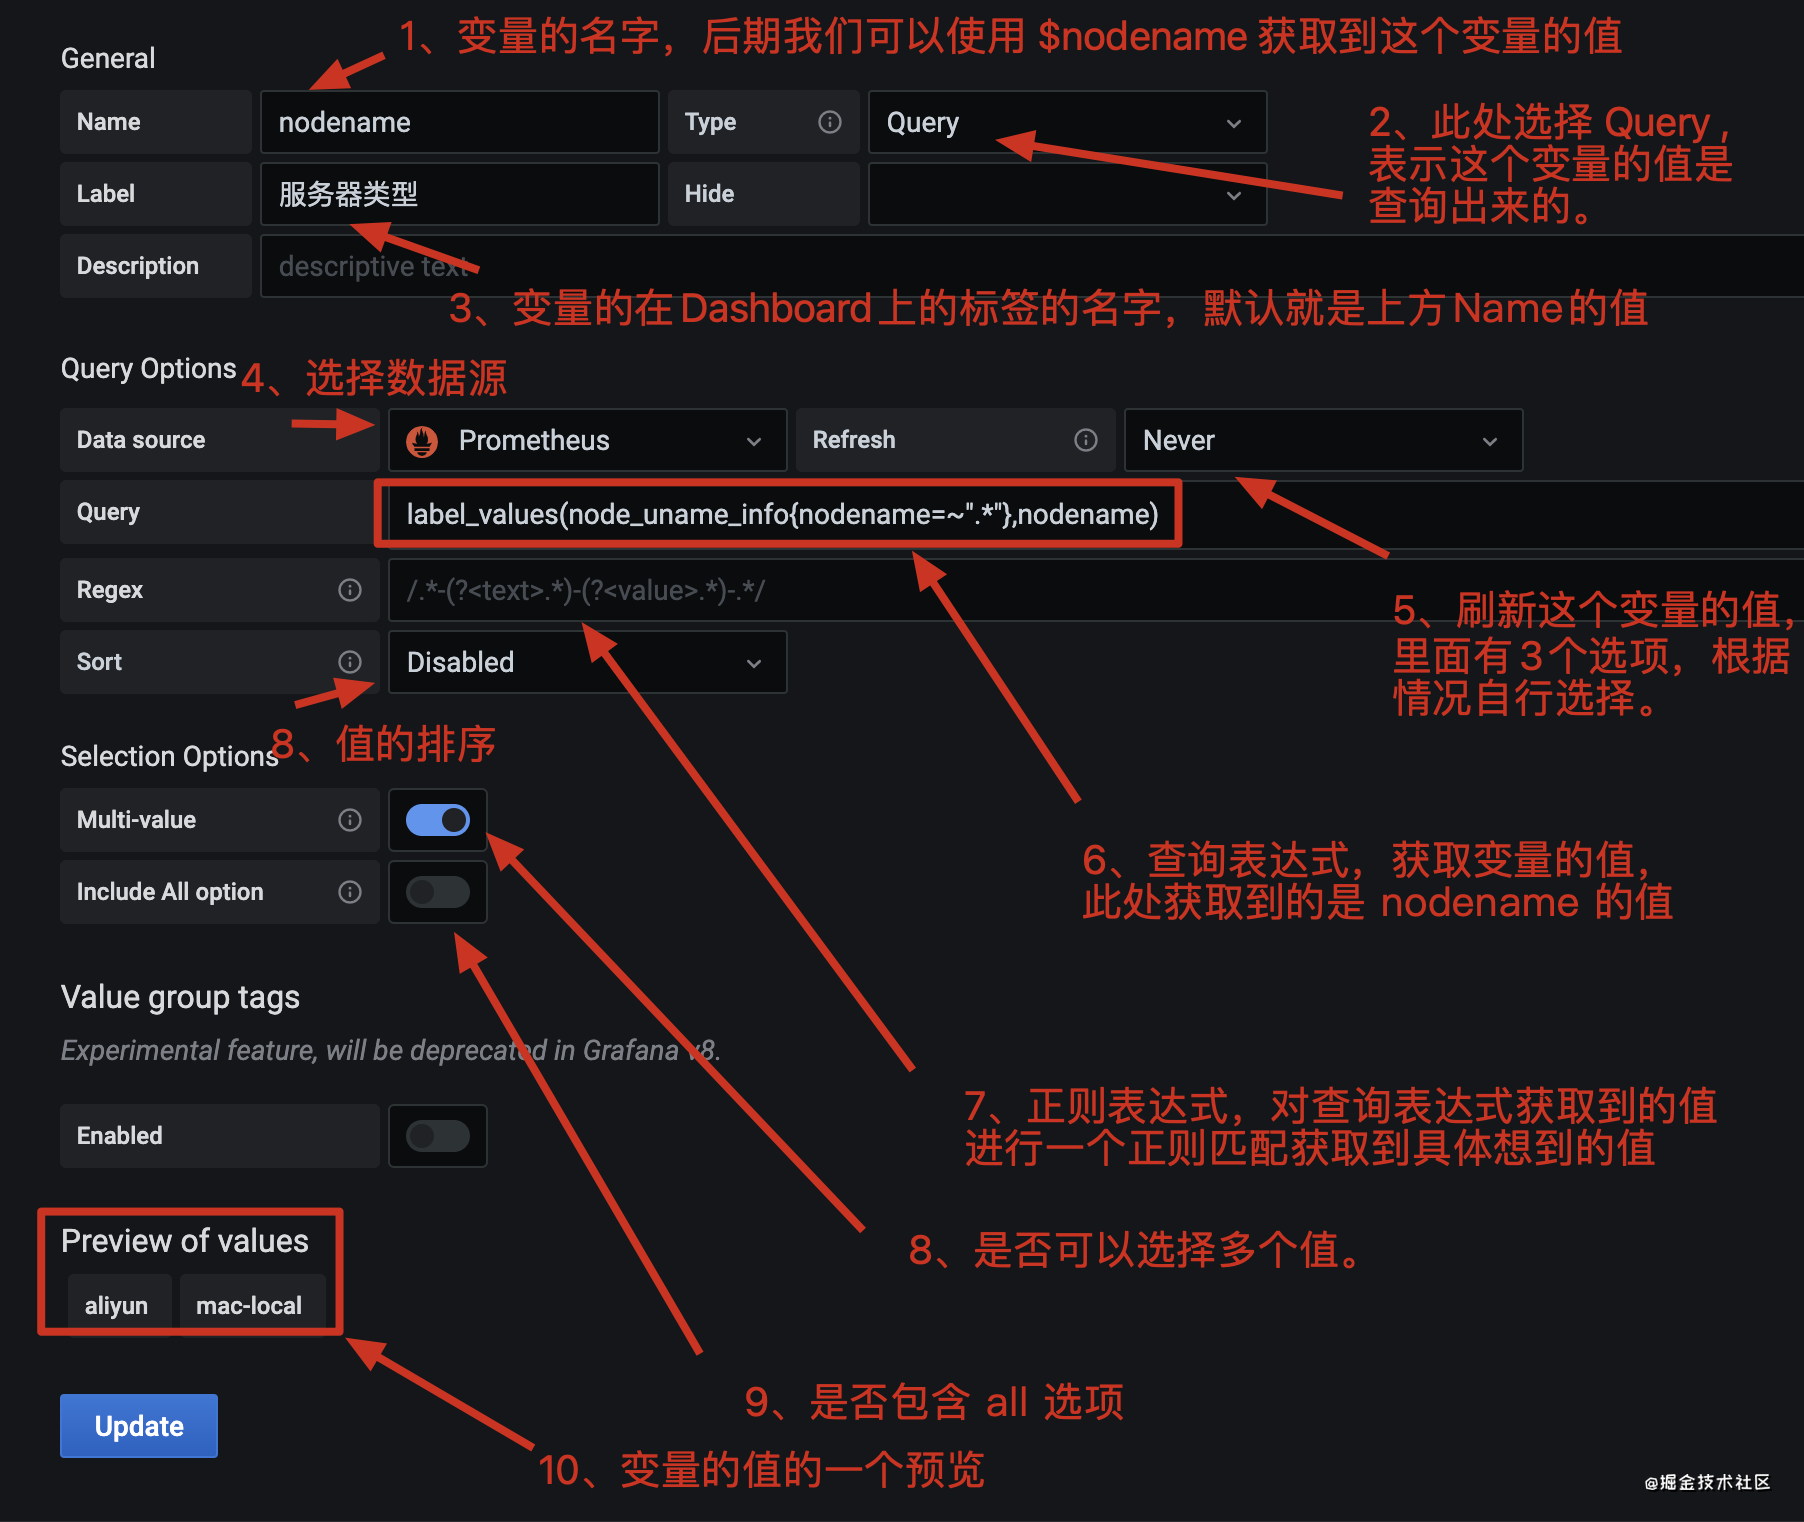
3、添加 nodename 变量,获取服务器的类型
4、添加 instance 变量
注意:instance变量的值是根据上一步 nodename 变量的值而来的,及选择不同的 nodename,instance 的值应该是不同的。及在 instance 变量的查询语句中需要引用 nodename 变的值,通过 $nodename 即可引用。

完成上方出现的3,4两步,即可出现需求中出现的画面
3、创建一个图表,监控一下 cpu 的使用率

4、上方例子的完成json字符串
{
  "annotations": {
    "list": [
      {
        "builtIn": 1,
        "datasource": "-- Grafana --",
        "enable": true,
        "hide": true,
        "iconColor": "rgba(0, 211, 255, 1)",
        "name": "Annotations & Alerts",
        "type": "dashboard"
      }
    ]
  },
  "editable": true,
  "gnetId": null,
  "graphTooltip": 0,
  "id": 3,
  "iteration": 1616217012533,
  "links": [],
  "panels": [
    {
      "aliasColors": {},
      "bars": false,
      "dashLength": 10,
      "dashes": false,
      "datasource": null,
      "decimals": 2,
      "description": "",
      "fieldConfig": {
        "defaults": {
          "custom": {},
          "unit": "percent"
        },
        "overrides": []
      },
      "fill": 1,
      "fillGradient": 0,
      "gridPos": {
        "h": 8,
        "w": 24,
        "x": 0,
        "y": 0
      },
      "hiddenSeries": false,
      "id": 2,
      "legend": {
        "alignAsTable": true,
        "avg": true,
        "current": true,
        "max": true,
        "min": true,
        "rightSide": true,
        "show": true,
        "total": false,
        "values": true
      },
      "lines": true,
      "linewidth": 1,
      "nullPointMode": "null",
      "options": {
        "alertThreshold": true
      },
      "percentage": false,
      "pluginVersion": "7.4.3",
      "pointradius": 2,
      "points": true,
      "renderer": "flot",
      "seriesOverrides": [],
      "spaceLength": 10,
      "stack": false,
      "steppedLine": false,
      "targets": [
        {
          "expr": "(1 - avg(irate(node_cpu_seconds_total{mode='idle',nodename=~\"$nodename\",instance=~\"$instance\"}[5m])) by (instance)) * 100",
          "interval": "",
          "legendFormat": "{{instance}} CPU使用率",
          "refId": "A"
        }
      ],
      "thresholds": [],
      "timeFrom": null,
      "timeRegions": [],
      "timeShift": null,
      "title": "$instance CPU使用率",
      "tooltip": {
        "shared": true,
        "sort": 0,
        "value_type": "individual"
      },
      "type": "graph",
      "xaxis": {
        "buckets": null,
        "mode": "time",
        "name": null,
        "show": true,
        "values": []
      },
      "yaxes": [
        {
          "$$hashKey": "object:231",
          "format": "percent",
          "label": null,
          "logBase": 1,
          "max": null,
          "min": null,
          "show": true
        },
        {
          "$$hashKey": "object:232",
          "format": "short",
          "label": null,
          "logBase": 1,
          "max": null,
          "min": null,
          "show": true
        }
      ],
      "yaxis": {
        "align": false,
        "alignLevel": null
      }
    }
  ],
  "schemaVersion": 27,
  "style": "dark",
  "tags": [],
  "templating": {
    "list": [
      {
        "allValue": null,
        "current": {
          "selected": true,
          "tags": [],
          "text": [
            "mac-local"
          ],
          "value": [
            "mac-local"
          ]
        },
        "datasource": null,
        "definition": "label_values(node_uname_info{nodename=~\".*\"},nodename)",
        "description": null,
        "error": null,
        "hide": 0,
        "includeAll": false,
        "label": "服务器类型",
        "multi": true,
        "name": "nodename",
        "options": [
          {
            "selected": false,
            "text": "aliyun",
            "value": "aliyun"
          },
          {
            "selected": true,
            "text": "mac-local",
            "value": "mac-local"
          }
        ],
        "query": {
          "query": "label_values(node_uname_info{nodename=~\".*\"},nodename)",
          "refId": "StandardVariableQuery"
        },
        "refresh": 0,
        "regex": "",
        "skipUrlSync": false,
        "sort": 0,
        "tagValuesQuery": "",
        "tags": [],
        "tagsQuery": "",
        "type": "query",
        "useTags": false
      },
      {
        "allValue": null,
        "current": {
          "selected": true,
          "text": [
            "localhost:9081"
          ],
          "value": [
            "localhost:9081"
          ]
        },
        "datasource": null,
        "definition": "label_values(node_uname_info{nodename=~\"$nodename\",instance=~\".*\"},instance)",
        "description": null,
        "error": null,
        "hide": 0,
        "includeAll": false,
        "label": null,
        "multi": true,
        "name": "instance",
        "options": [
          {
            "selected": true,
            "text": "localhost:9081",
            "value": "localhost:9081"
          }
        ],
        "query": {
          "query": "label_values(node_uname_info{nodename=~\"$nodename\",instance=~\".*\"},instance)",
          "refId": "StandardVariableQuery"
        },
        "refresh": 0,
        "regex": "",
        "skipUrlSync": false,
        "sort": 0,
        "tagValuesQuery": "",
        "tags": [],
        "tagsQuery": "",
        "type": "query",
        "useTags": false
      }
    ]
  },
  "time": {
    "from": "now-5m",
    "to": "now"
  },
  "timepicker": {},
  "timezone": "",
  "title": "测试模板变量",
  "uid": "Umb3YDQMz",
  "version": 6
}
链接:https://blog.csdn.net/fu_huo_1993/article/details/115026228

 浙公网安备 33010602011771号