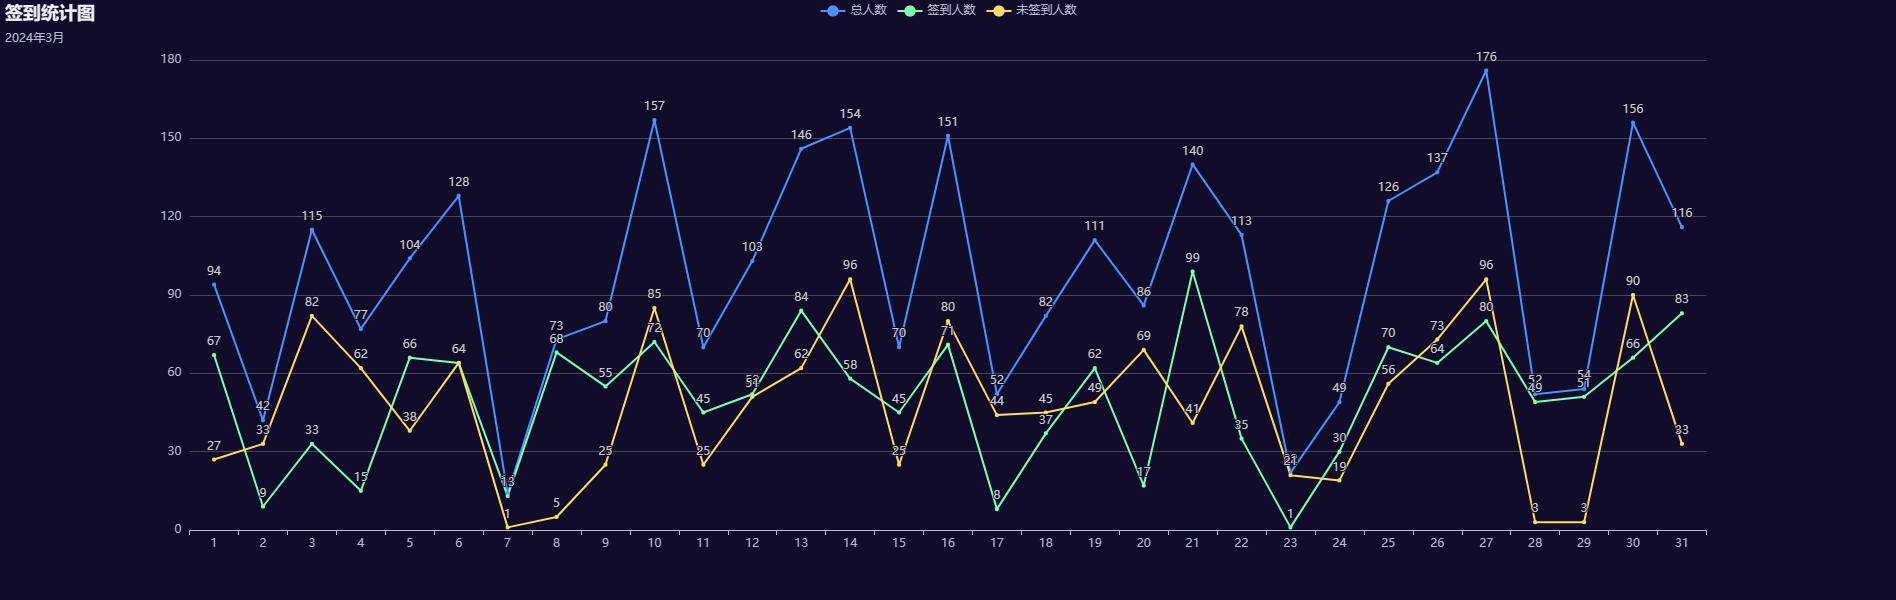
echarts.js画折线图
<!DOCTYPE html>
<html>

<head>
    <meta charset="utf-8">
    <script src="https://cdn.bootcdn.net/ajax/libs/echarts/5.4.3/echarts.min.js"></script>
</head>

<body>
    <div id="wstongChart" style="width: 100%; height: 600px;"></div>
    <script>
        function initChart() {
            var wstongChart = echarts.init(document.getElementById("wstongChart"), "dark");
            var dataChart = {
                "日期": new Array(),
                "总人数": new Array(),
                "签到人数": new Array(),
                "未签到人数": new Array()
            }
            // 初始化随机数据
            for (var i = 1; i <= 31; i++) {
                dataChart["日期"].push(i.toString());
                x = Math.ceil(Math.random() * 100);
                y = Math.ceil(Math.random() * 100);
                dataChart["总人数"].push(x + y);
                dataChart["签到人数"].push(x);
                dataChart["未签到人数"].push(y);
            }
            var option = {
                title: {
                    show: true,
                    text: "签到统计图",
                    subtext: "2024年3月"
                },
                legend: {
                    data: ["总人数", "签到人数", "未签到人数"]
                },
                xAxis: {
                    type: "category",
                    data: dataChart["日期"]
                },
                yAxis: {
                    type: "value"
                },
                series: [
                    {
                        name: "总人数",
                        type: "line",
                        data: dataChart["总人数"],
                        label: {
                            show: true,
                            position: "top"
                        }
                    },
                    {
                        name: "签到人数",
                        type: "line",
                        data: dataChart["签到人数"],
                        label: {
                            show: true,
                            position: "top"
                        }
                    },
                    {
                        name: "未签到人数",
                        type: "line",
                        data: dataChart["未签到人数"],
                        label: {
                            show: true,
                            position: "top"
                        }
                    }
                ]
            };
            wstongChart.setOption(option);
        }
        initChart();
    </script>
</body>

</html>
可以到官网看更多示例和教程 https://echarts.apache.org/zh/index.html


【推荐】国内首个AI IDE,深度理解中文开发场景,立即下载体验Trae
【推荐】编程新体验,更懂你的AI,立即体验豆包MarsCode编程助手
【推荐】抖音旗下AI助手豆包,你的智能百科全书,全免费不限次数
【推荐】轻量又高性能的 SSH 工具 IShell:AI 加持,快人一步
· 无需6万激活码!GitHub神秘组织3小时极速复刻Manus,手把手教你使用OpenManus搭建本
· Manus爆火,是硬核还是营销?
· 终于写完轮子一部分:tcp代理 了,记录一下
· 别再用vector<bool>了!Google高级工程师:这可能是STL最大的设计失误
· 单元测试从入门到精通