

go profile使用
1.代码内置profile支持,
kill -SIGUSR1 进程号,隔30秒,再执行一次
2.在bin 目录下,获取cpu_profile.out ,堆栈的profile文件
3.下载到本地处理,
4. cmd命令台执行。
go tool pprof -http=:8080 文件名
5.分析top10耗时时长问题的地方。进行优化处理
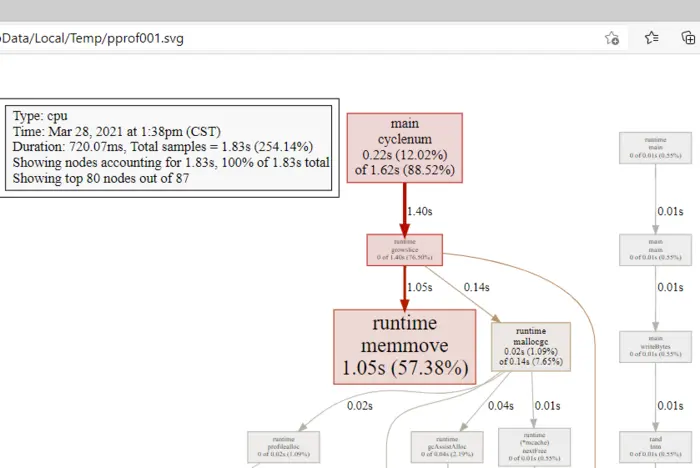
- 每个框中第一行数字表示当前函数占用 cpu 的百分比,第二行数字表示当前函数累计占用 cpu 的百分比
- CPU profile:报告程序的 CPU 使用情况,按照一定频率去采集应用程序在 CPU 和寄存器上面的数据
- cpu top函数的含义:
| flat | 当前函数占用 cpu 耗时 |
| flat % | 当前函数占用 cpu 耗时百分比 |
| sum% | 函数占用 cpu 时间累积占比,从小到大一直累积到 100% |
| cum | 当前函数加上调用当前函数的函数占用 cpu 的总耗时 |
| %cum | 当前函数加上调用当前函数的函数占用 cpu 的总耗时占比 |
