Linux-监控三剑客之Grafana
Grafana
一、环境准备
| 环境 | ||
|---|---|---|
| zabbix-server | zabbix服务端 | 10.0.0.62 |
| grafana-server | grafana服务端 | 10.0.0.63 |
二、使用流程
1.部署grafana 9.3.6
[root@grafana-server ~]# ll total 119100 -rw-------. 1 root root 1340 Jan 9 09:09 anaconda-ks.cfg -rw-r--r-- 1 root root 88935132 Mar 21 08:16 grafana-9.3.6-1.x86_64.rpm -rw-r--r-- 1 root root 33016641 Mar 21 08:16 grafana-9.3.6-alexanderzobnin-zabbix-app-v4.2.10.tar.gz #安装grafana [root@grafana-server ~]# yum localinstall -y grafana-9.3.6-1.x86_64.rpm #启动grafana [root@grafana-server ~]# systemctl enable --now grafana-server.service [root@grafana-server ~]# ss -lnutp|grep grafana tcp LISTEN 0 128 [::]:3000 [::]:* users:(("grafana-server",pid=6046,fd=11)) #解压插件 [root@grafana-server ~]# tar xf grafana-9.3.6-alexanderzobnin-zabbix-app-v4.2.10.tar.gz [root@grafana-server ~]# ll total 119104 drwxr-xr-x 7 root root 4096 Mar 20 21:42 alexanderzobnin-zabbix-app #创建插件目录 [root@grafana-server ~]# mkdir -p /var/lib/grafana/plugins [root@grafana-server ~]# mv alexanderzobnin-zabbix-app/ /var/lib/grafana/plugins #重启grafana [root@grafana-server ~]# systemctl restart grafana-server.service #查看grafana插件 [root@grafana-server ~]# grafana-cli plugins ls installed plugins: alexanderzobnin-zabbix-app @ 4.2.10 Please restart Grafana after installing plugins. Refer to Grafana documentation for instructions if necessary.
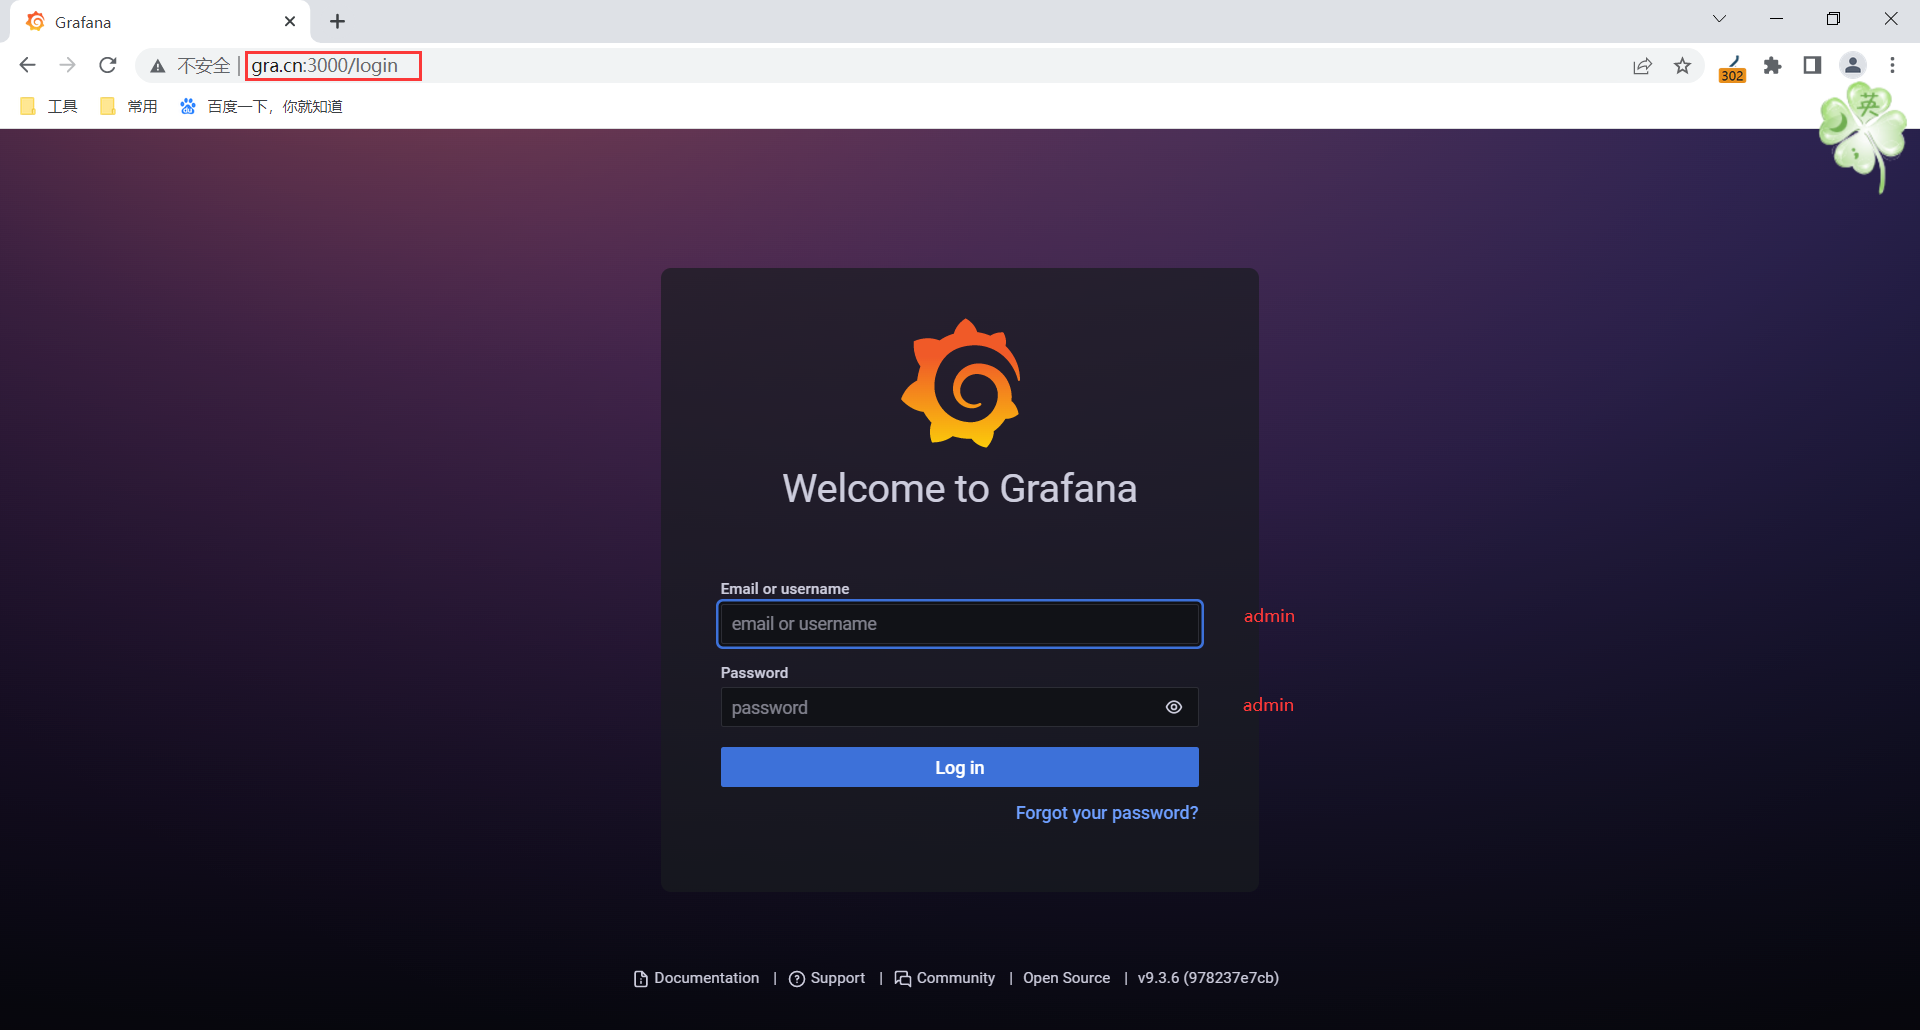
2.web页面访问
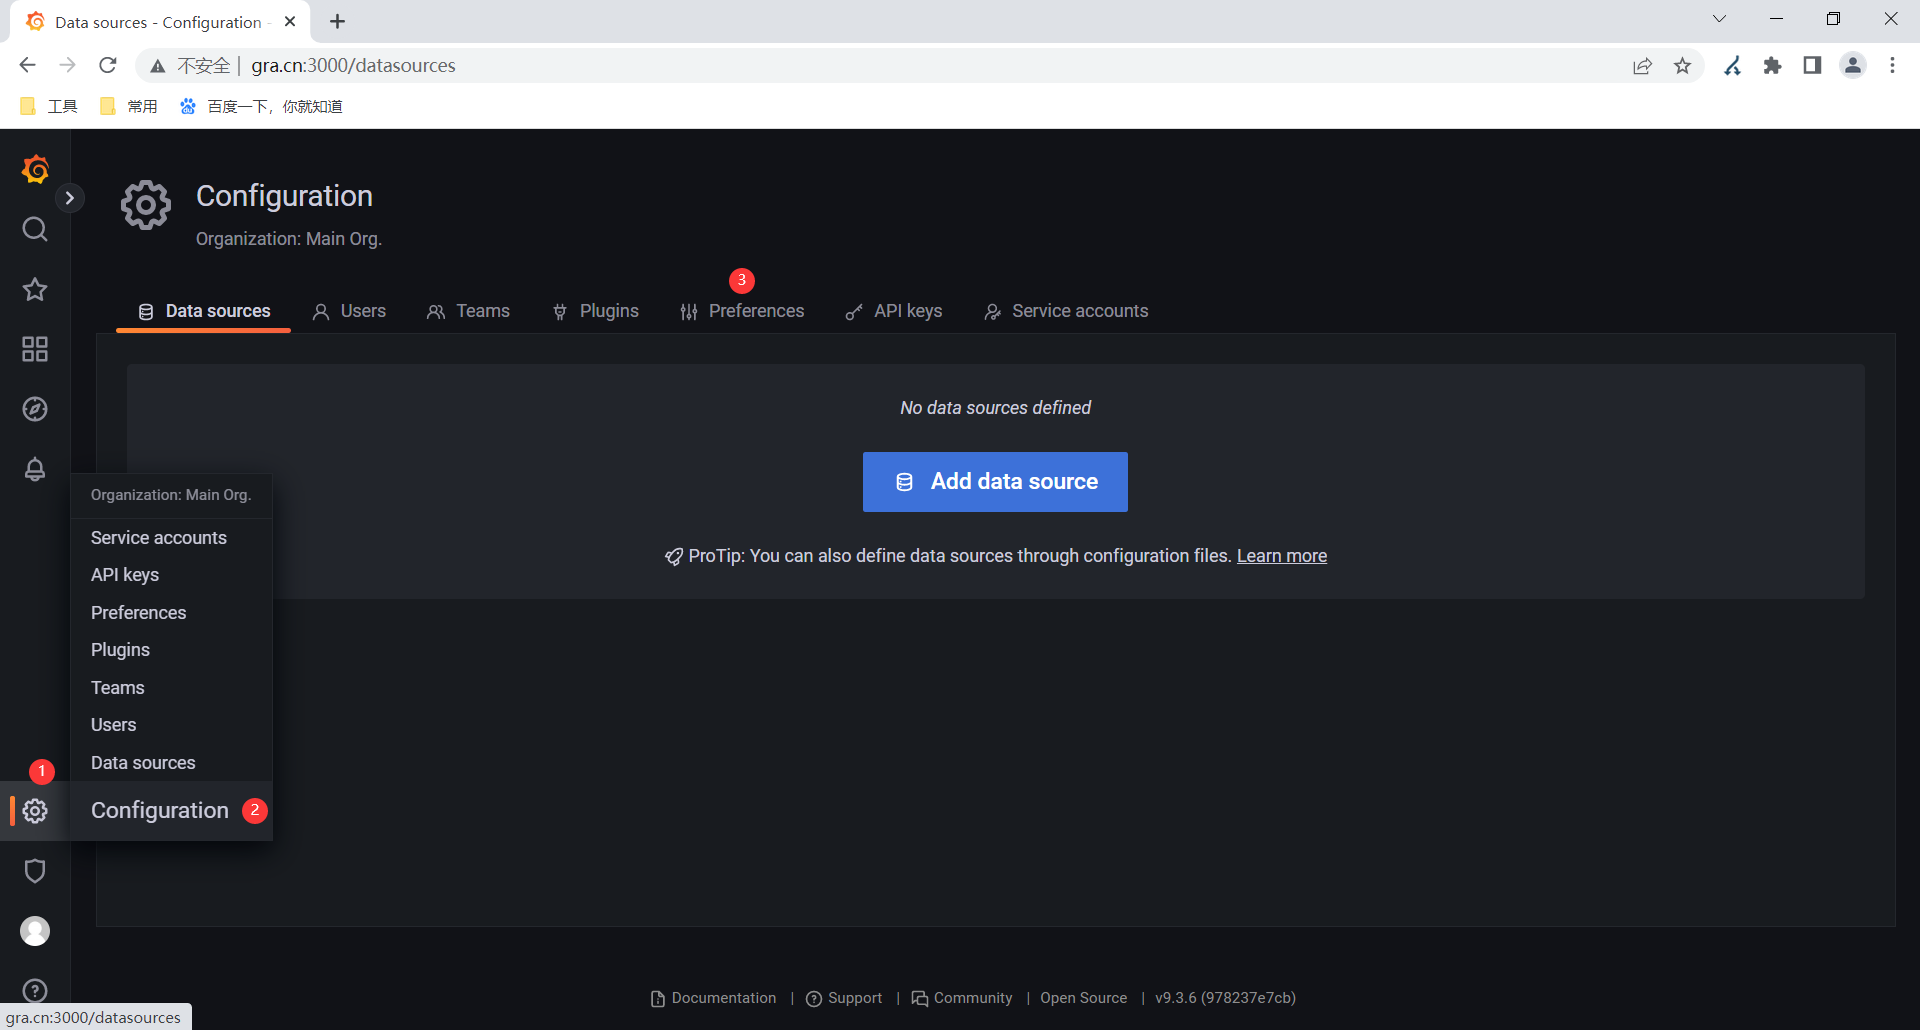
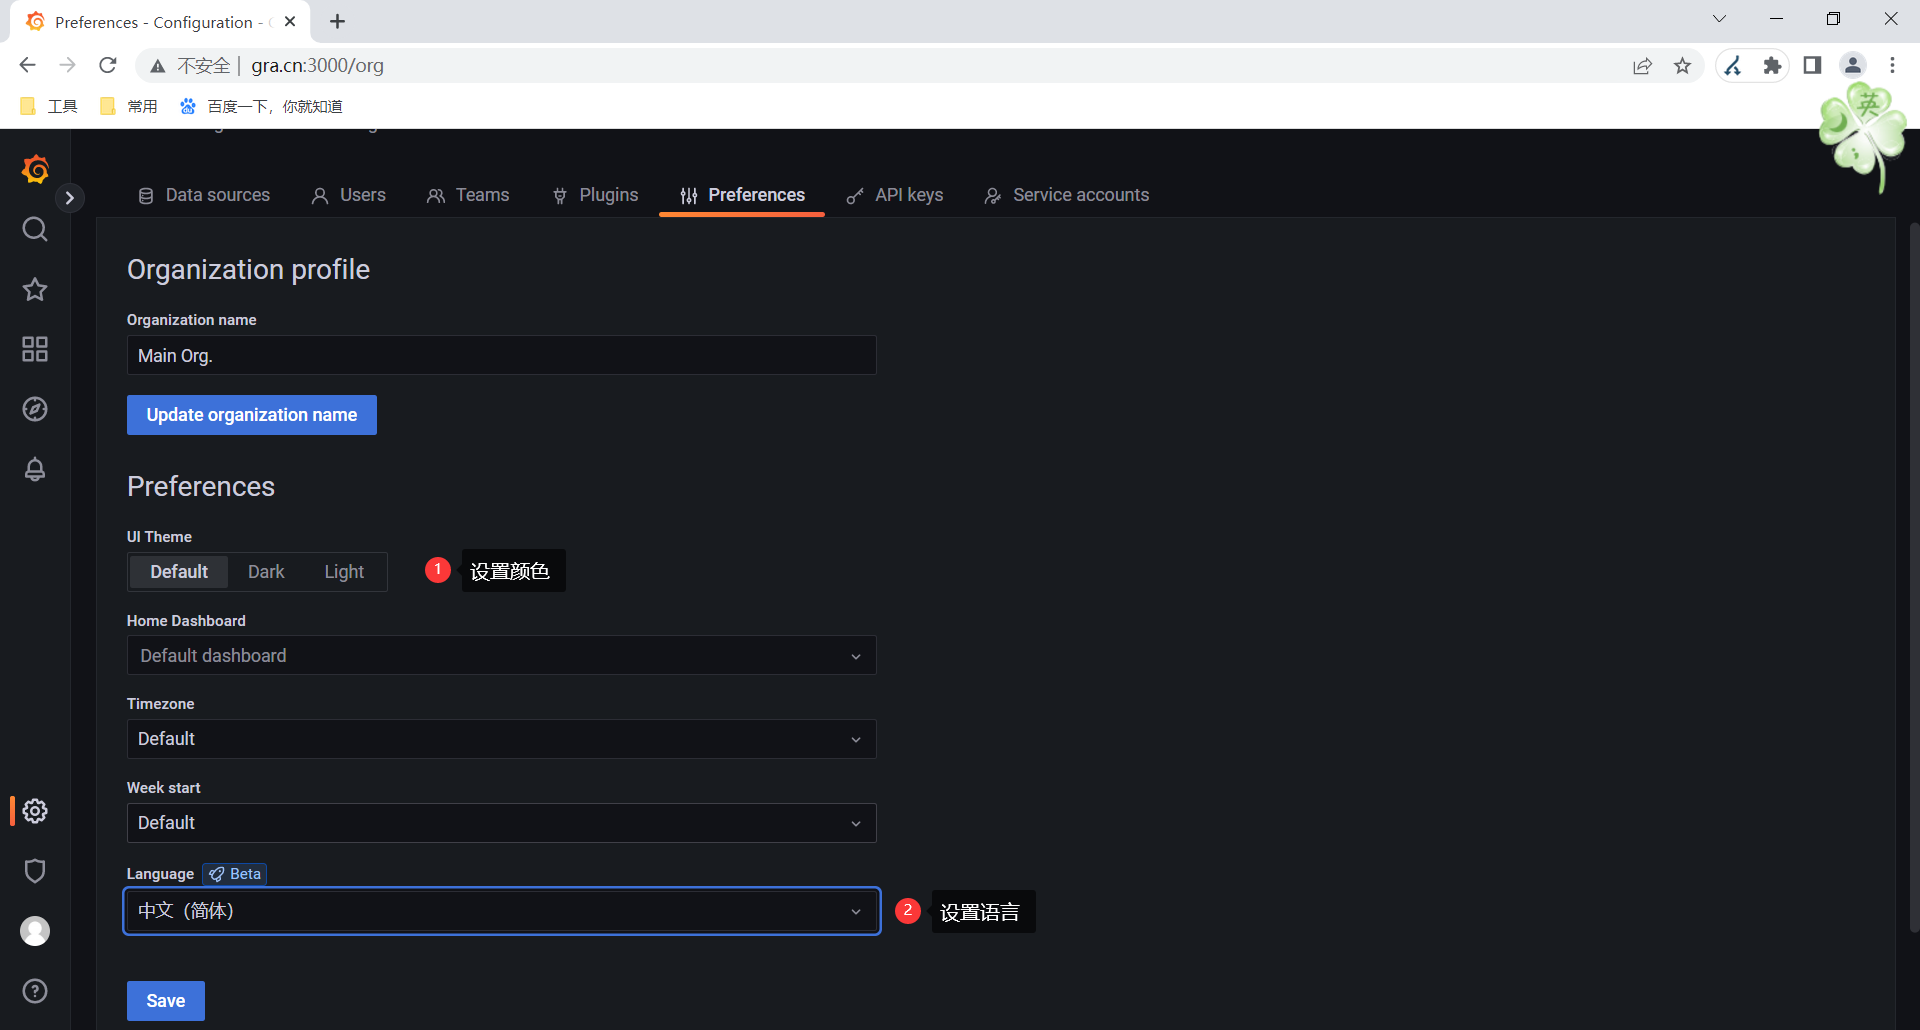
3.简单配置
4. 配置zbx插件
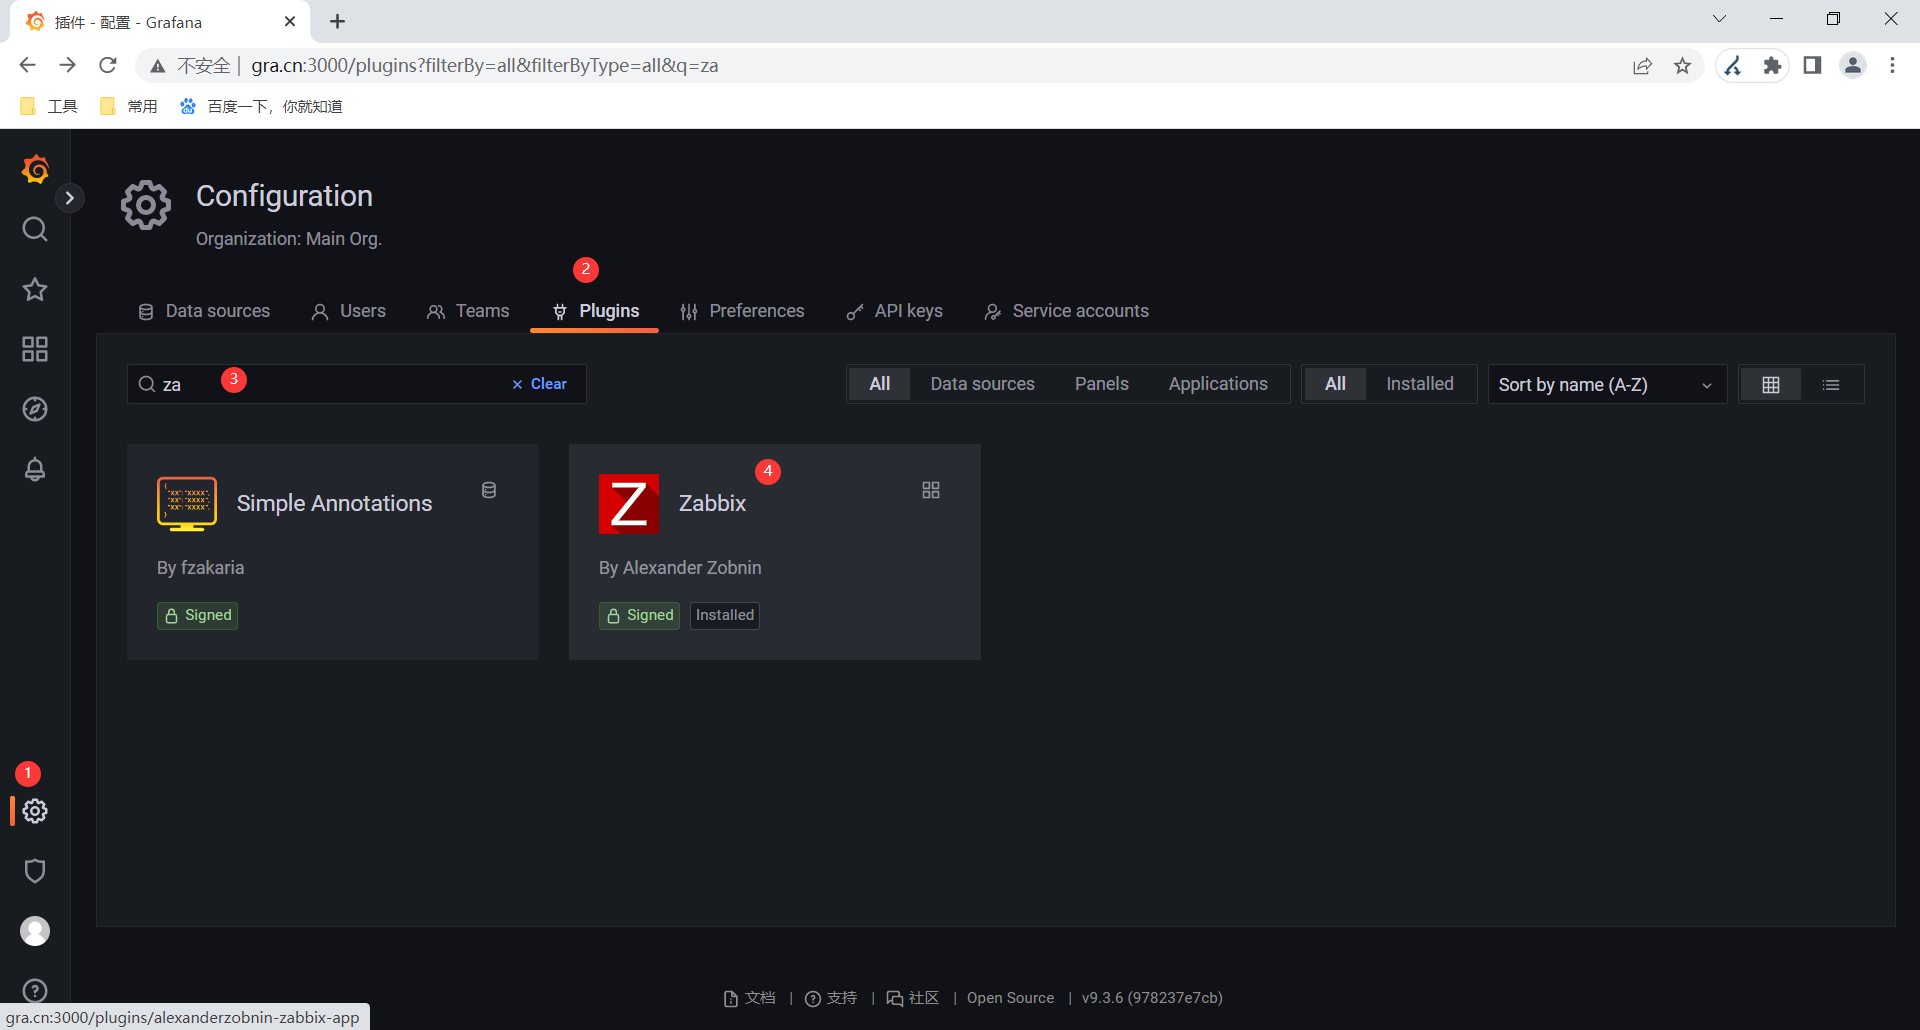
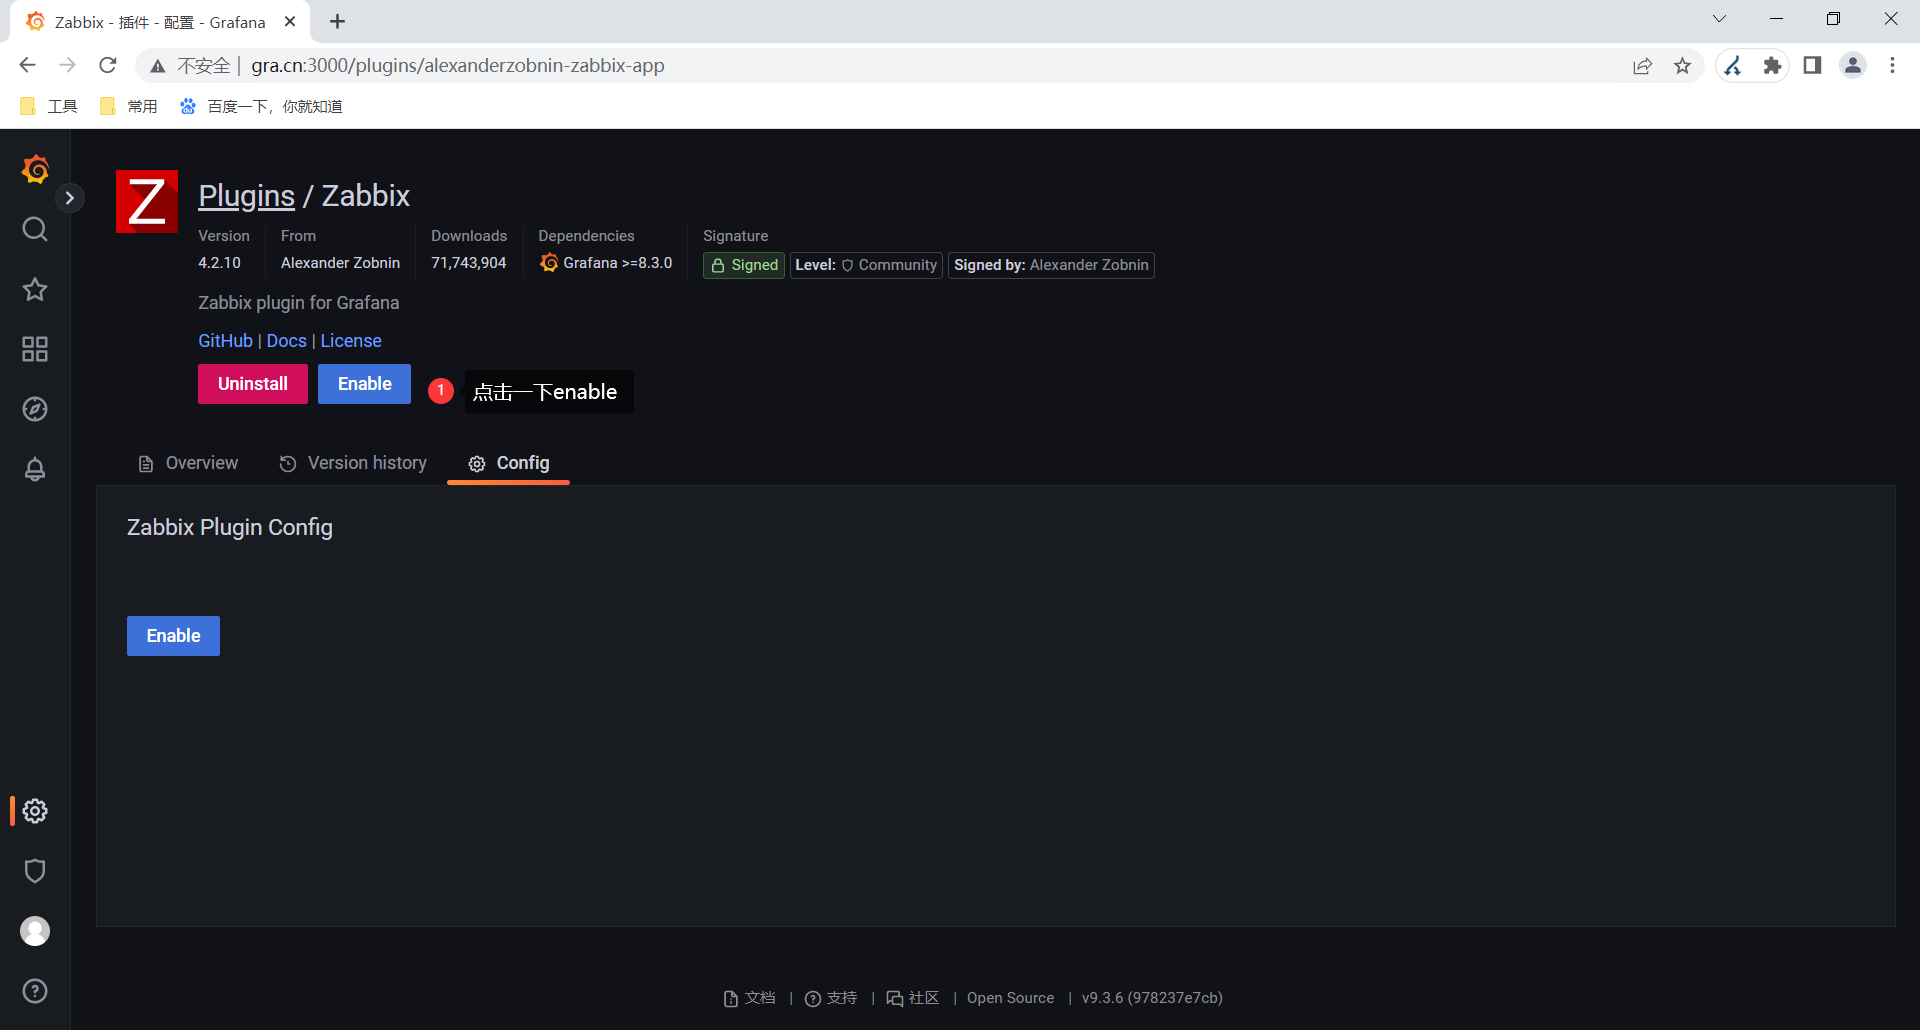
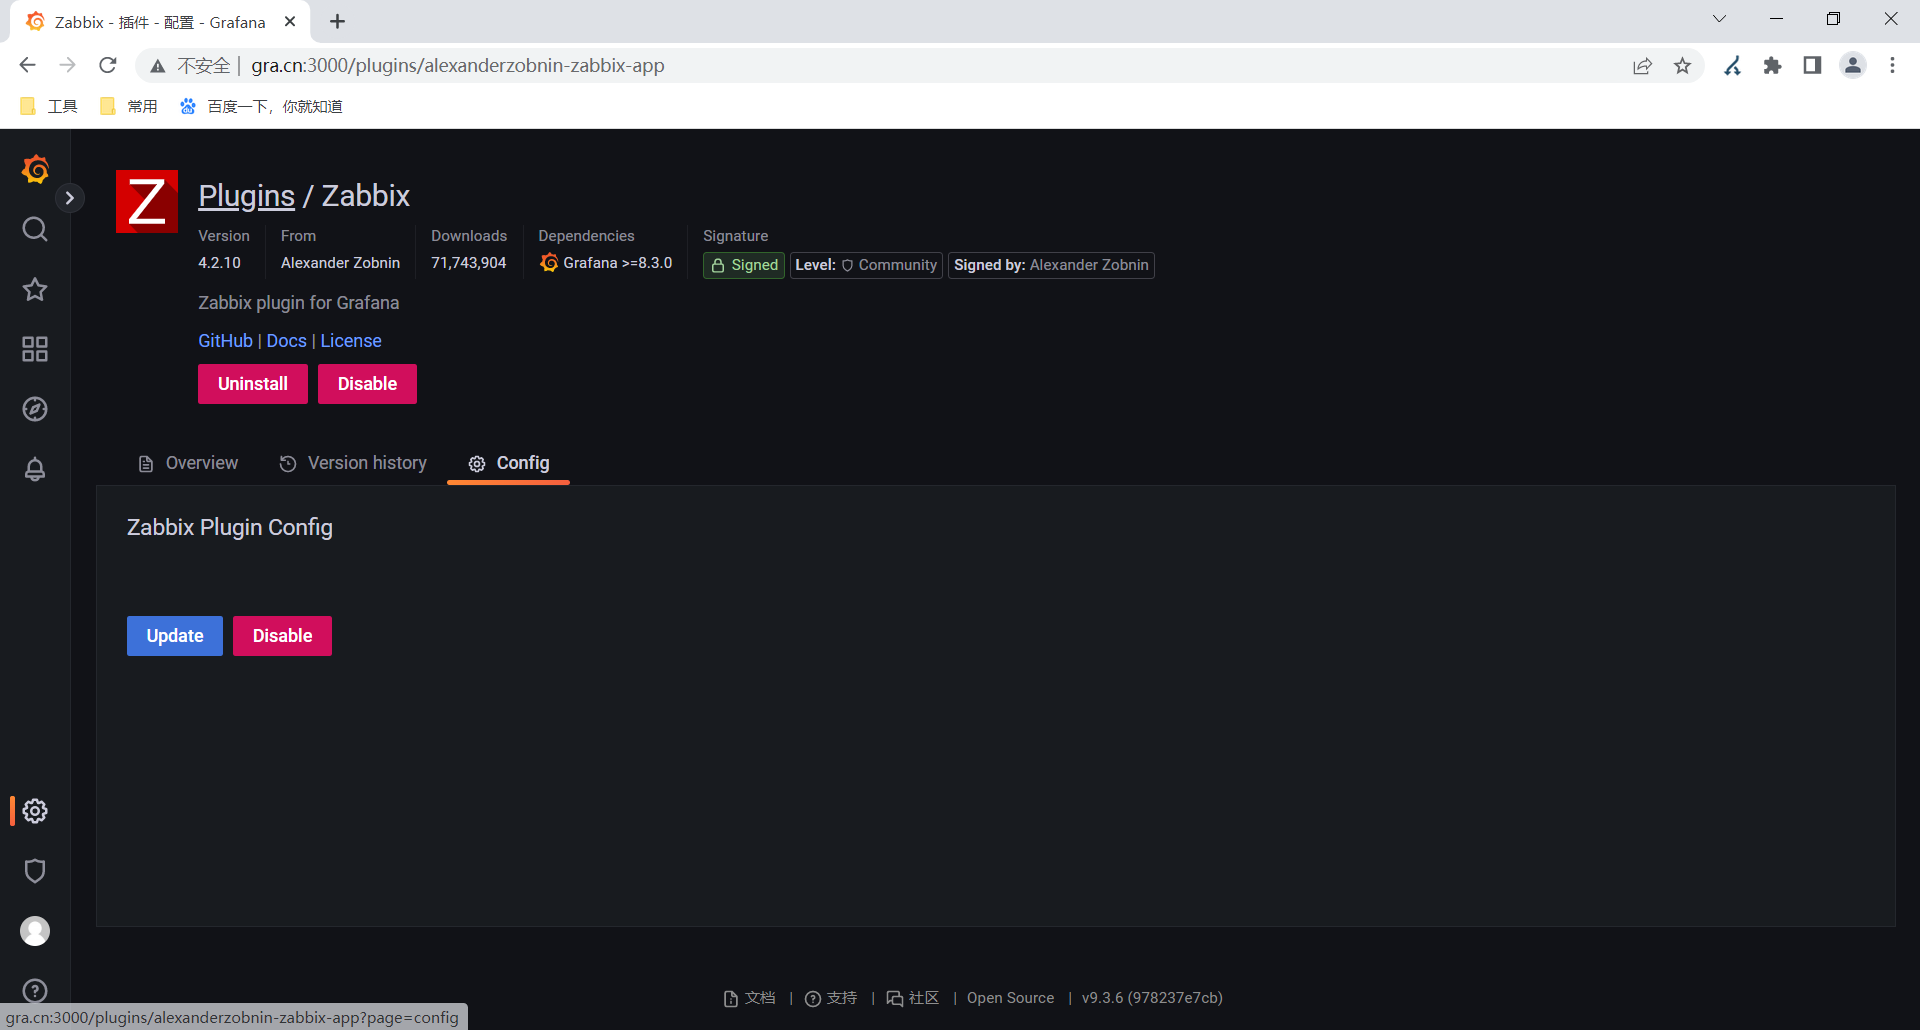
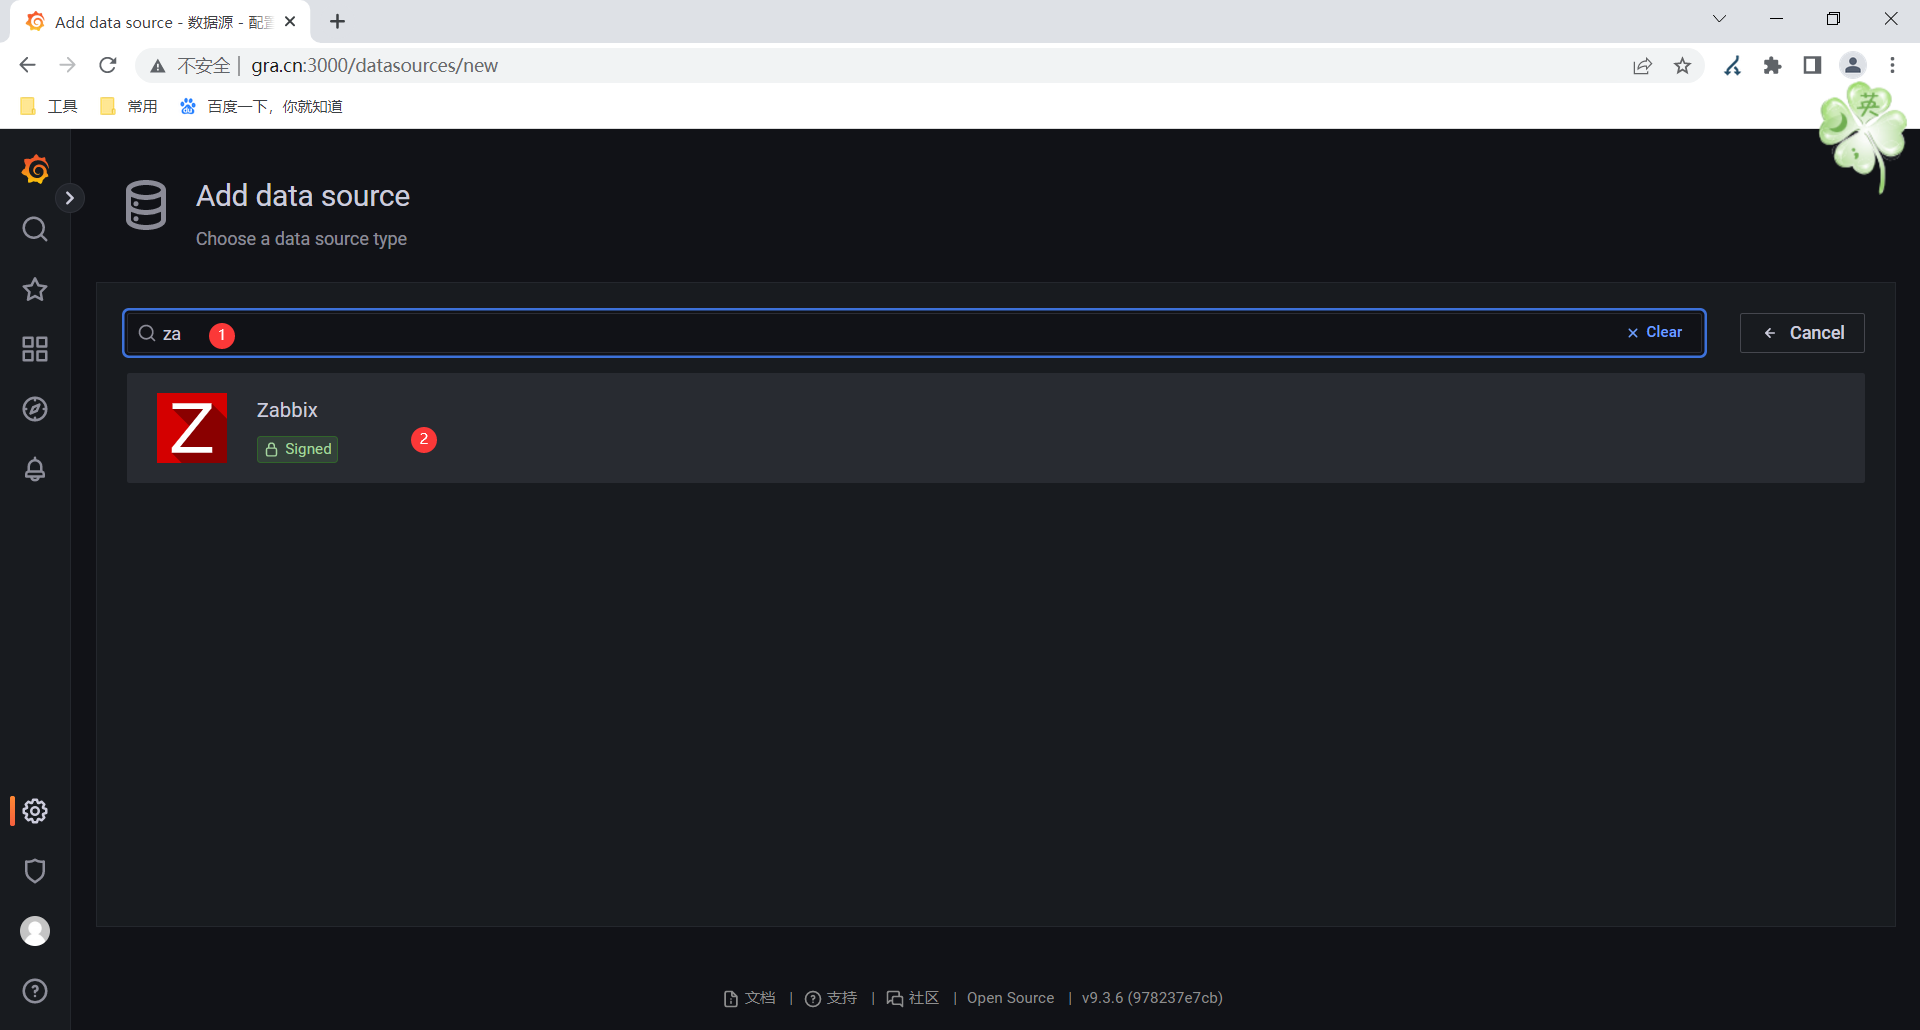
如果搜索不到zabbix表示没有安装对应的插件.
可以通过提供的软件包解压或者grafana-cli plugins install alexanderzobnin-zabbix-app安装.
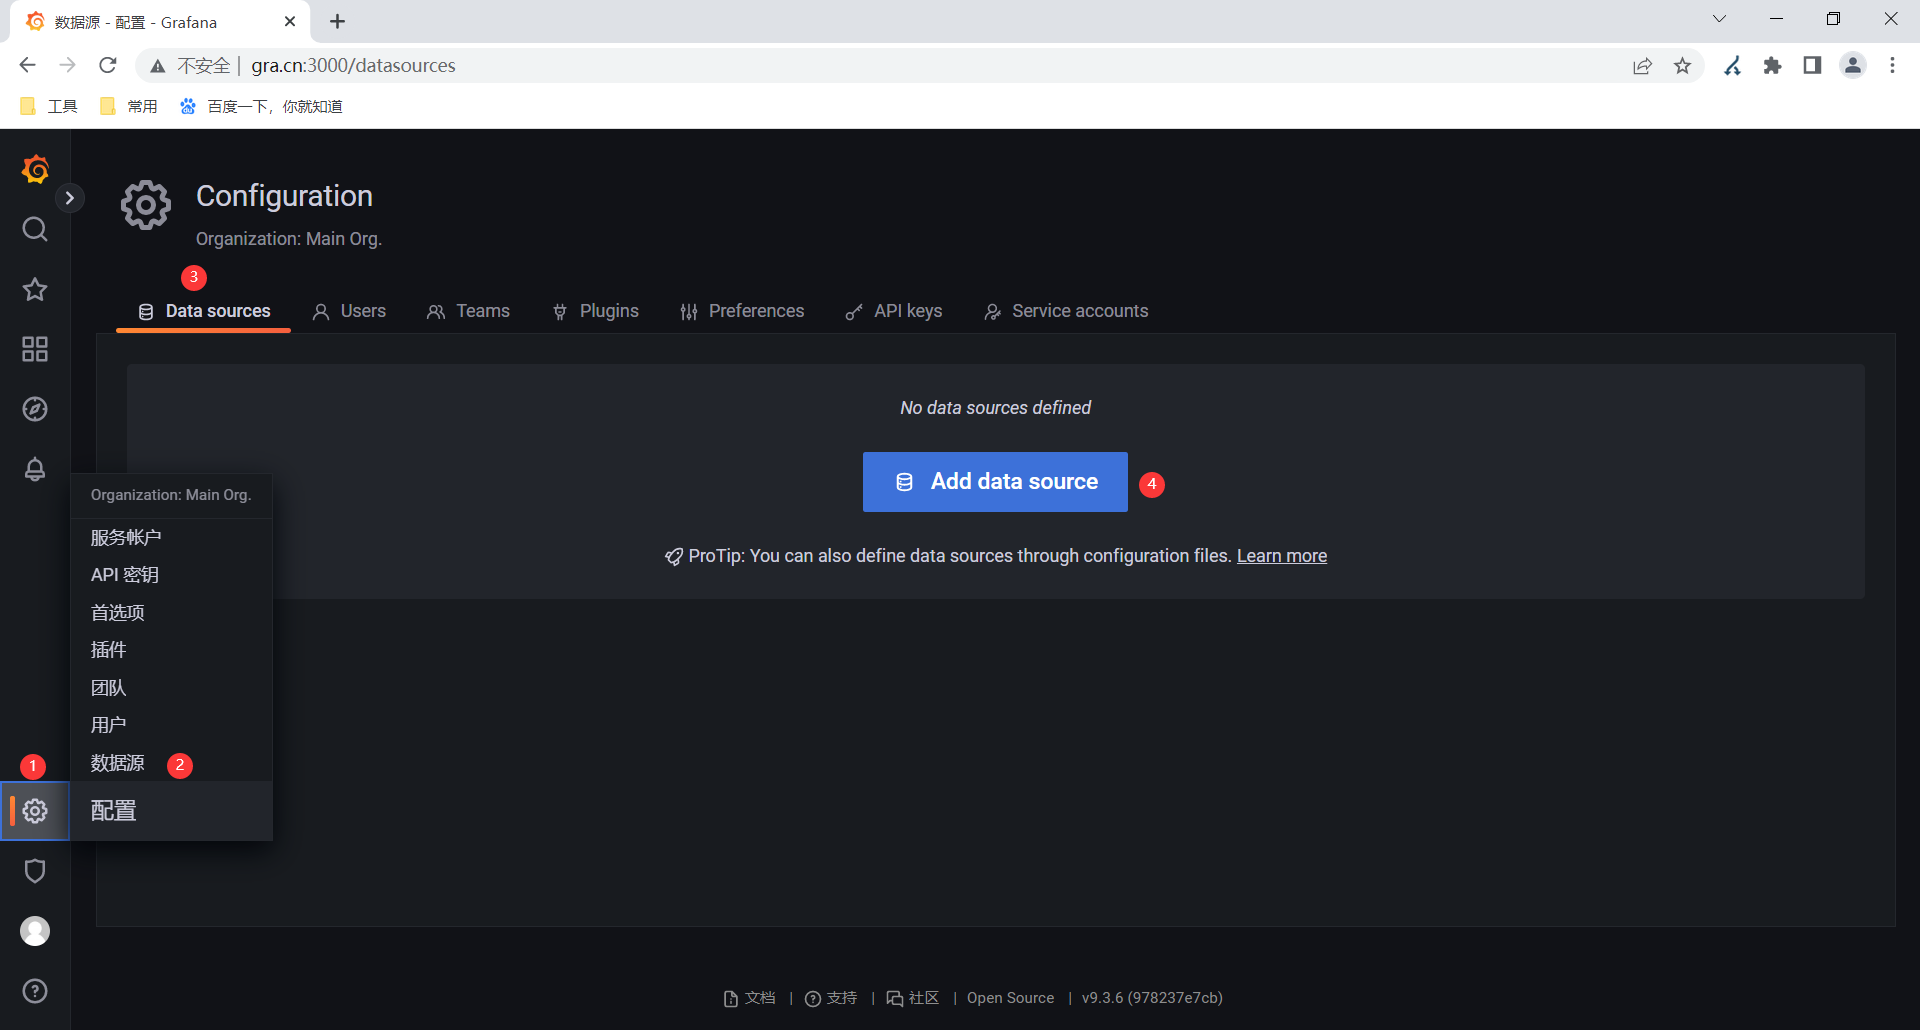
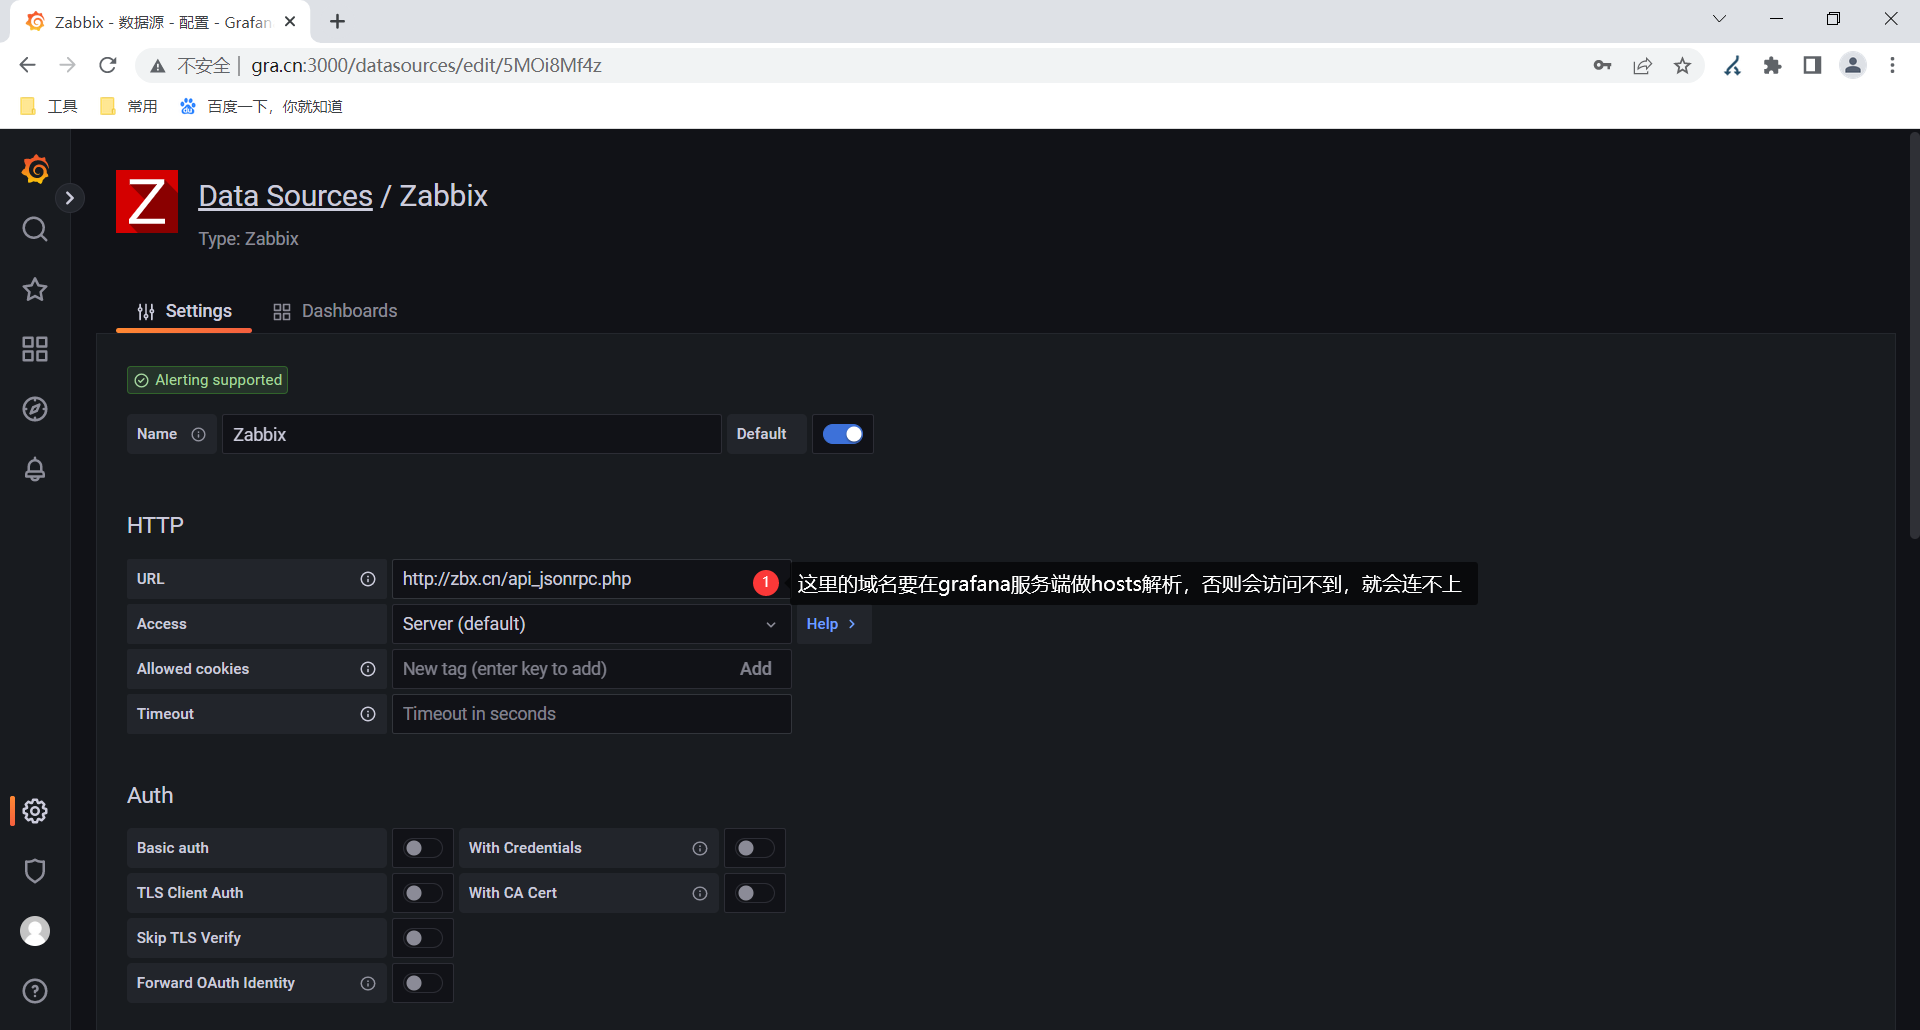
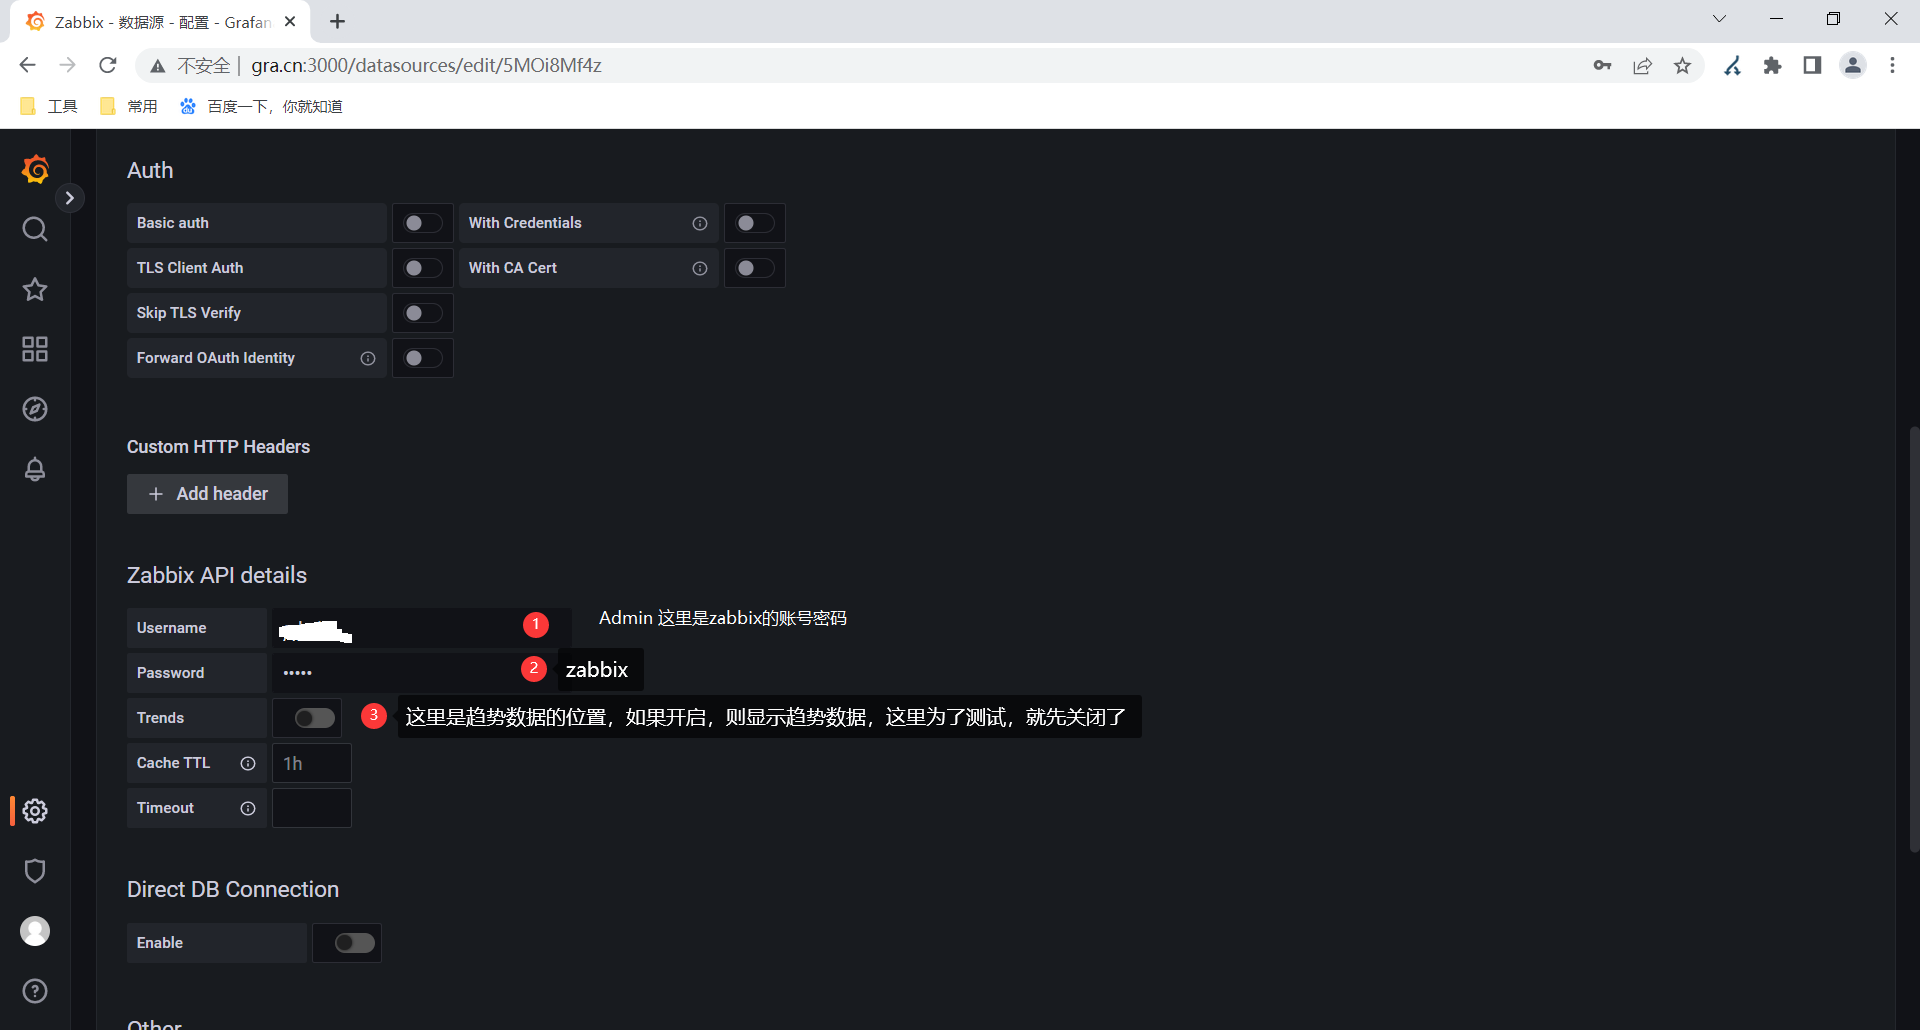
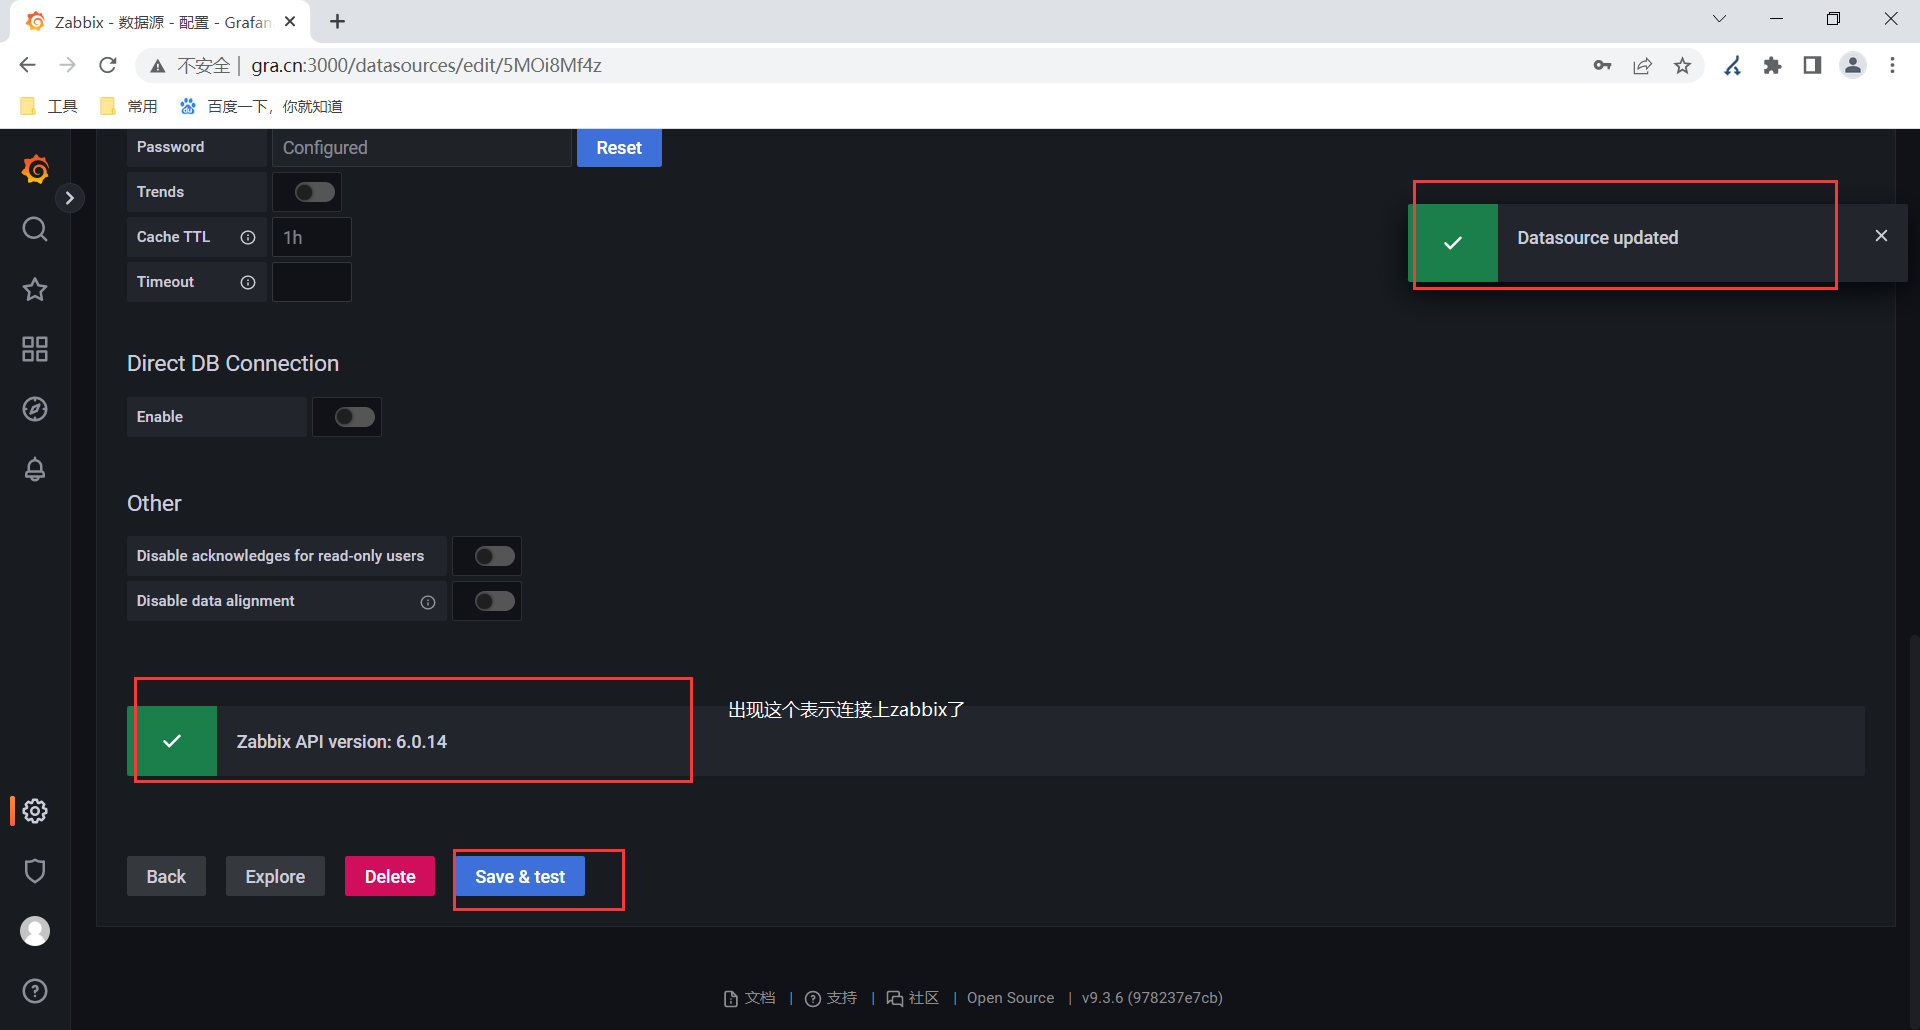
5.配置grafana的数据源
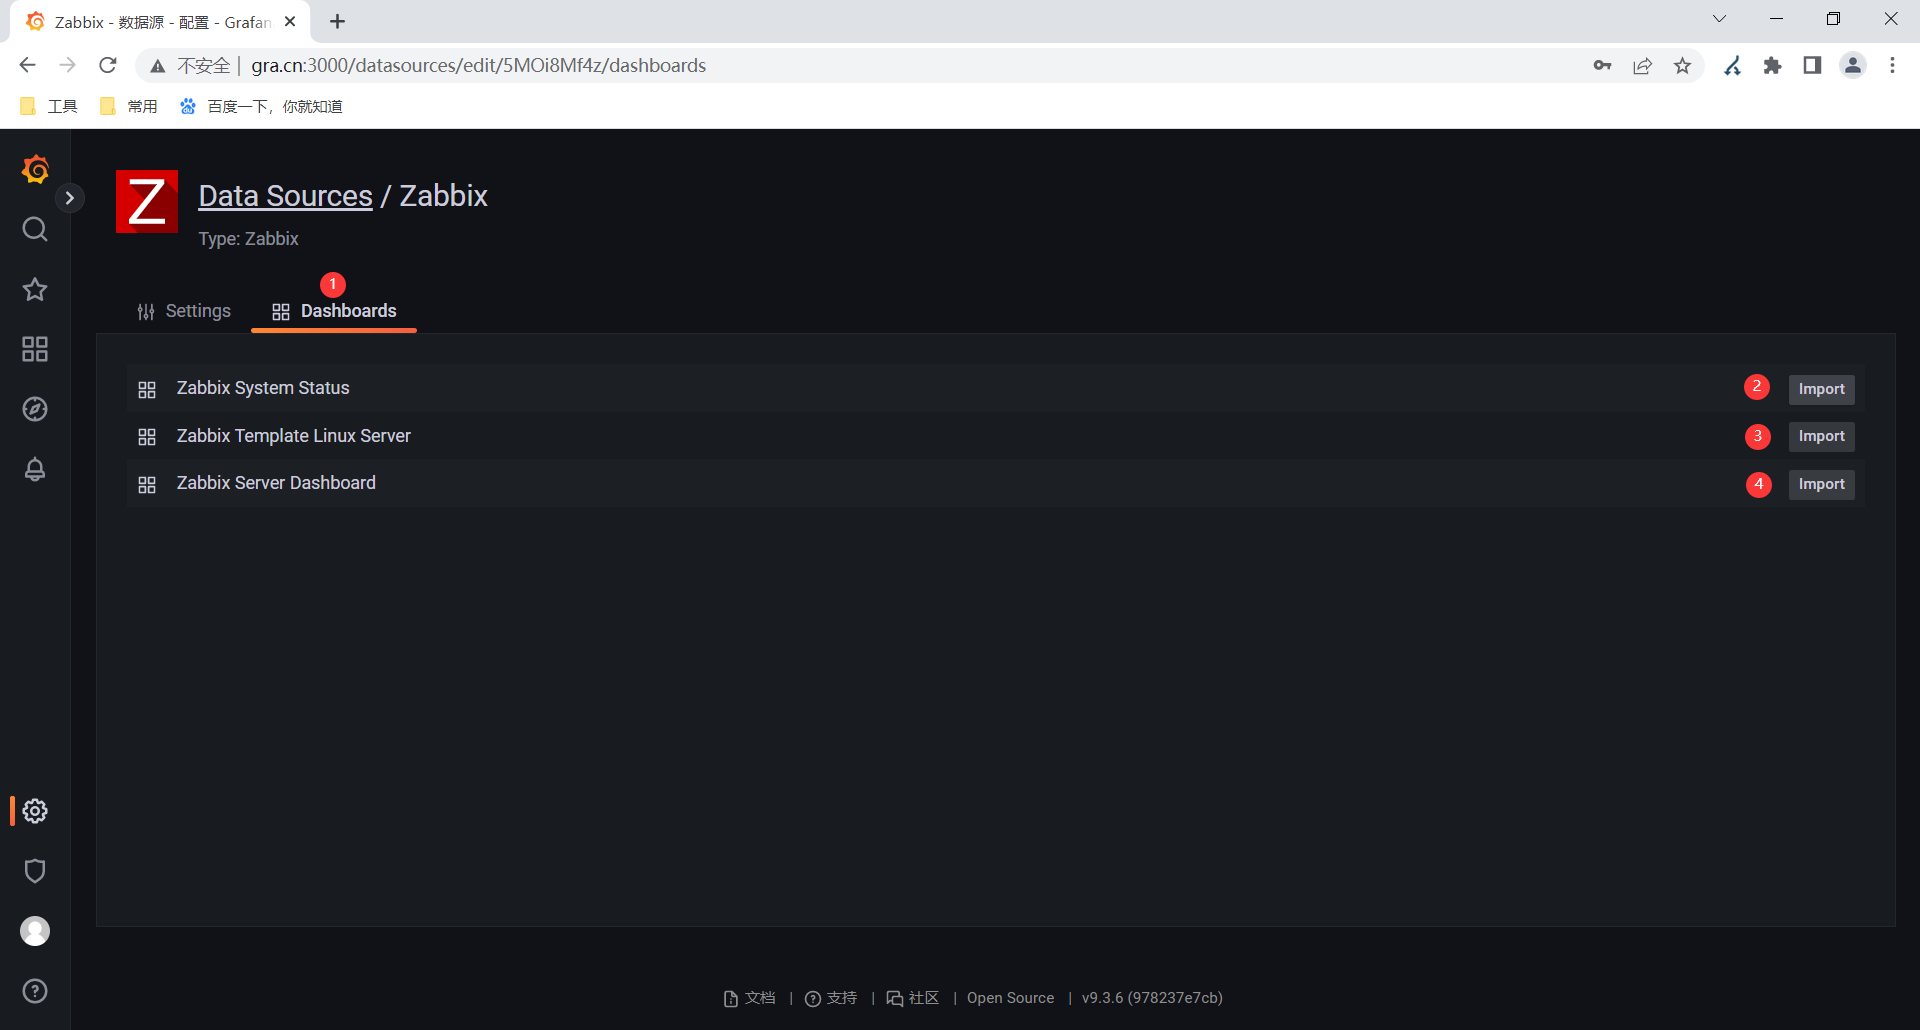
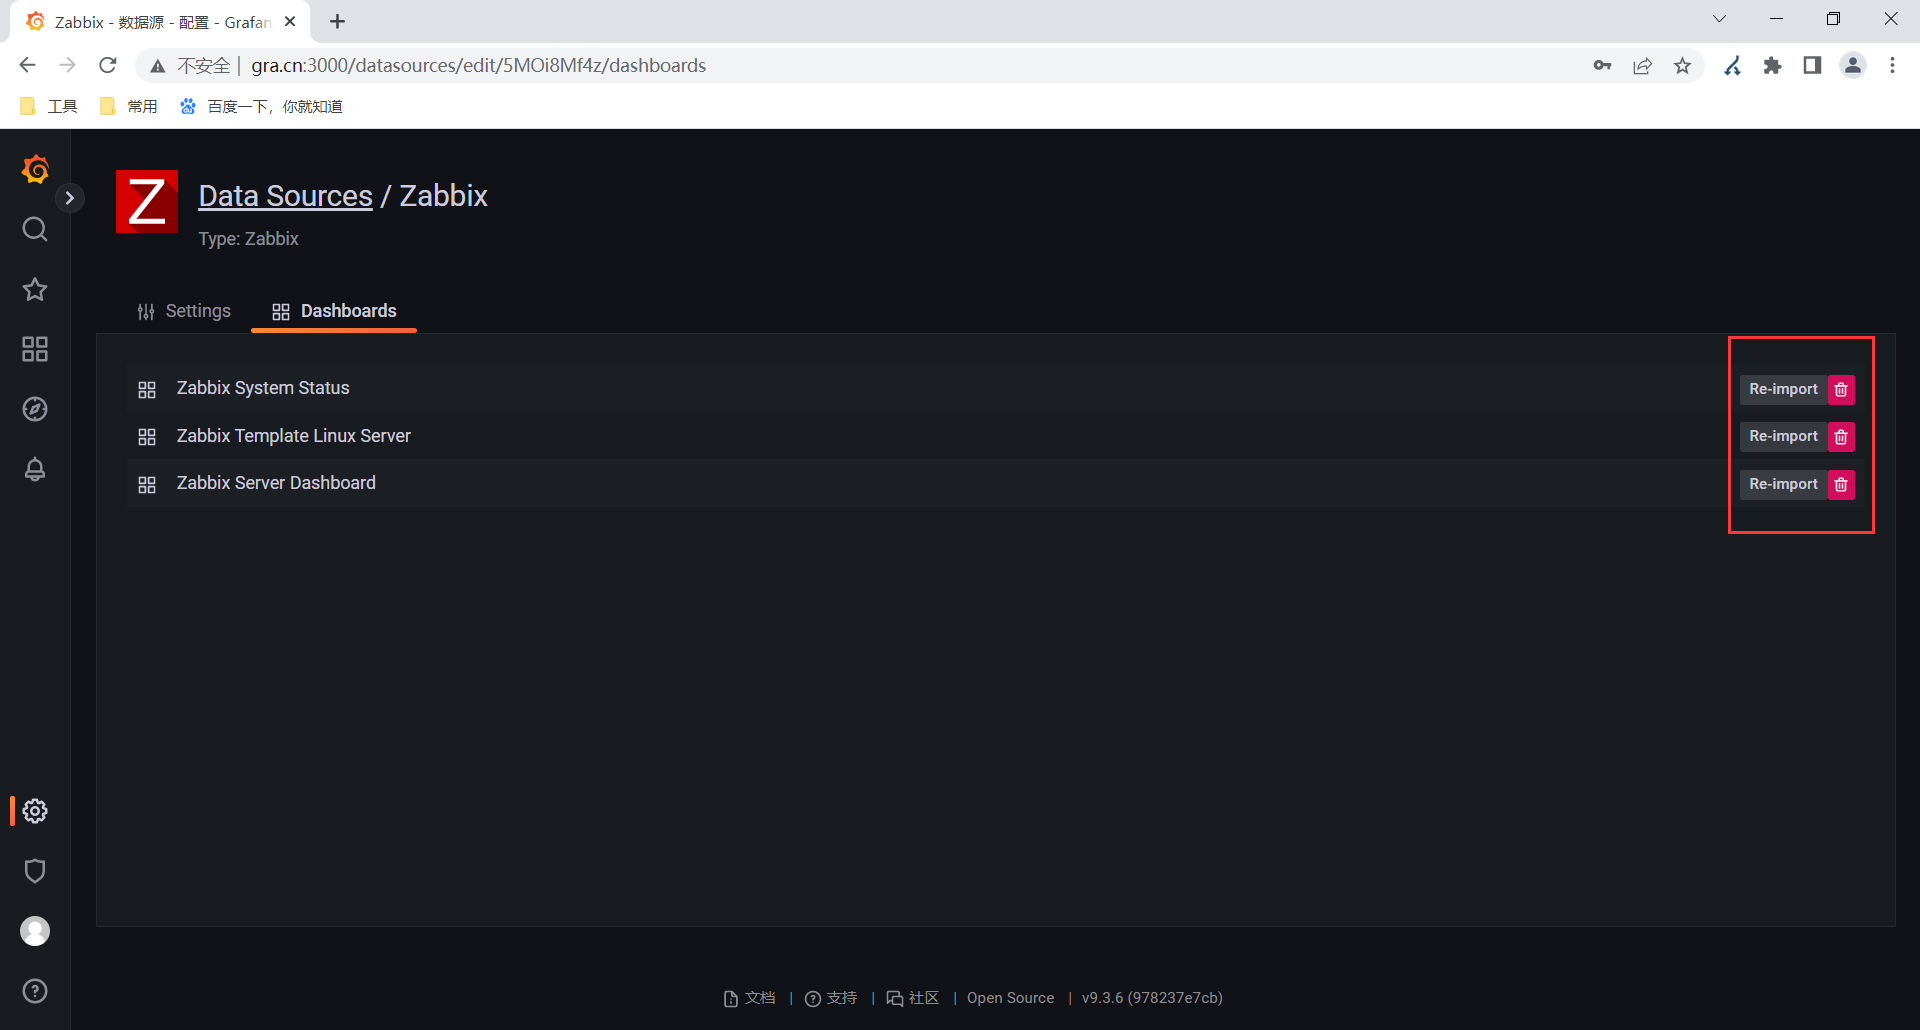
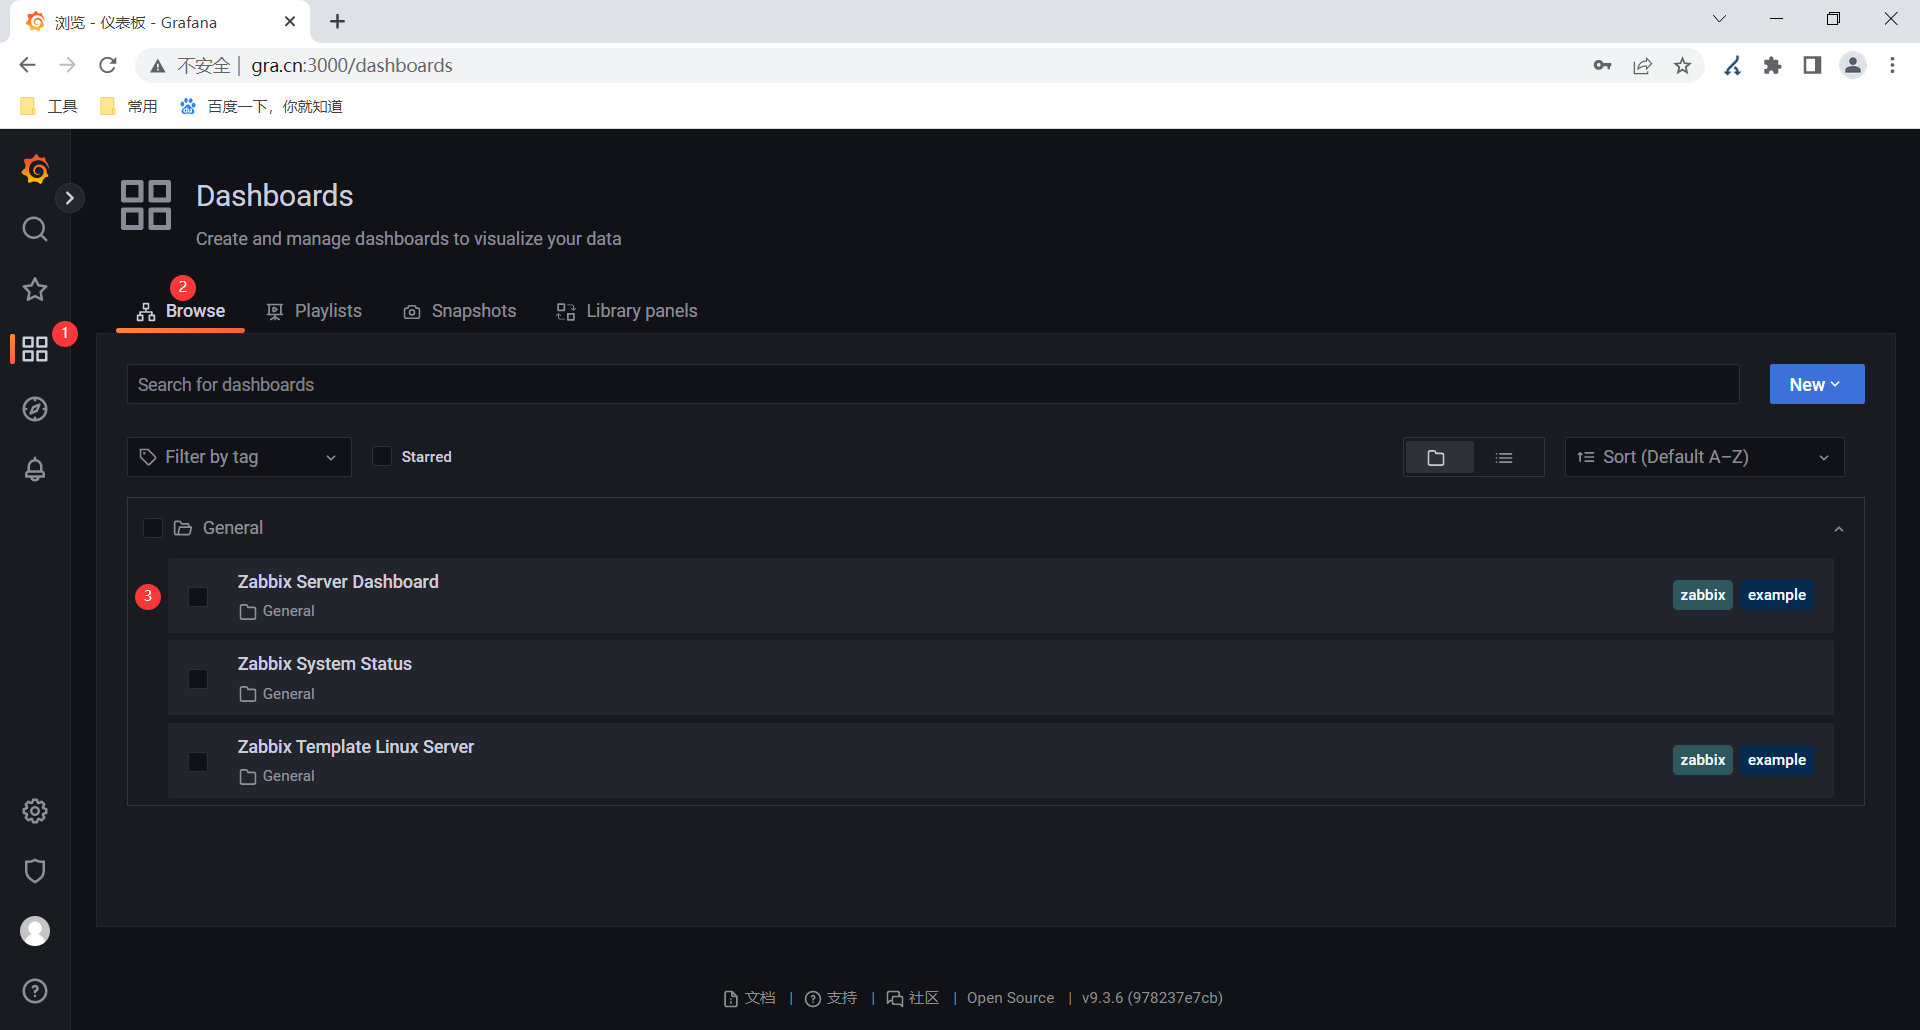
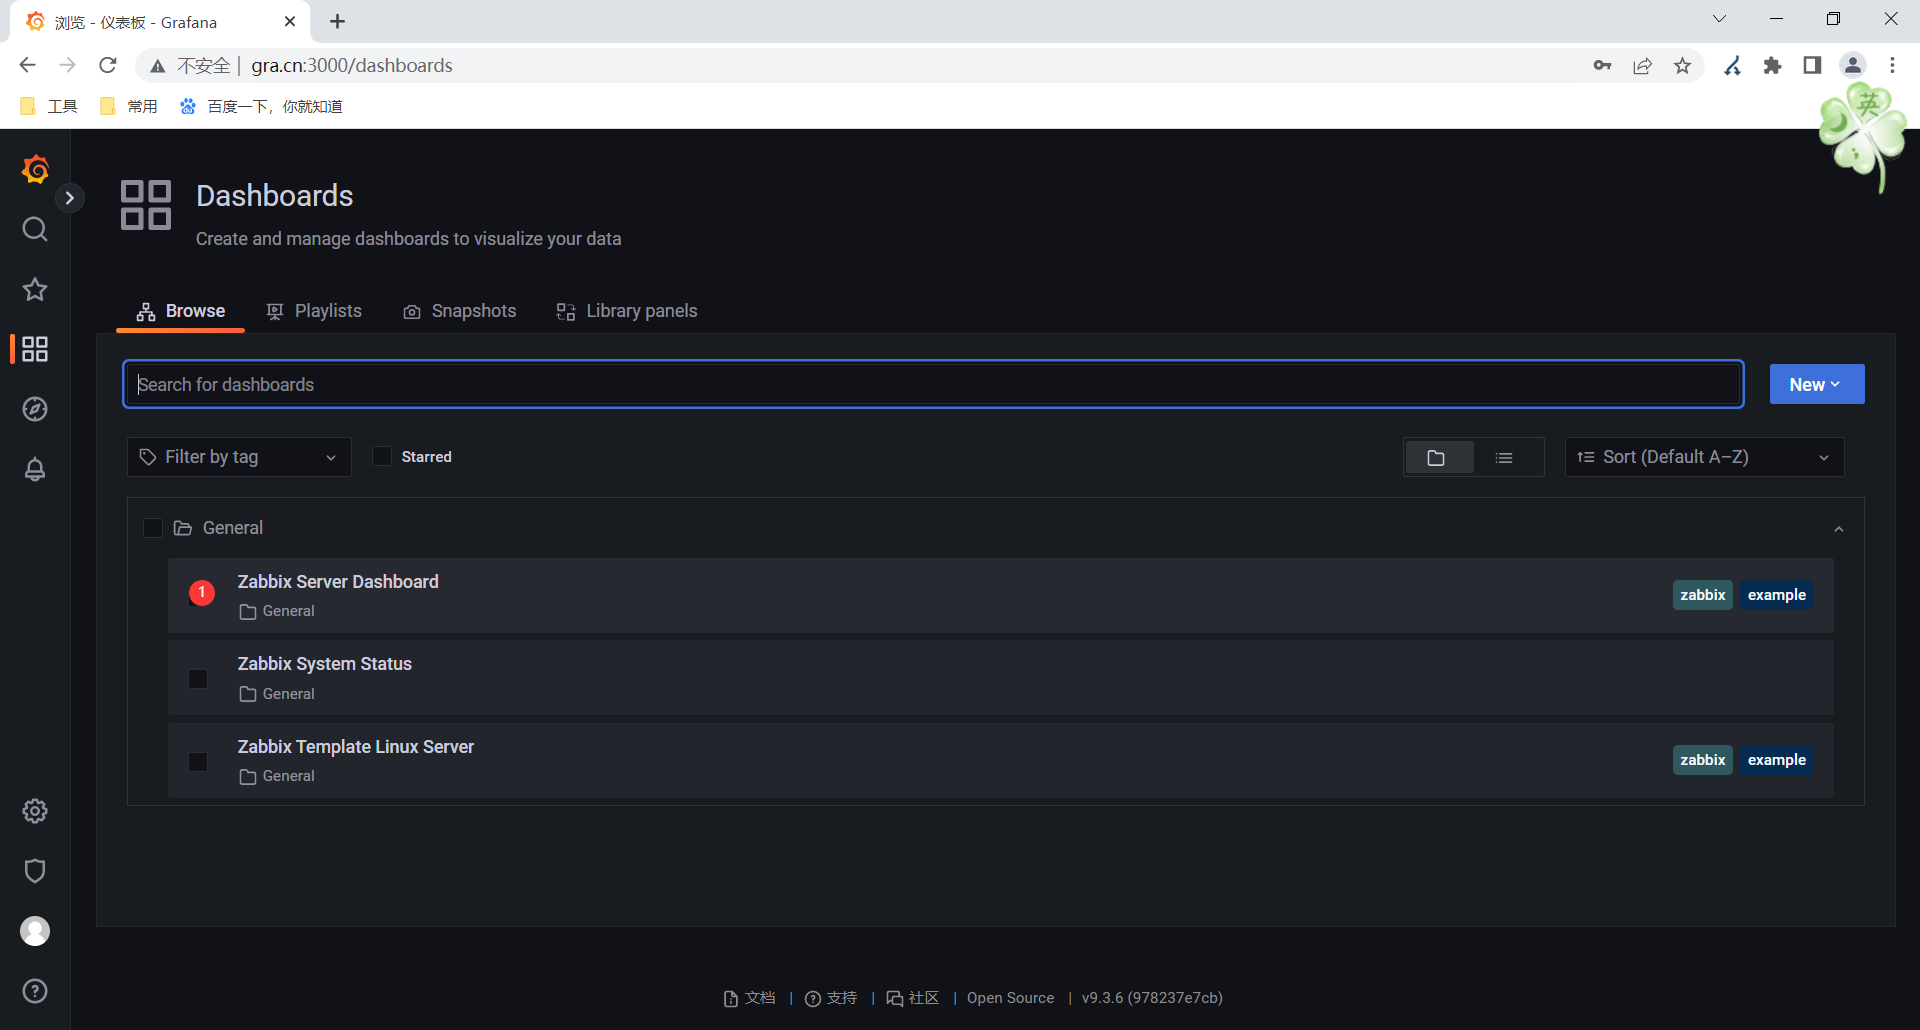
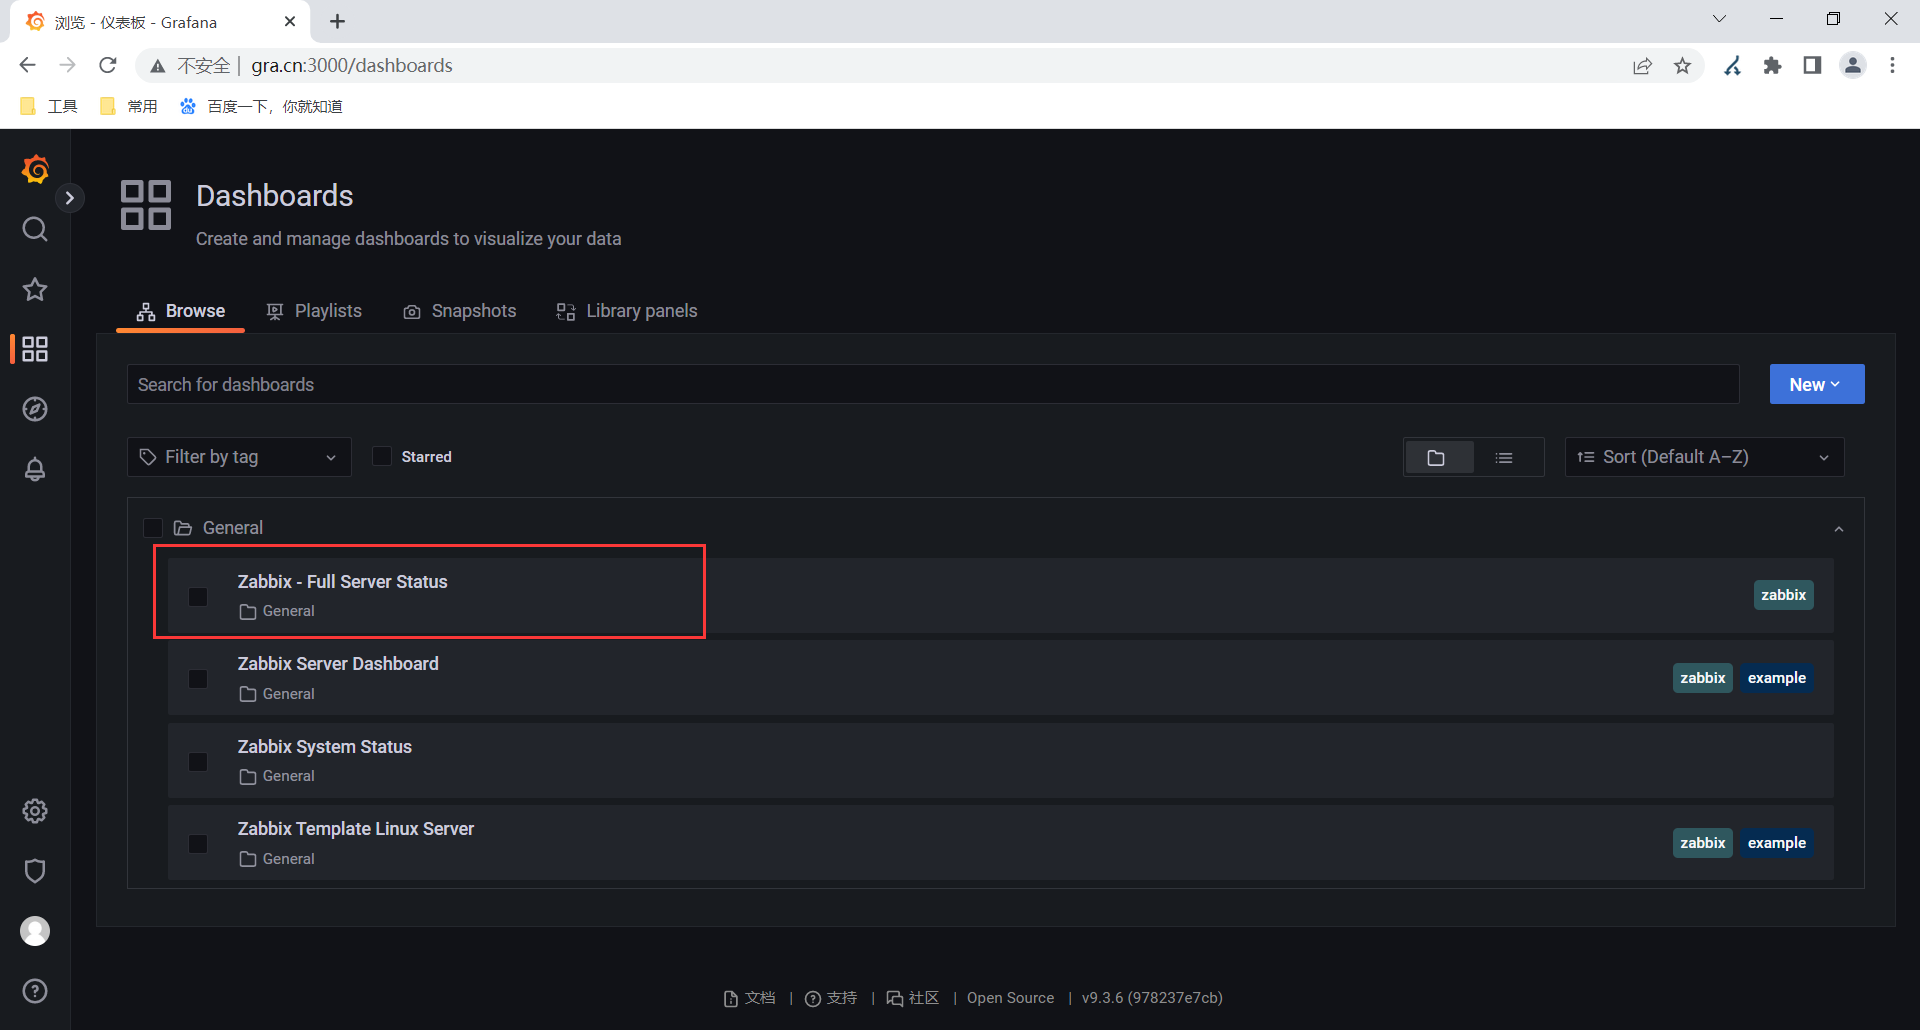
6.导入自带的几个仪表盘
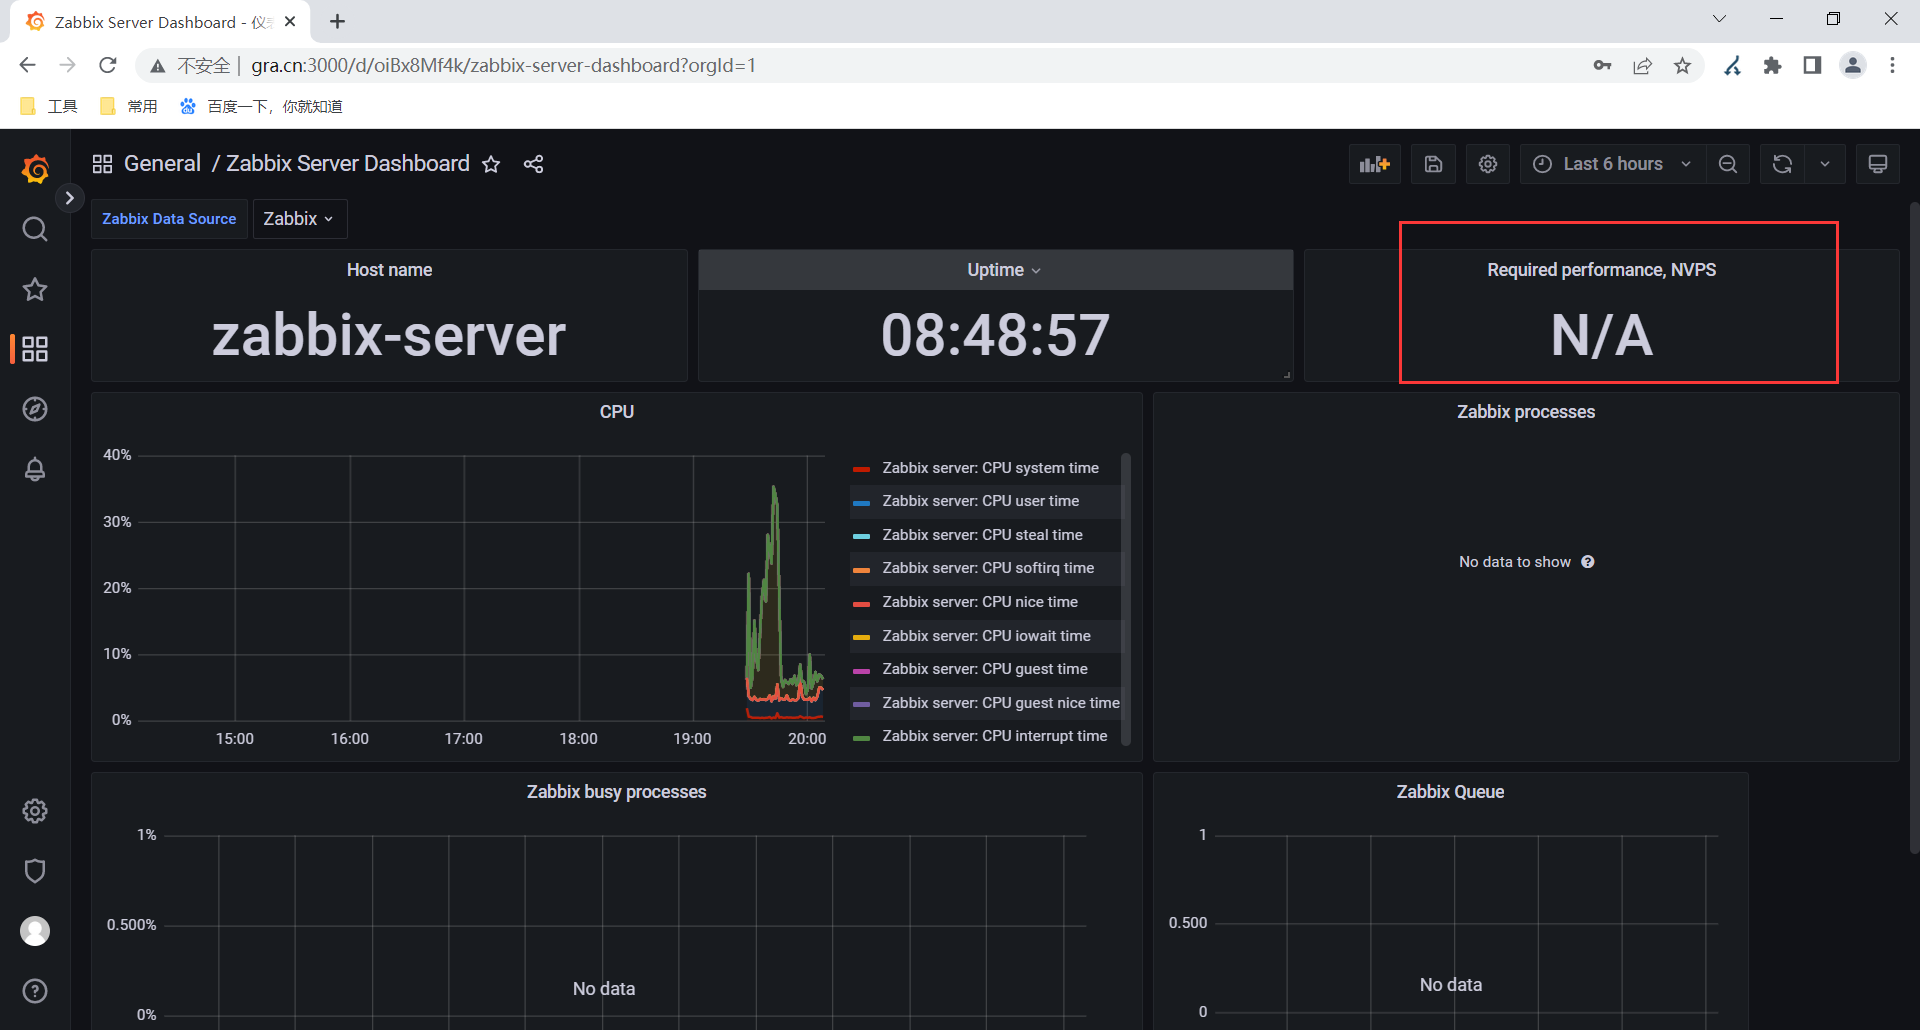
三、Grafana web页面添加与配置图形 dashboard
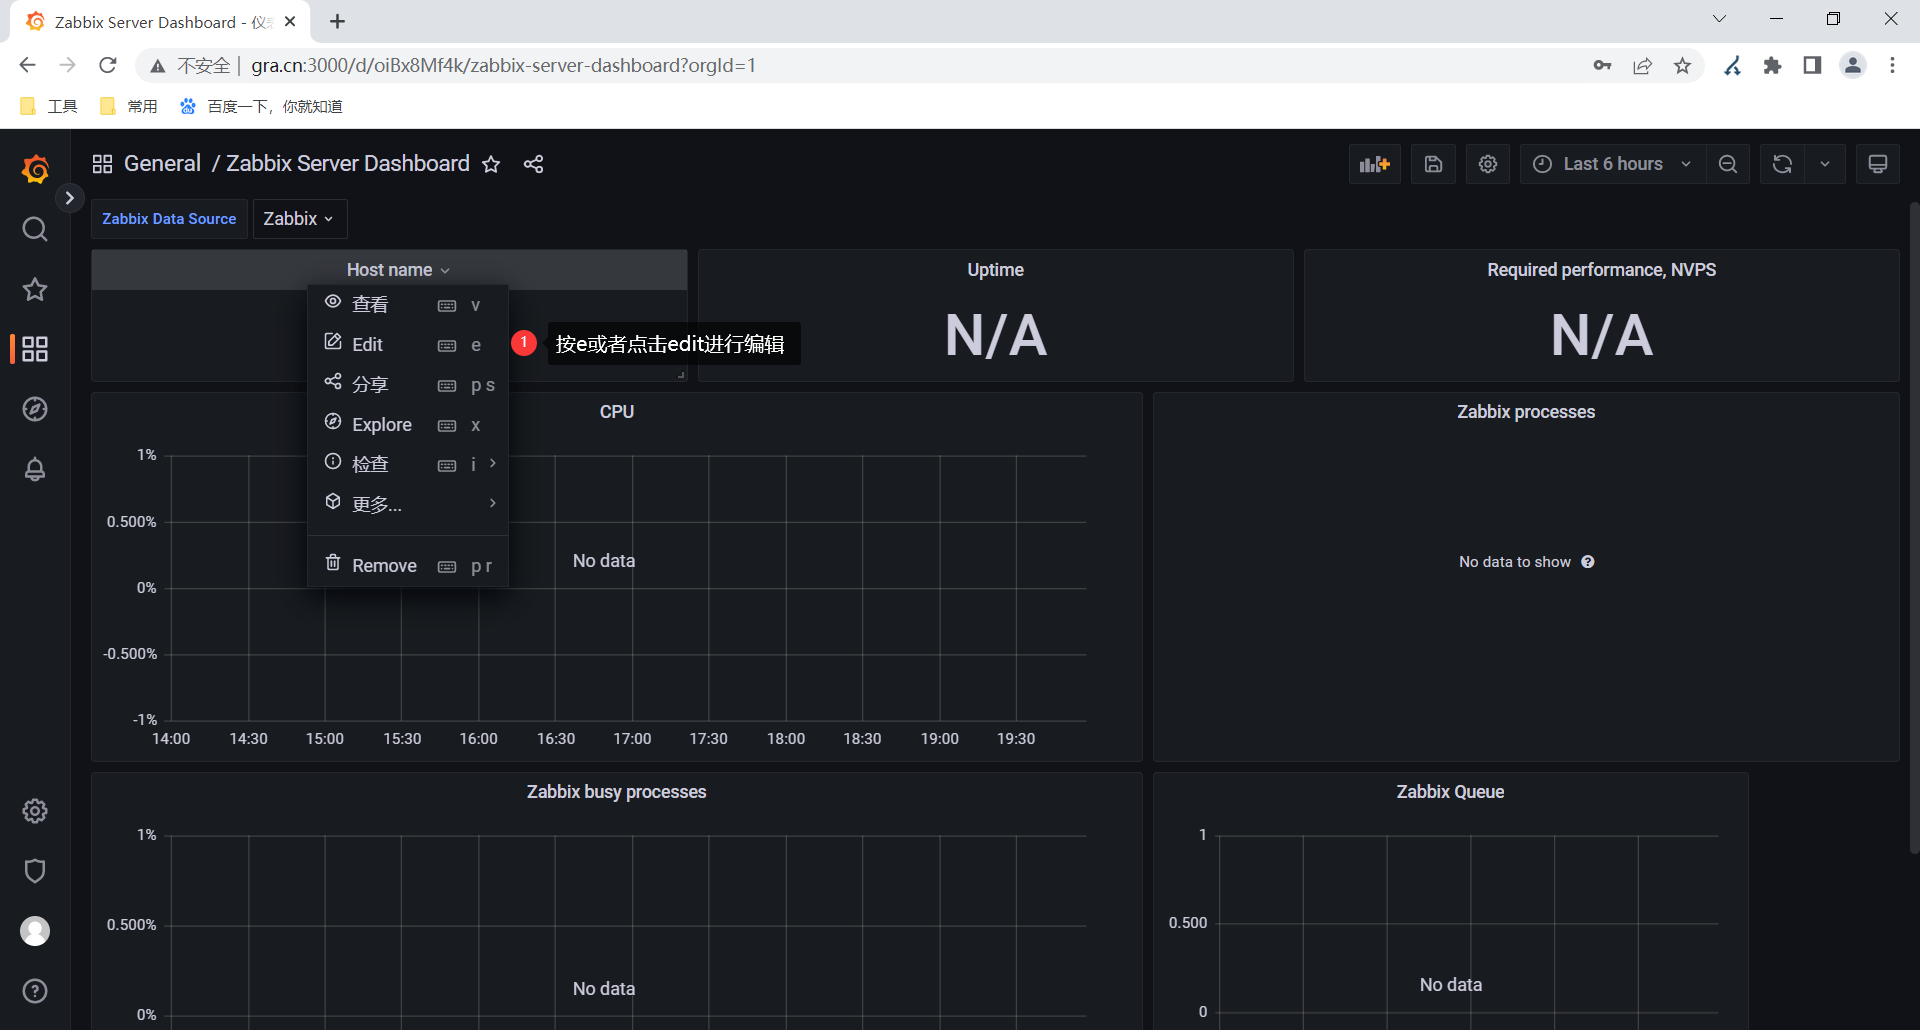
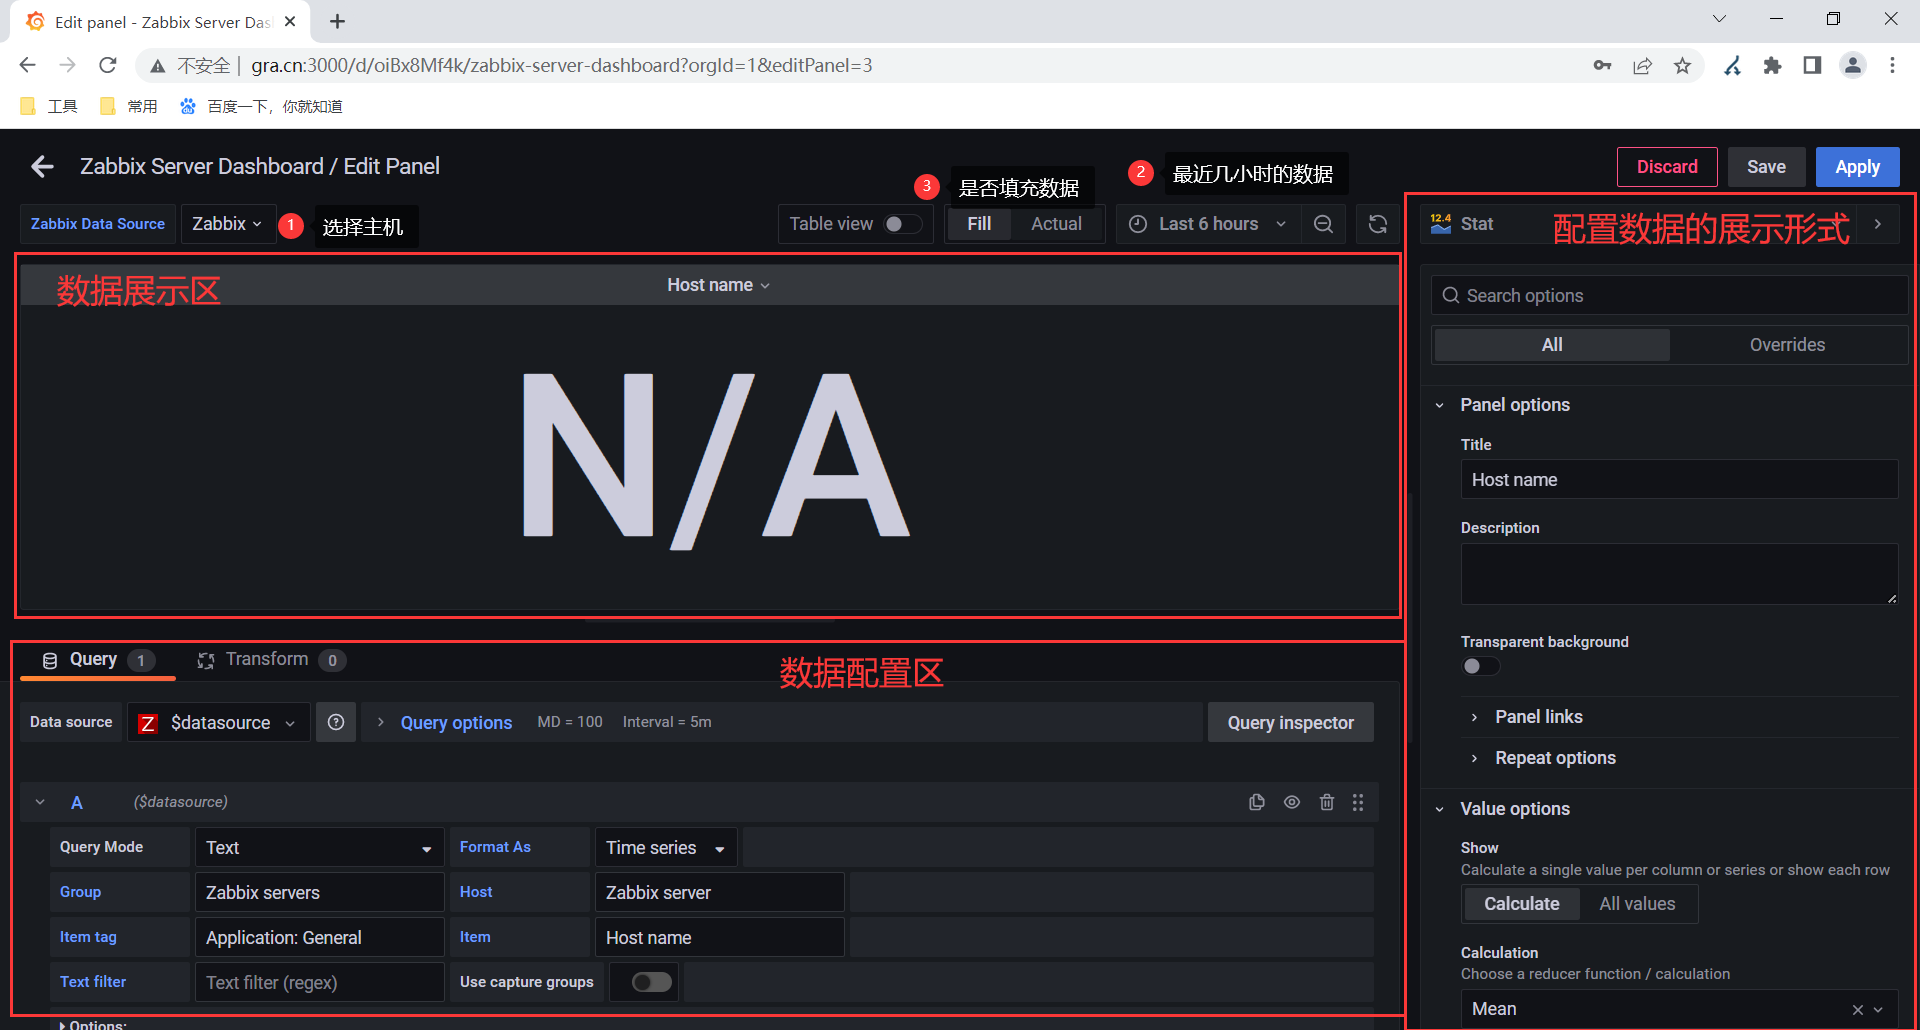
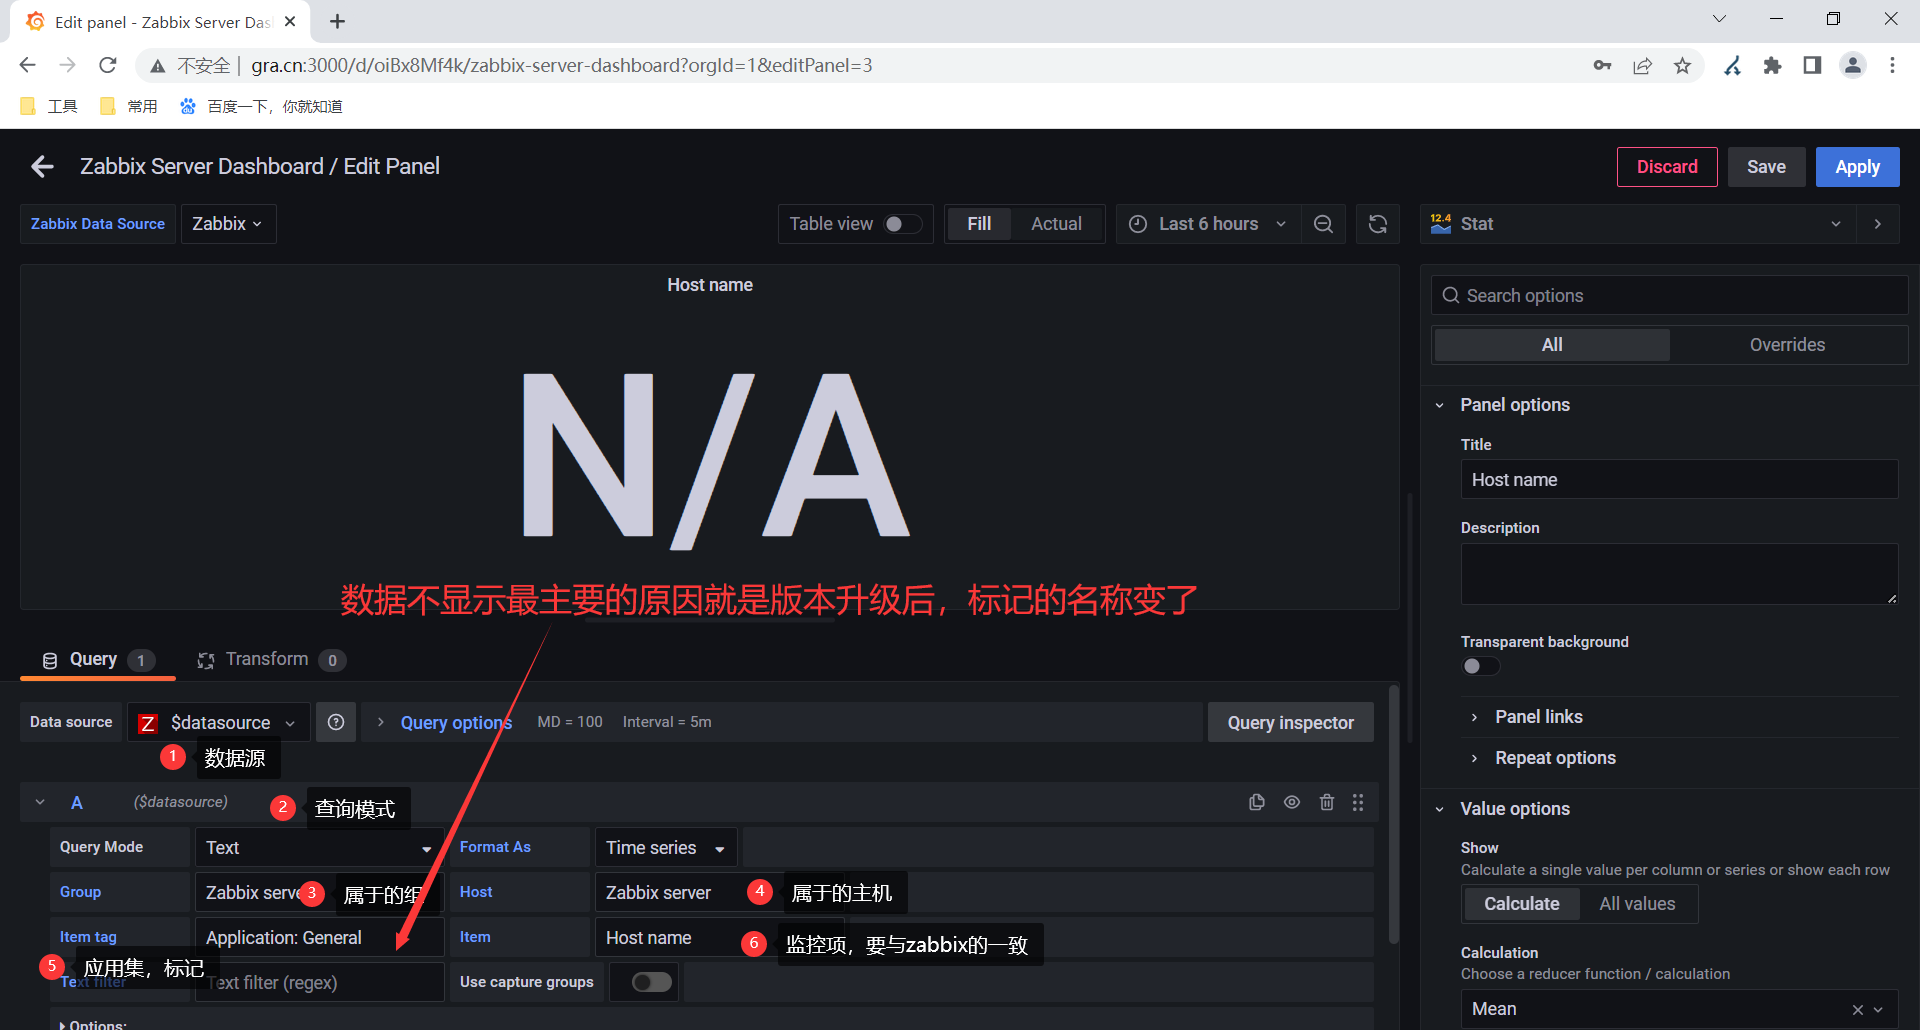
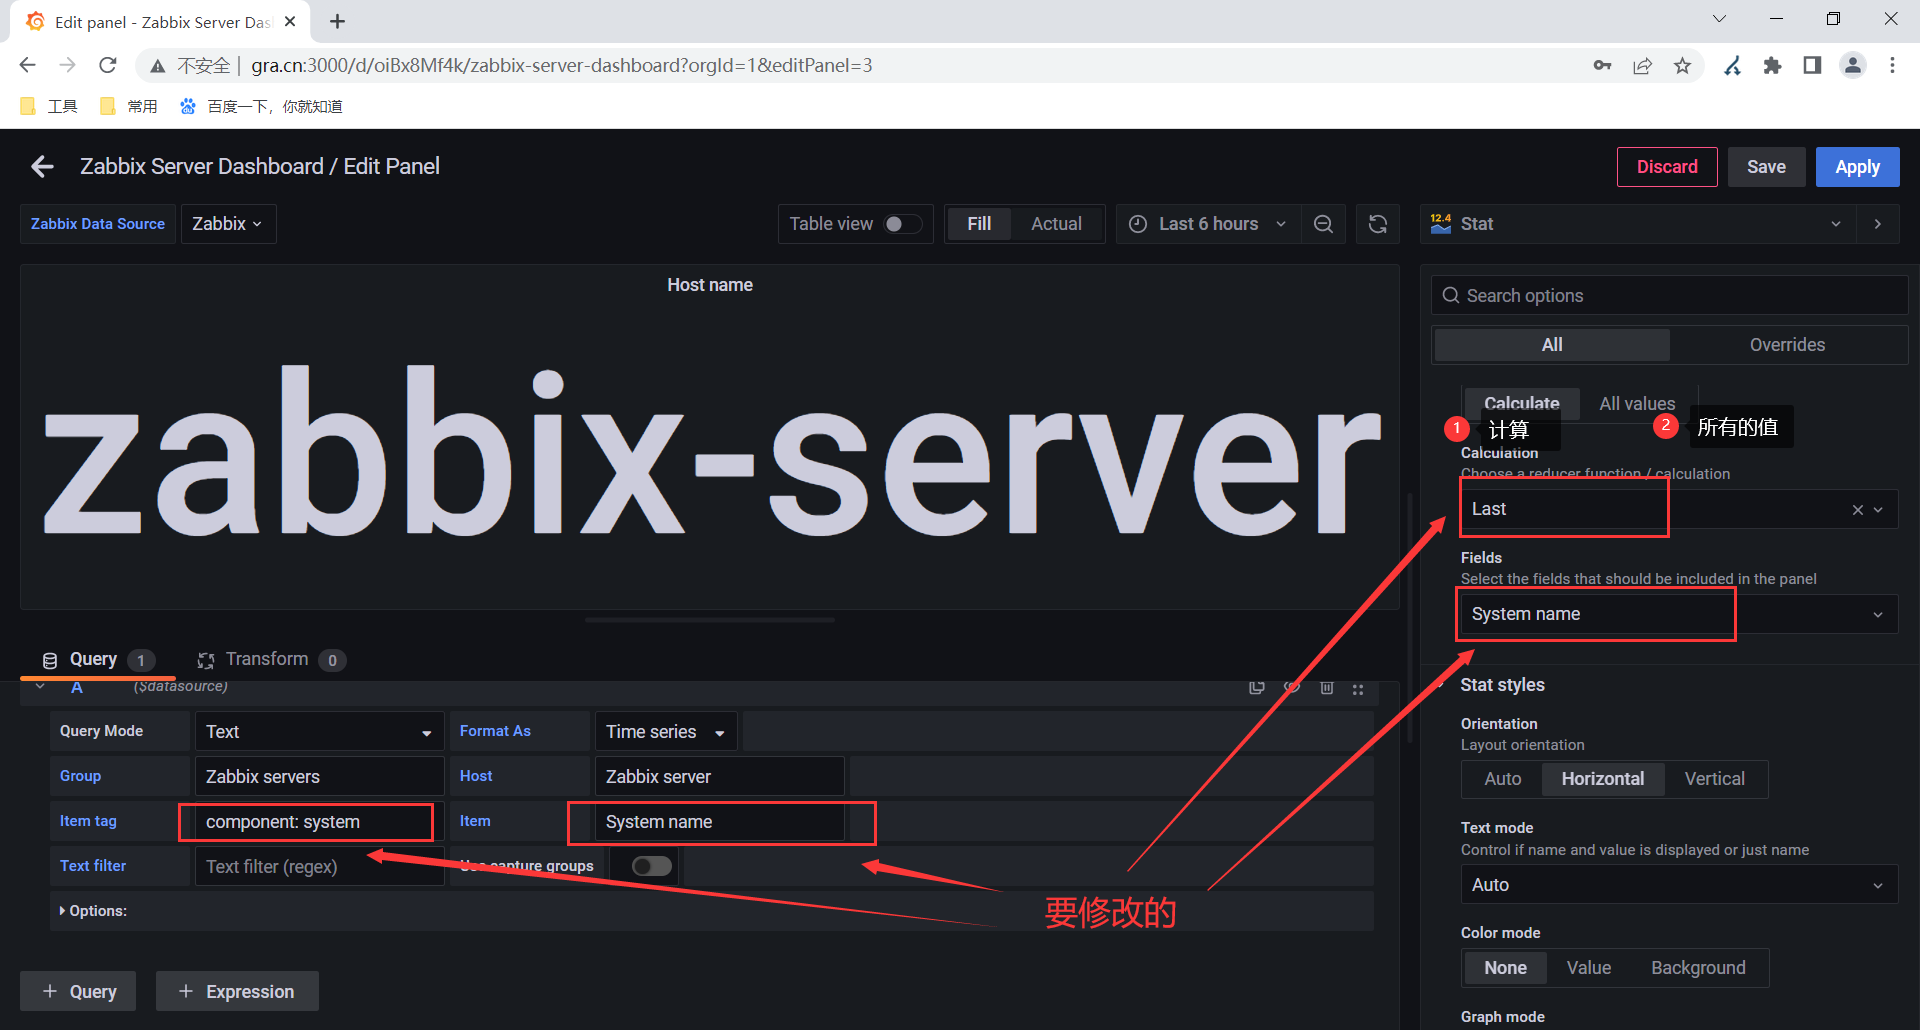
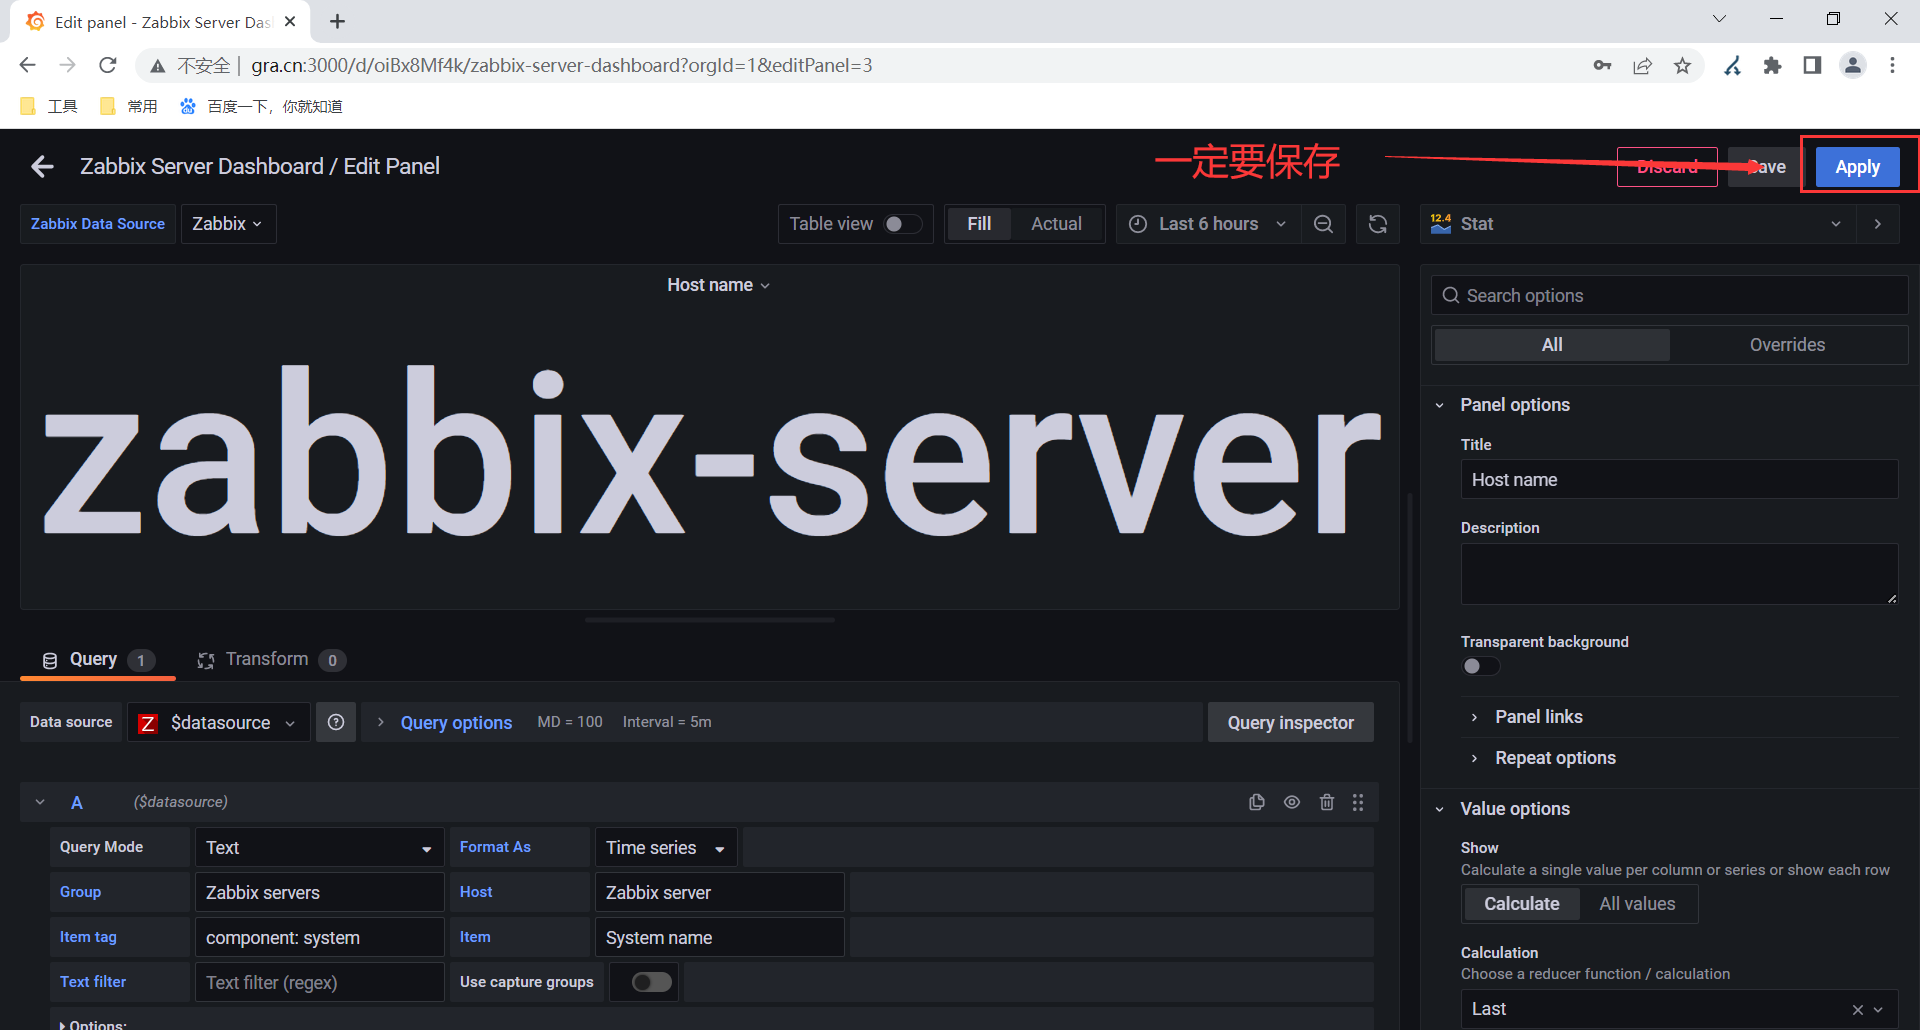
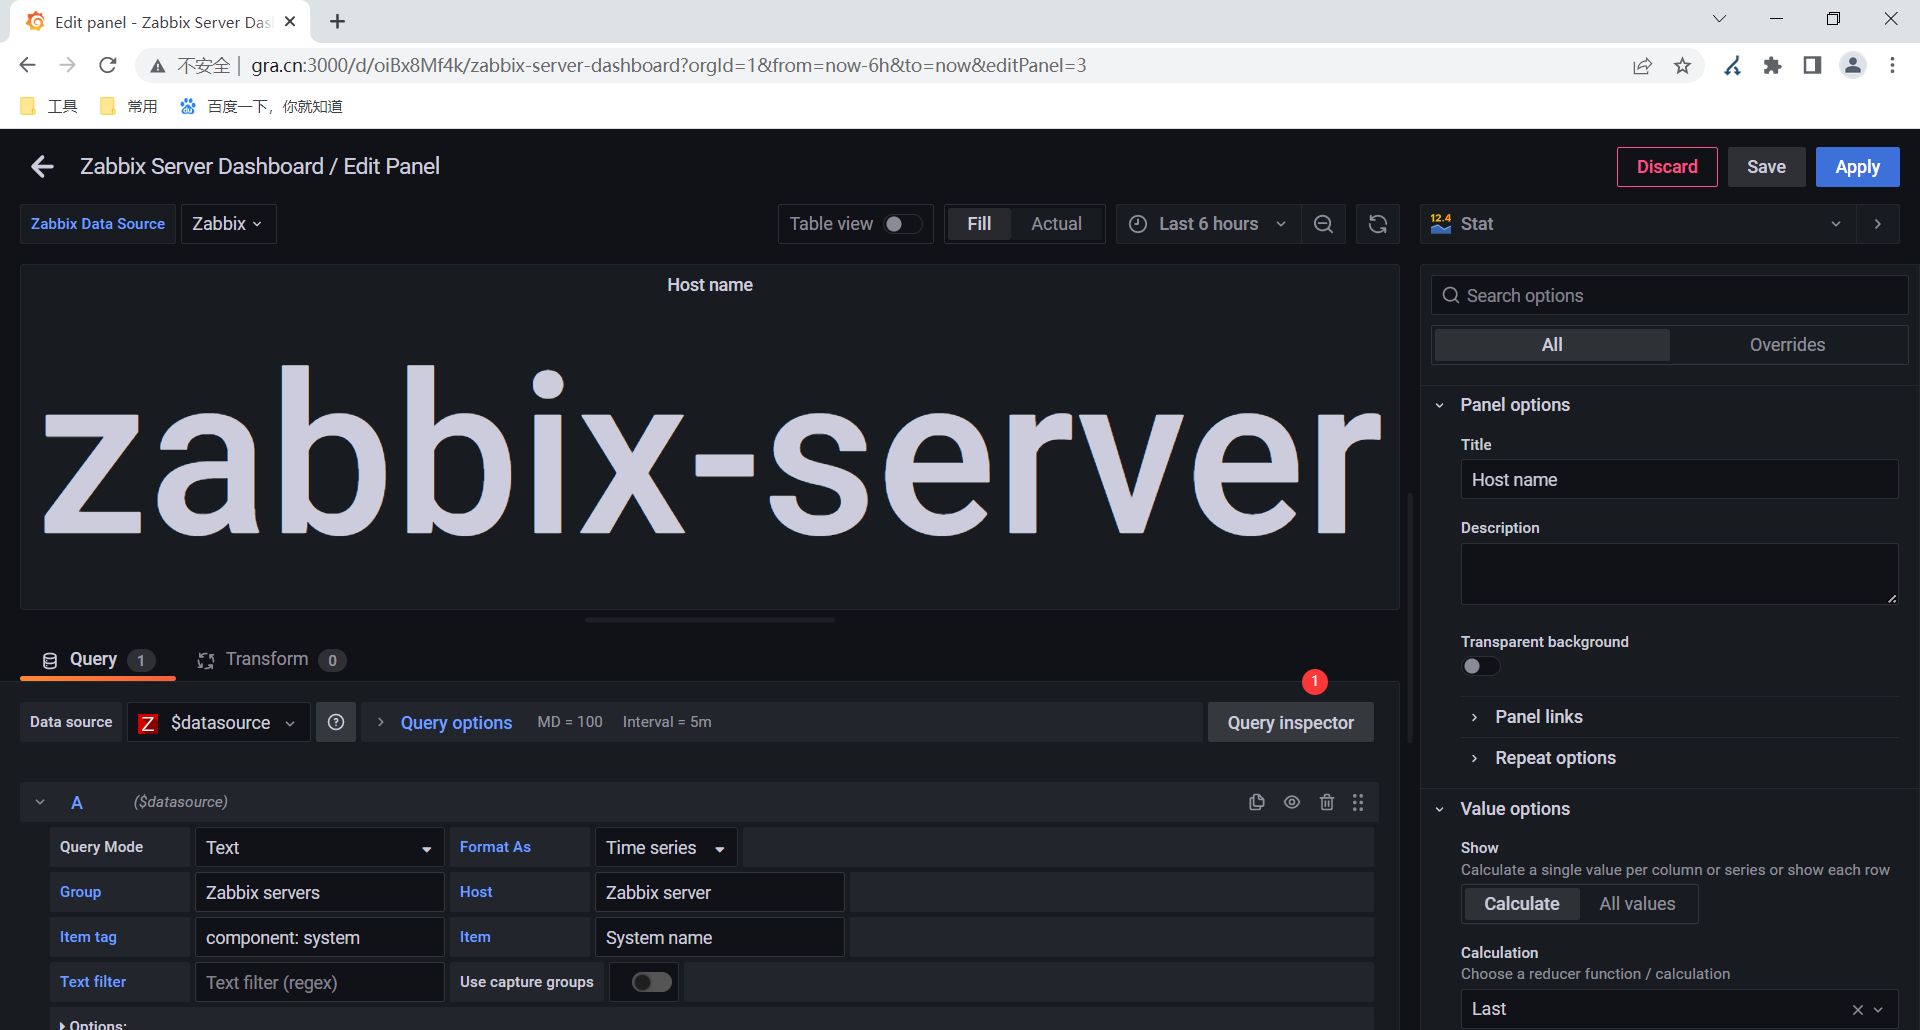
1.修改主机名
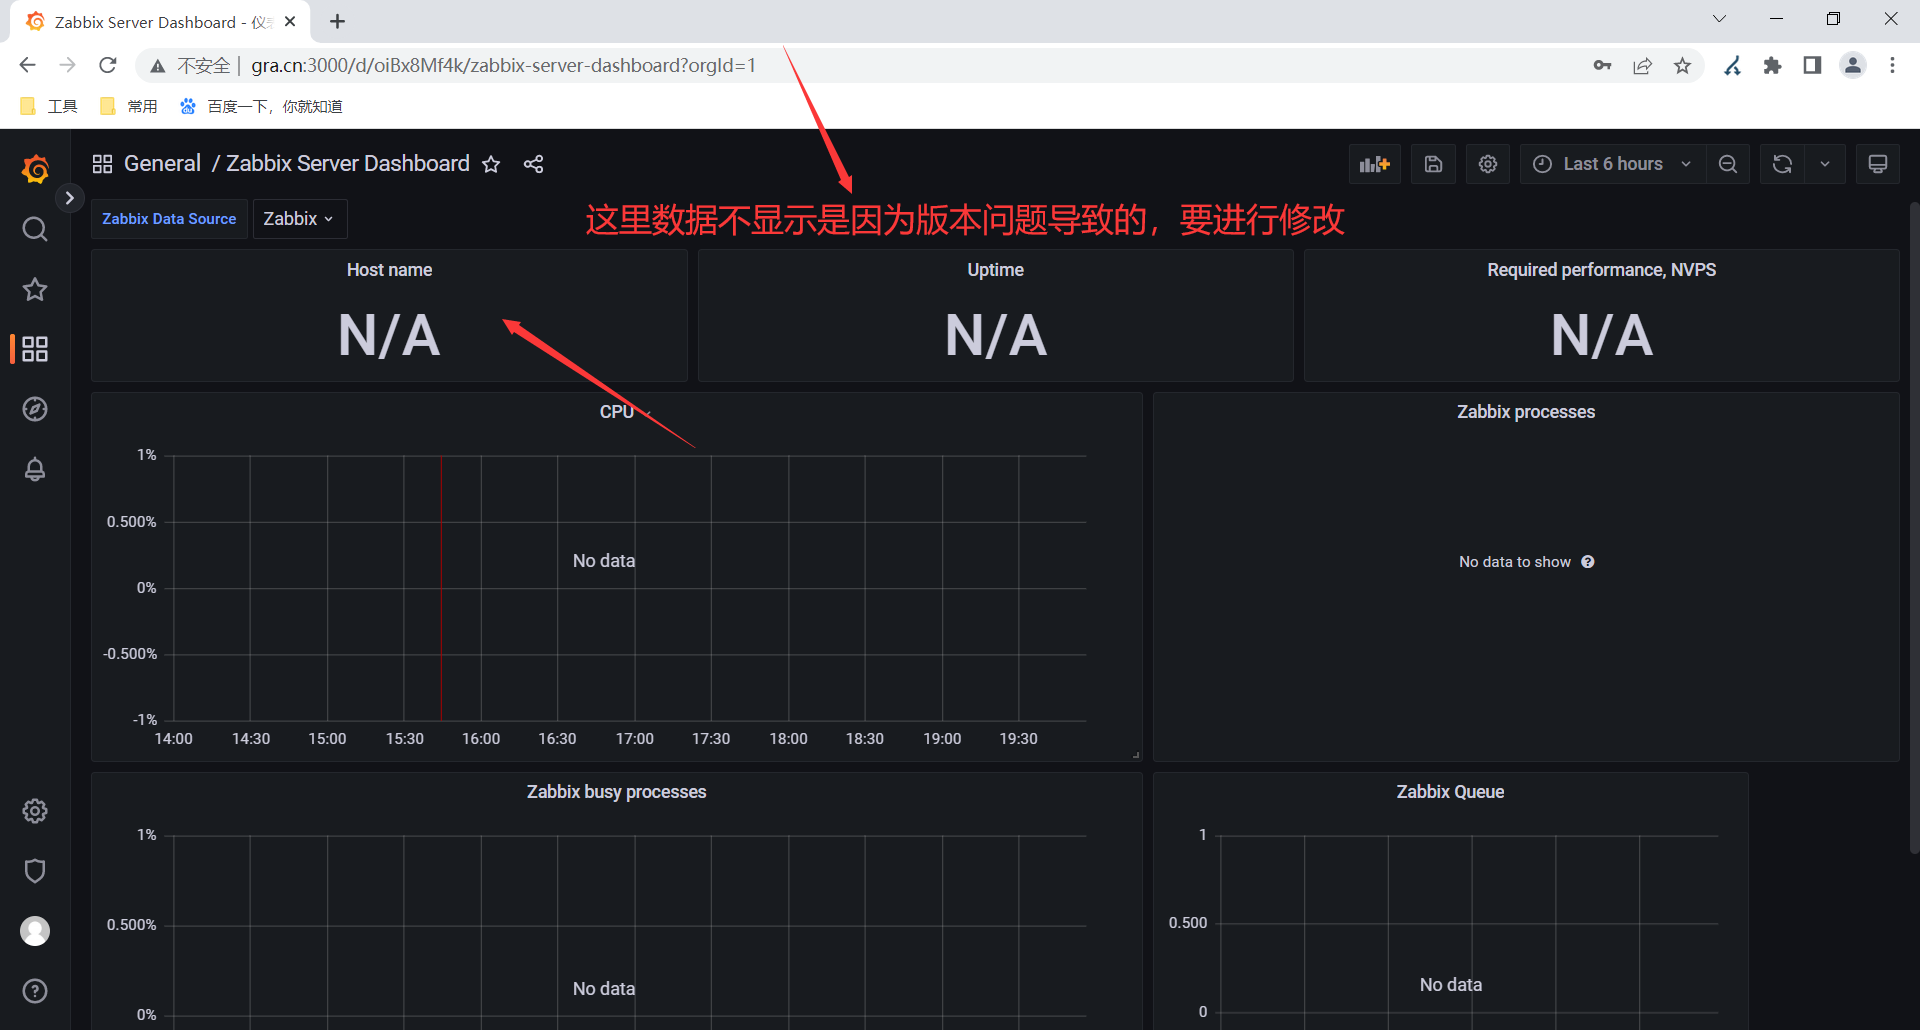
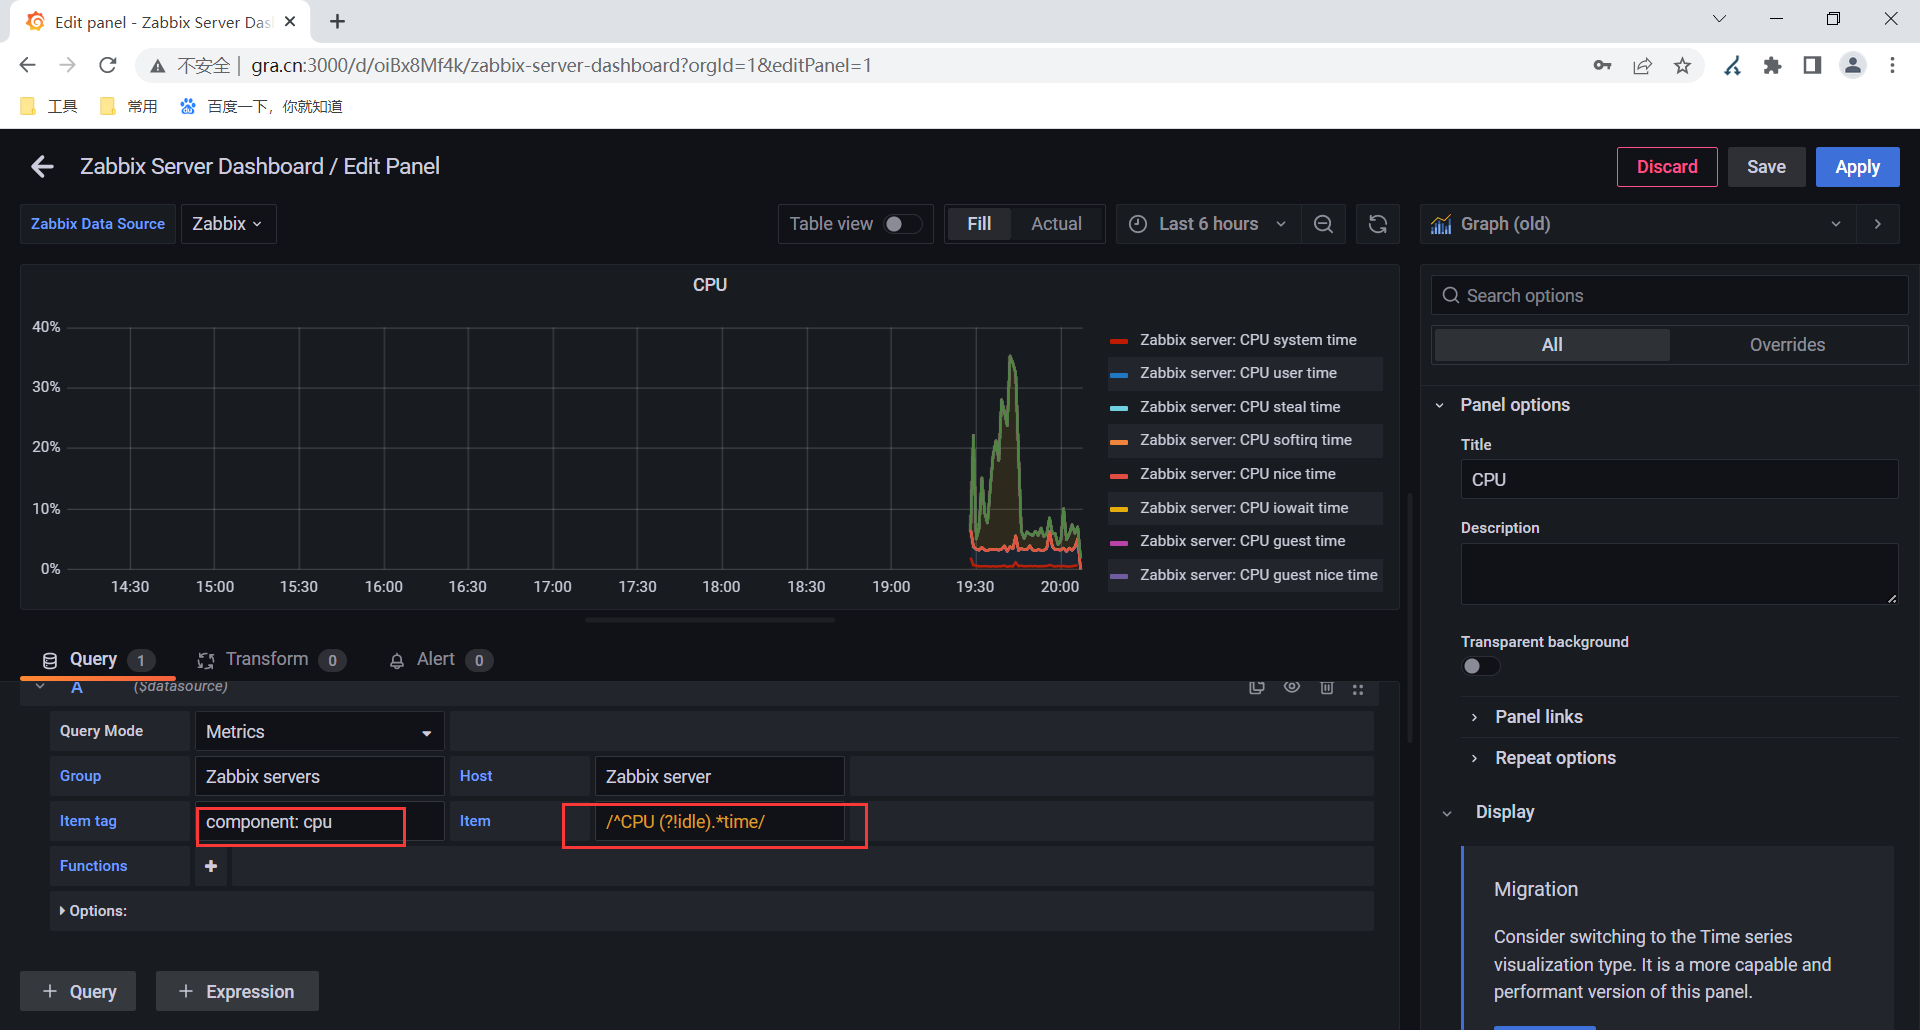
2.修改显示cpu使用率
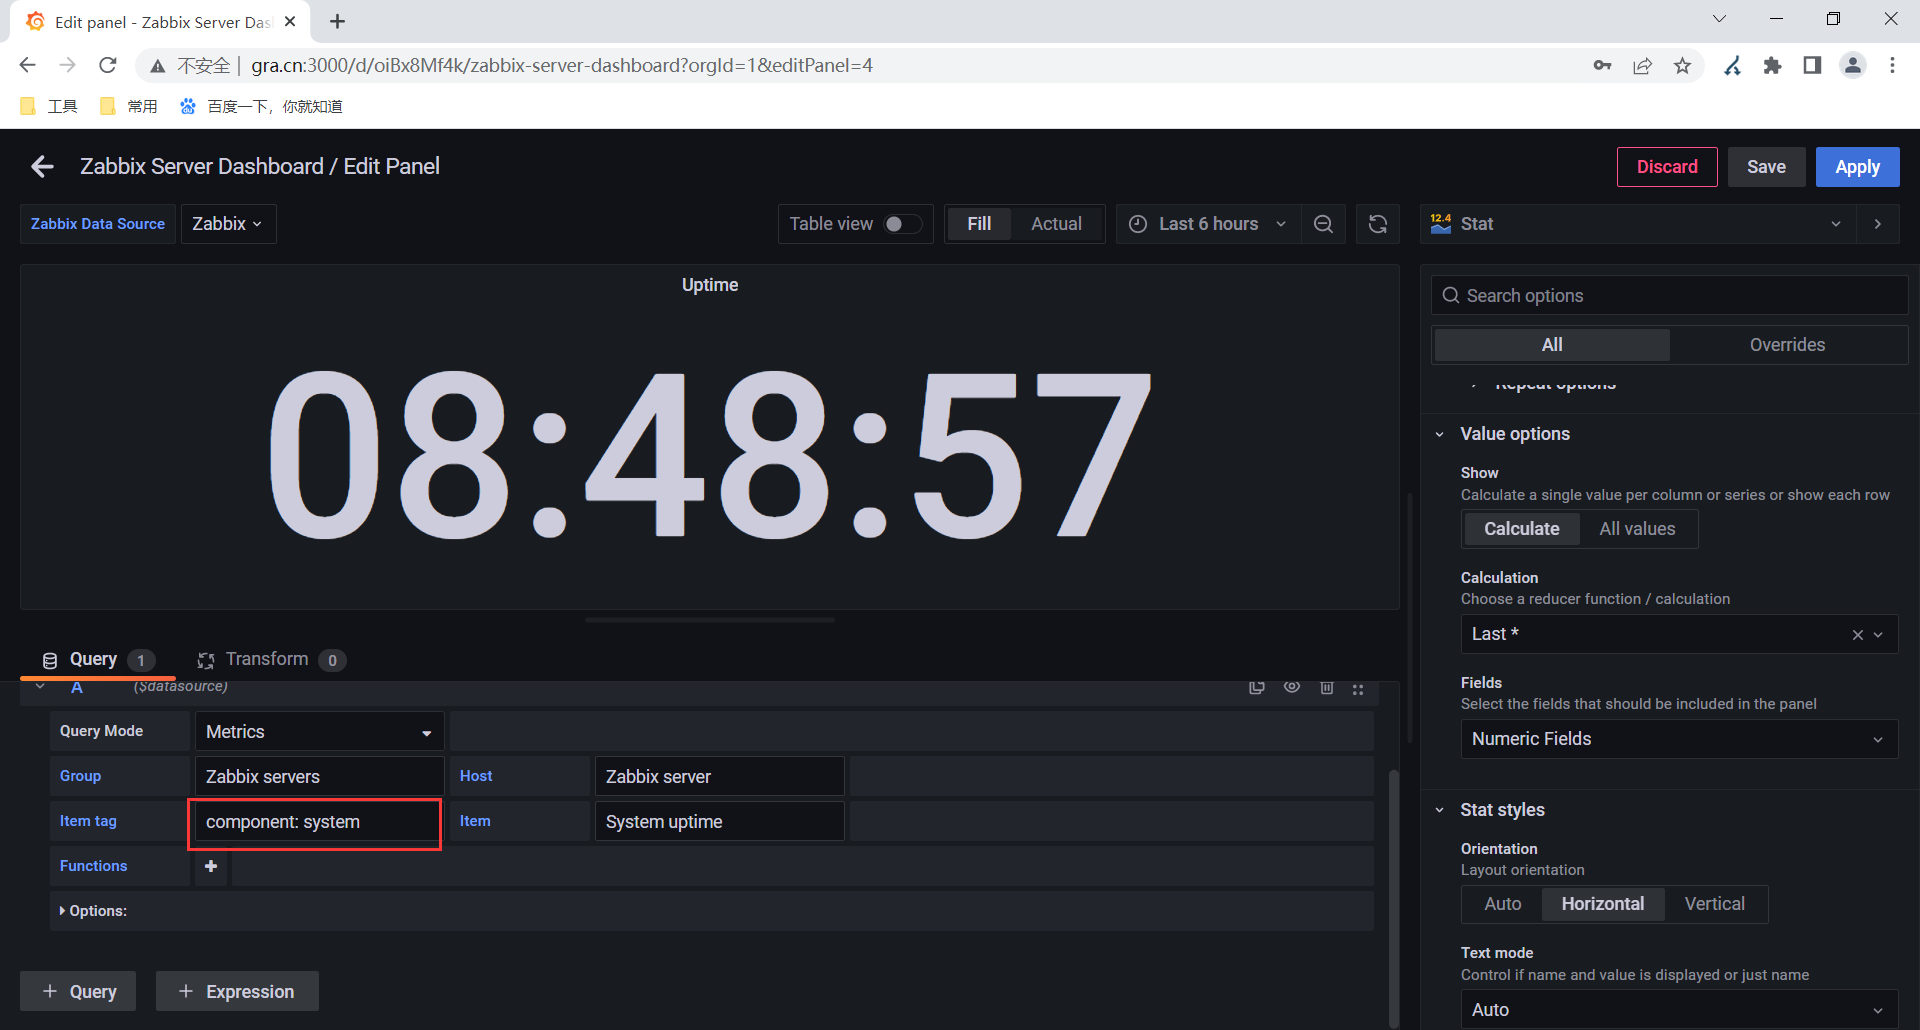
3.修改显示uptime
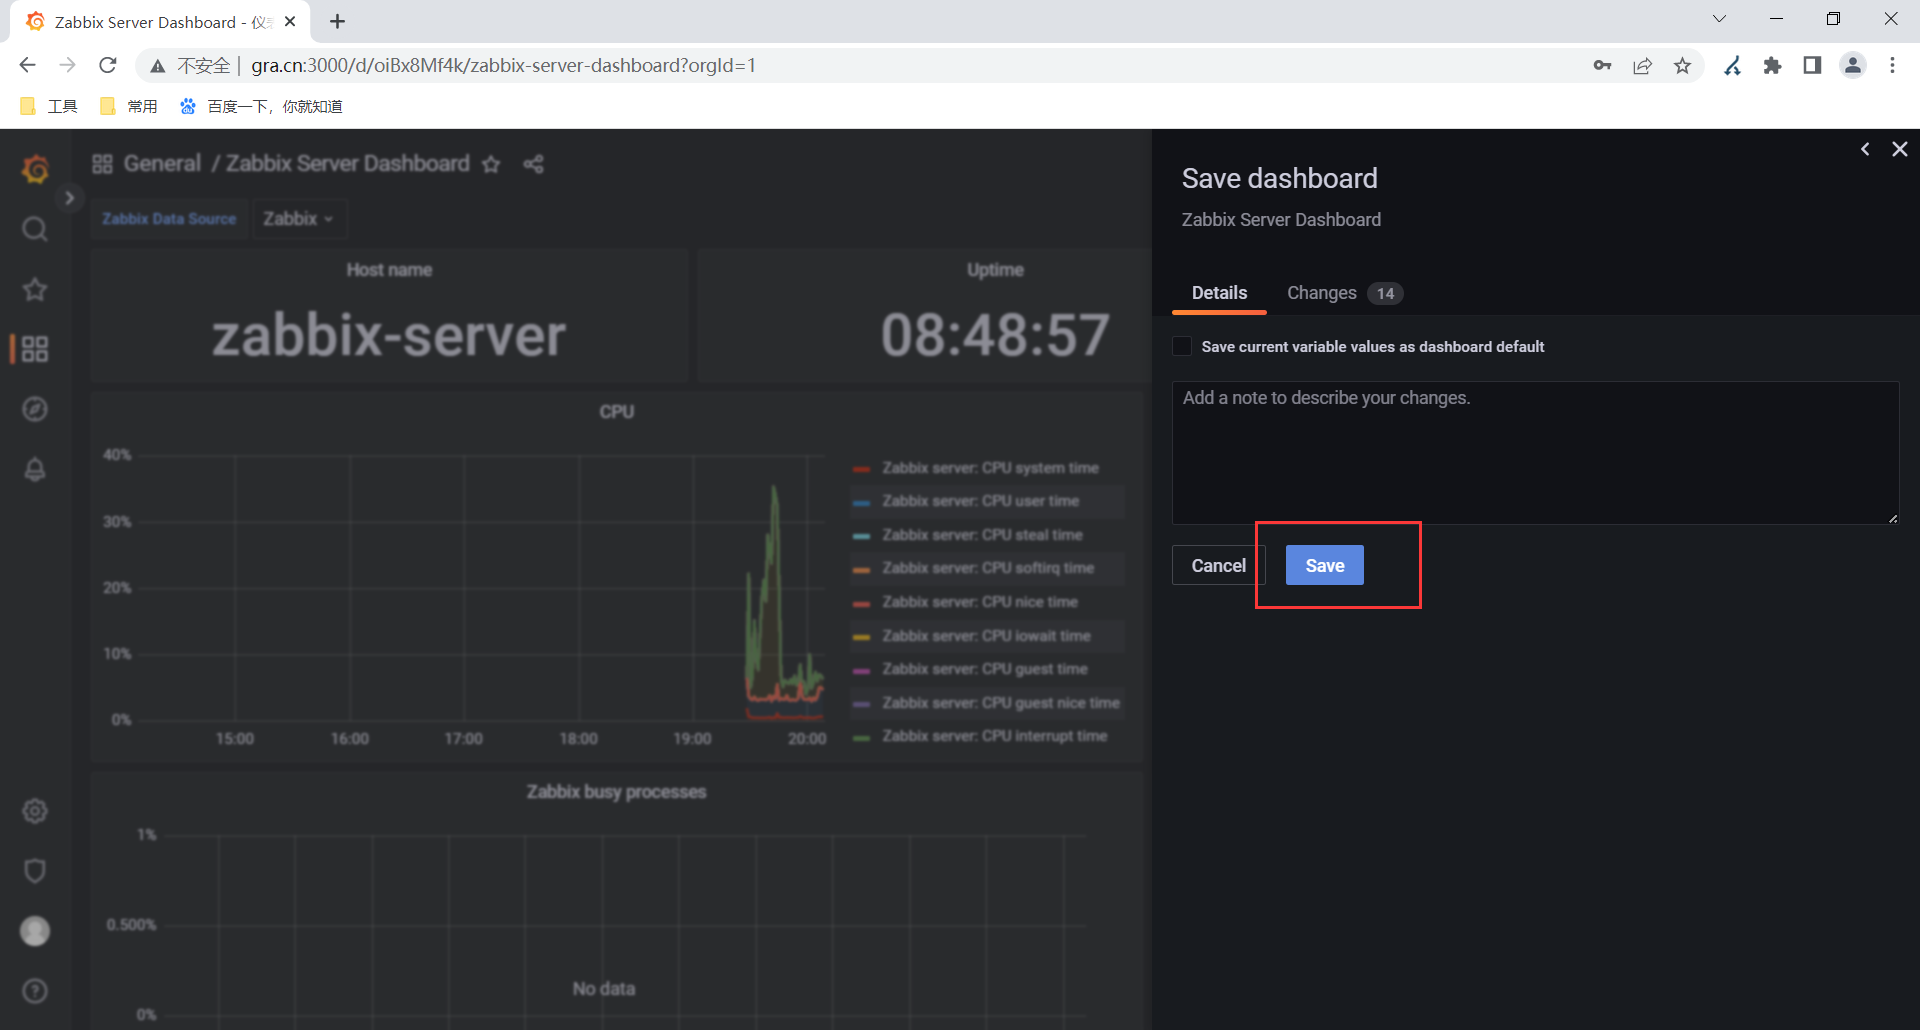
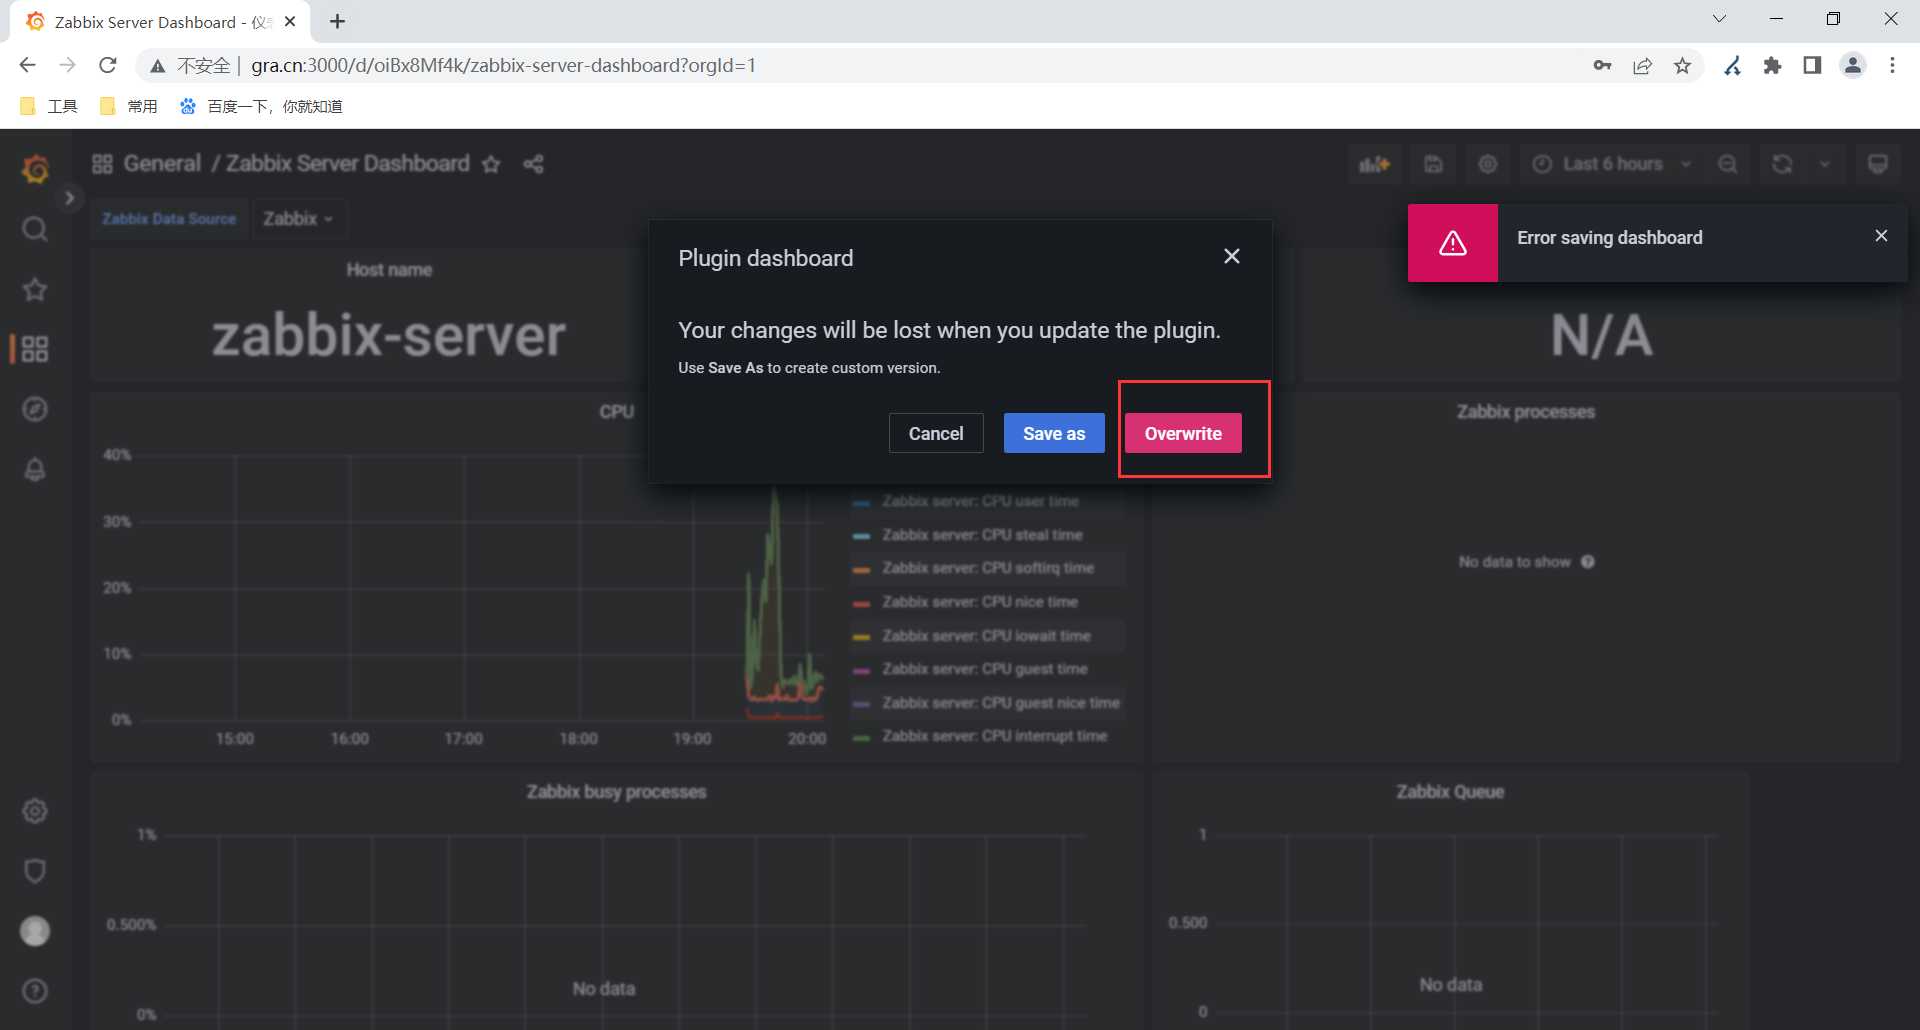
4.保存修改后的面板
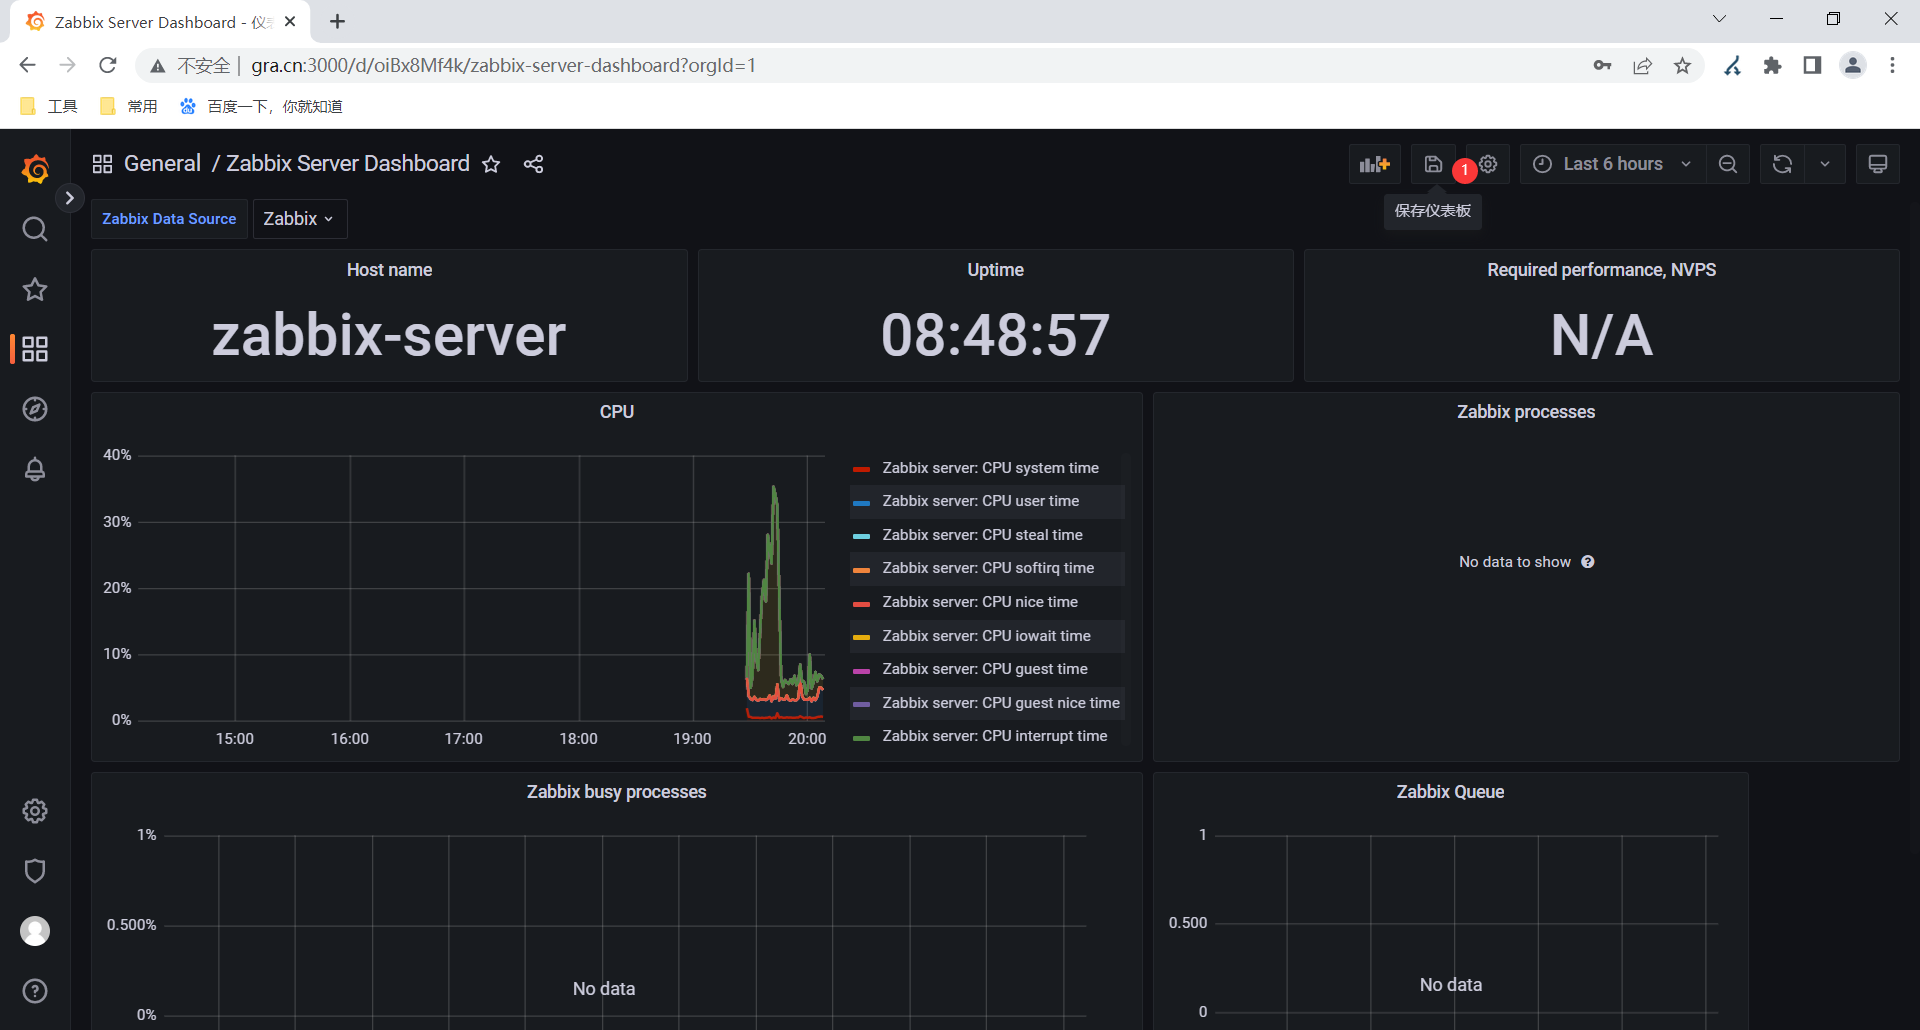
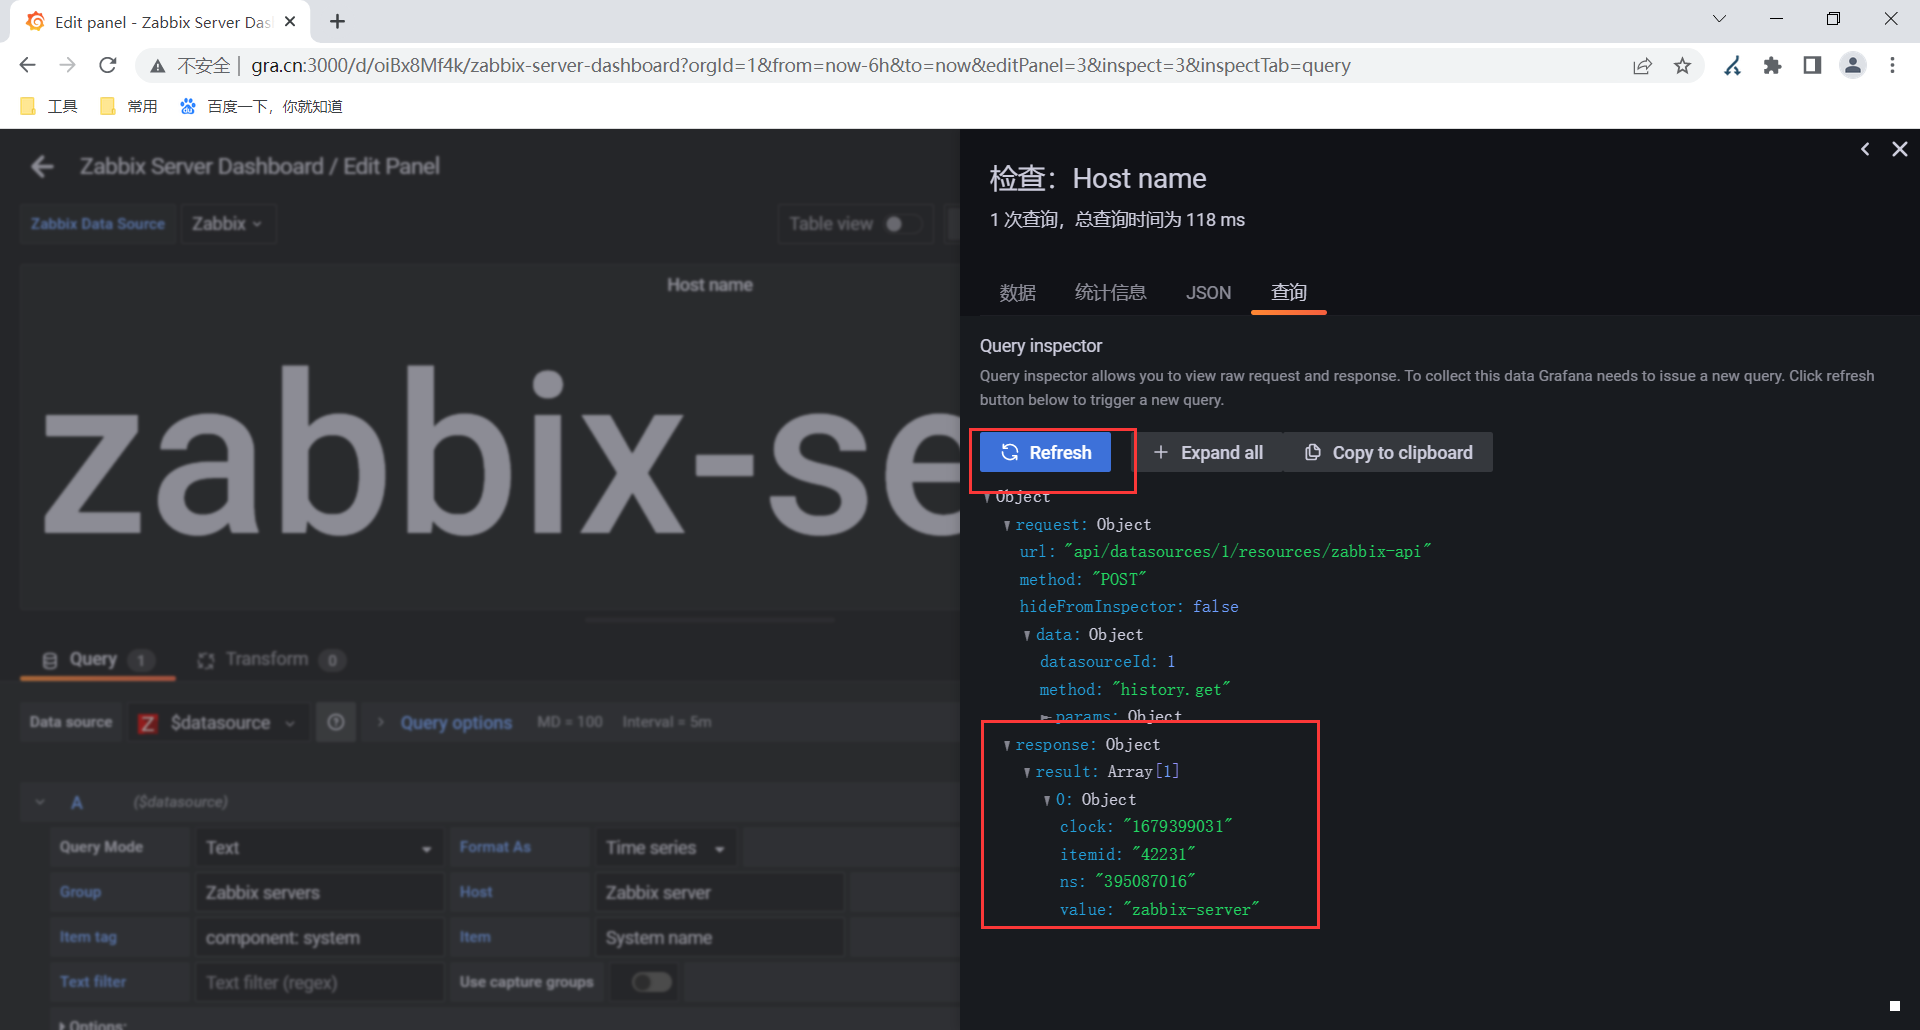
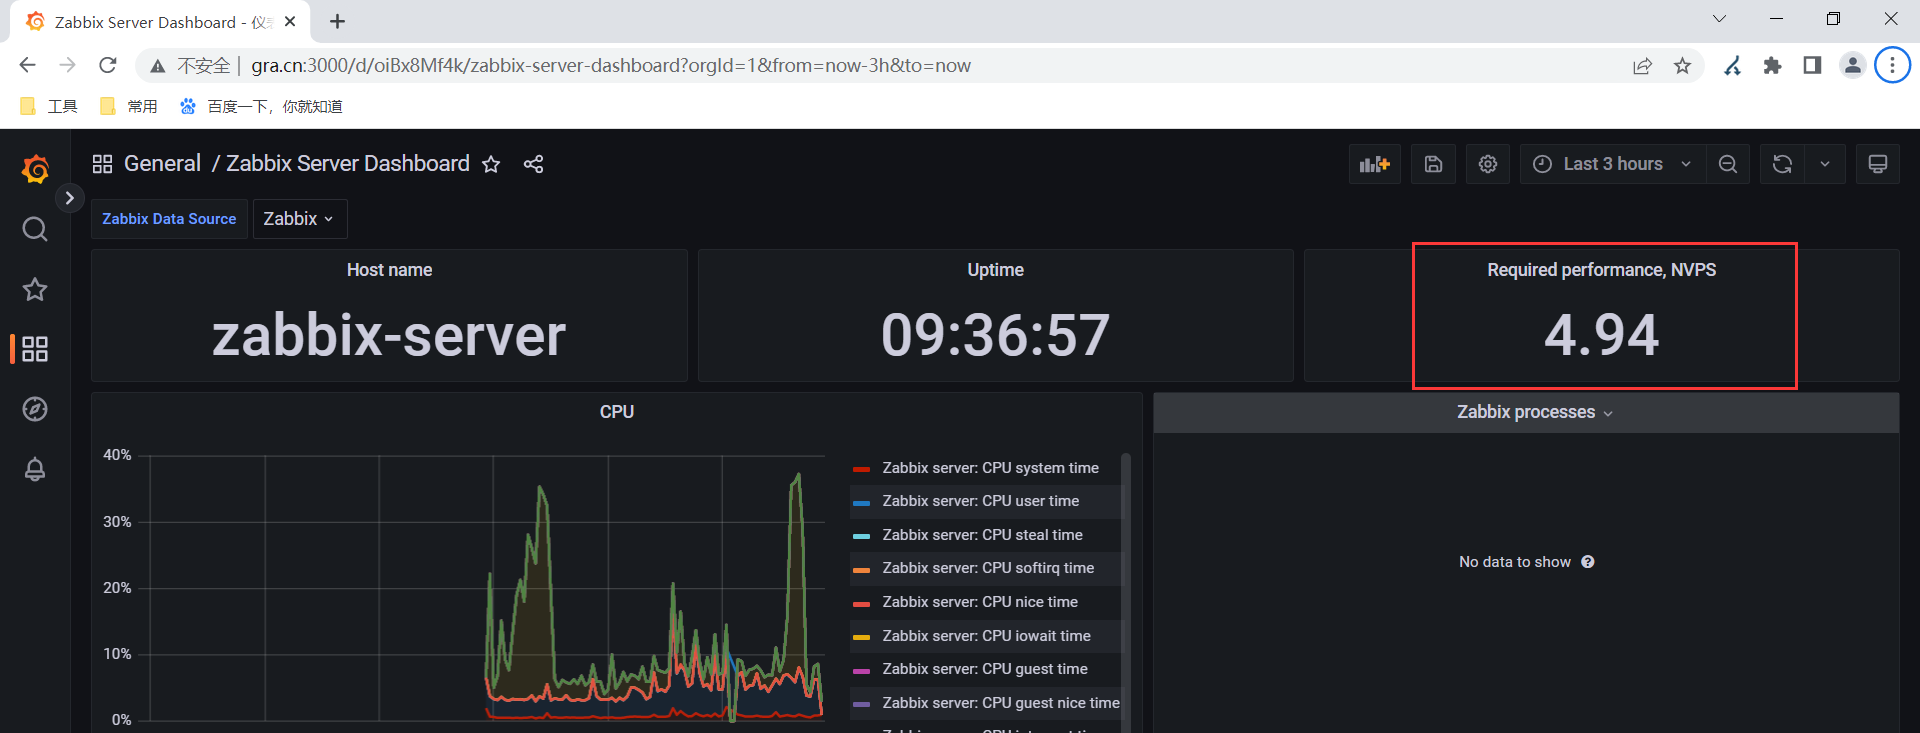
5.测试是否从zabbix获取值
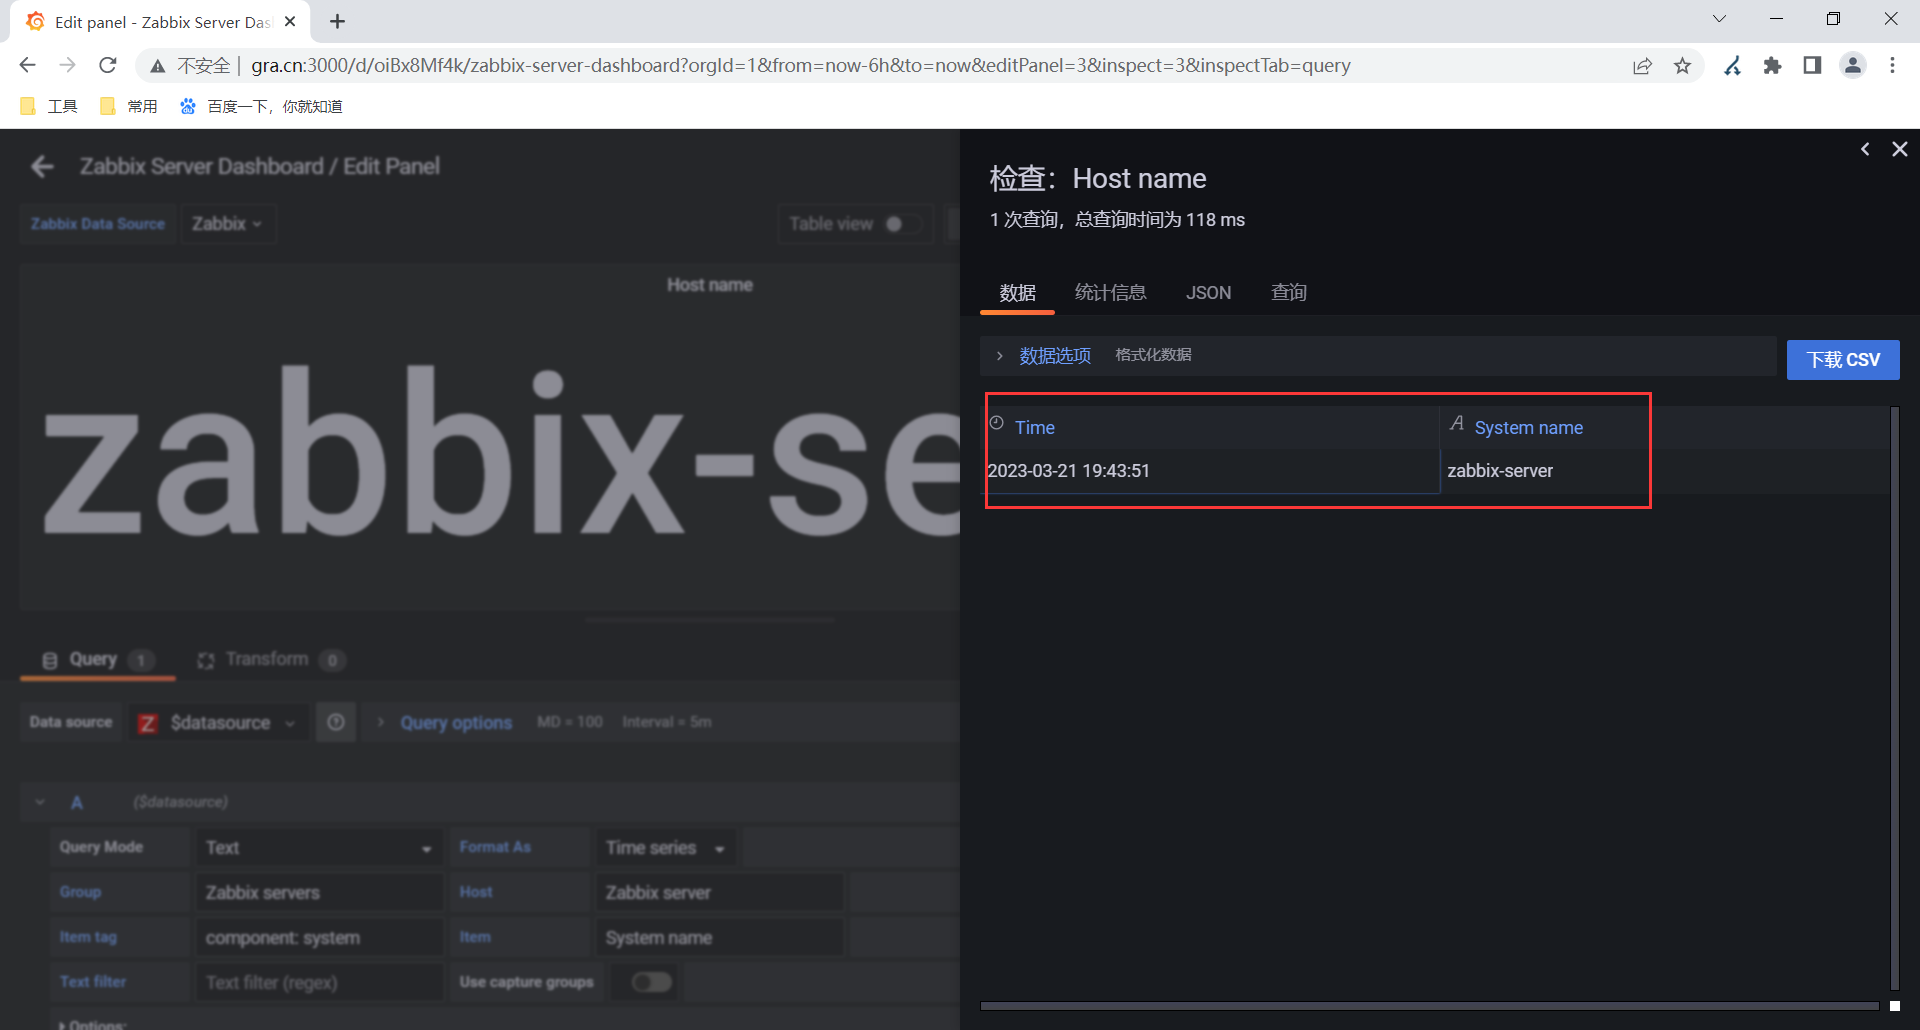
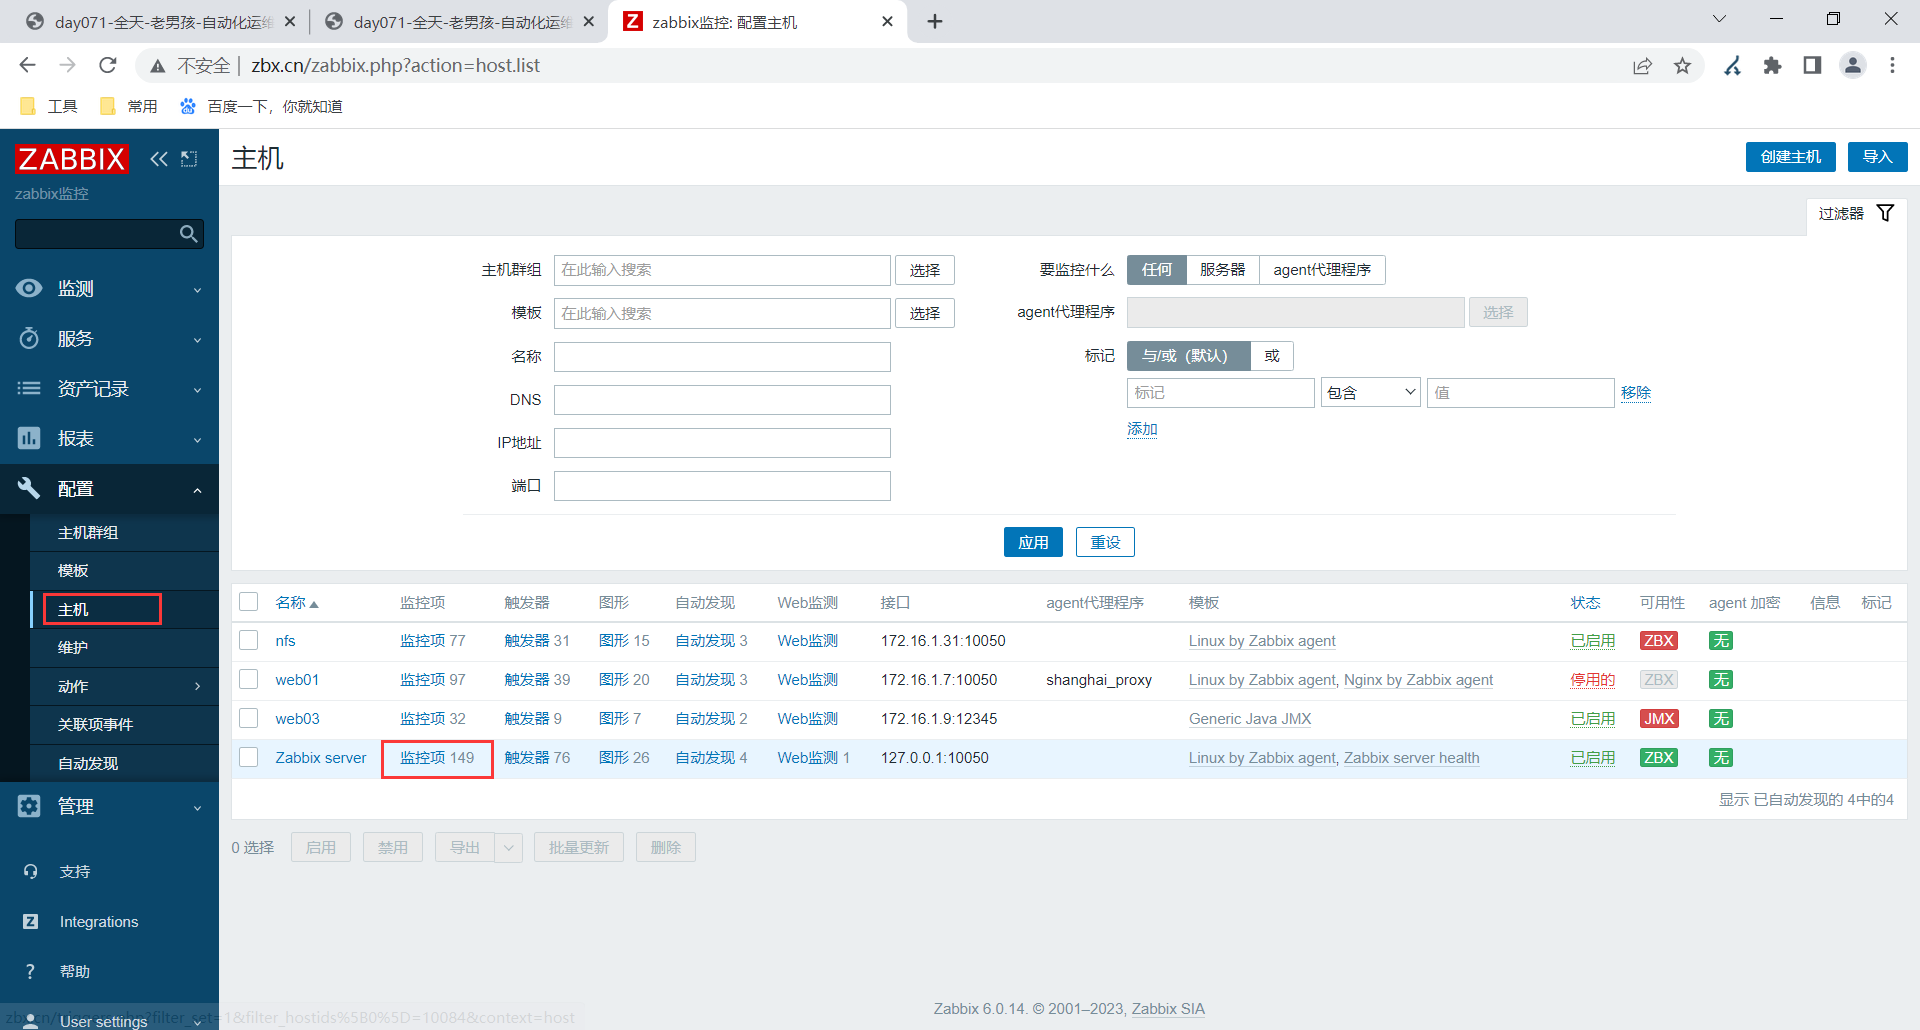
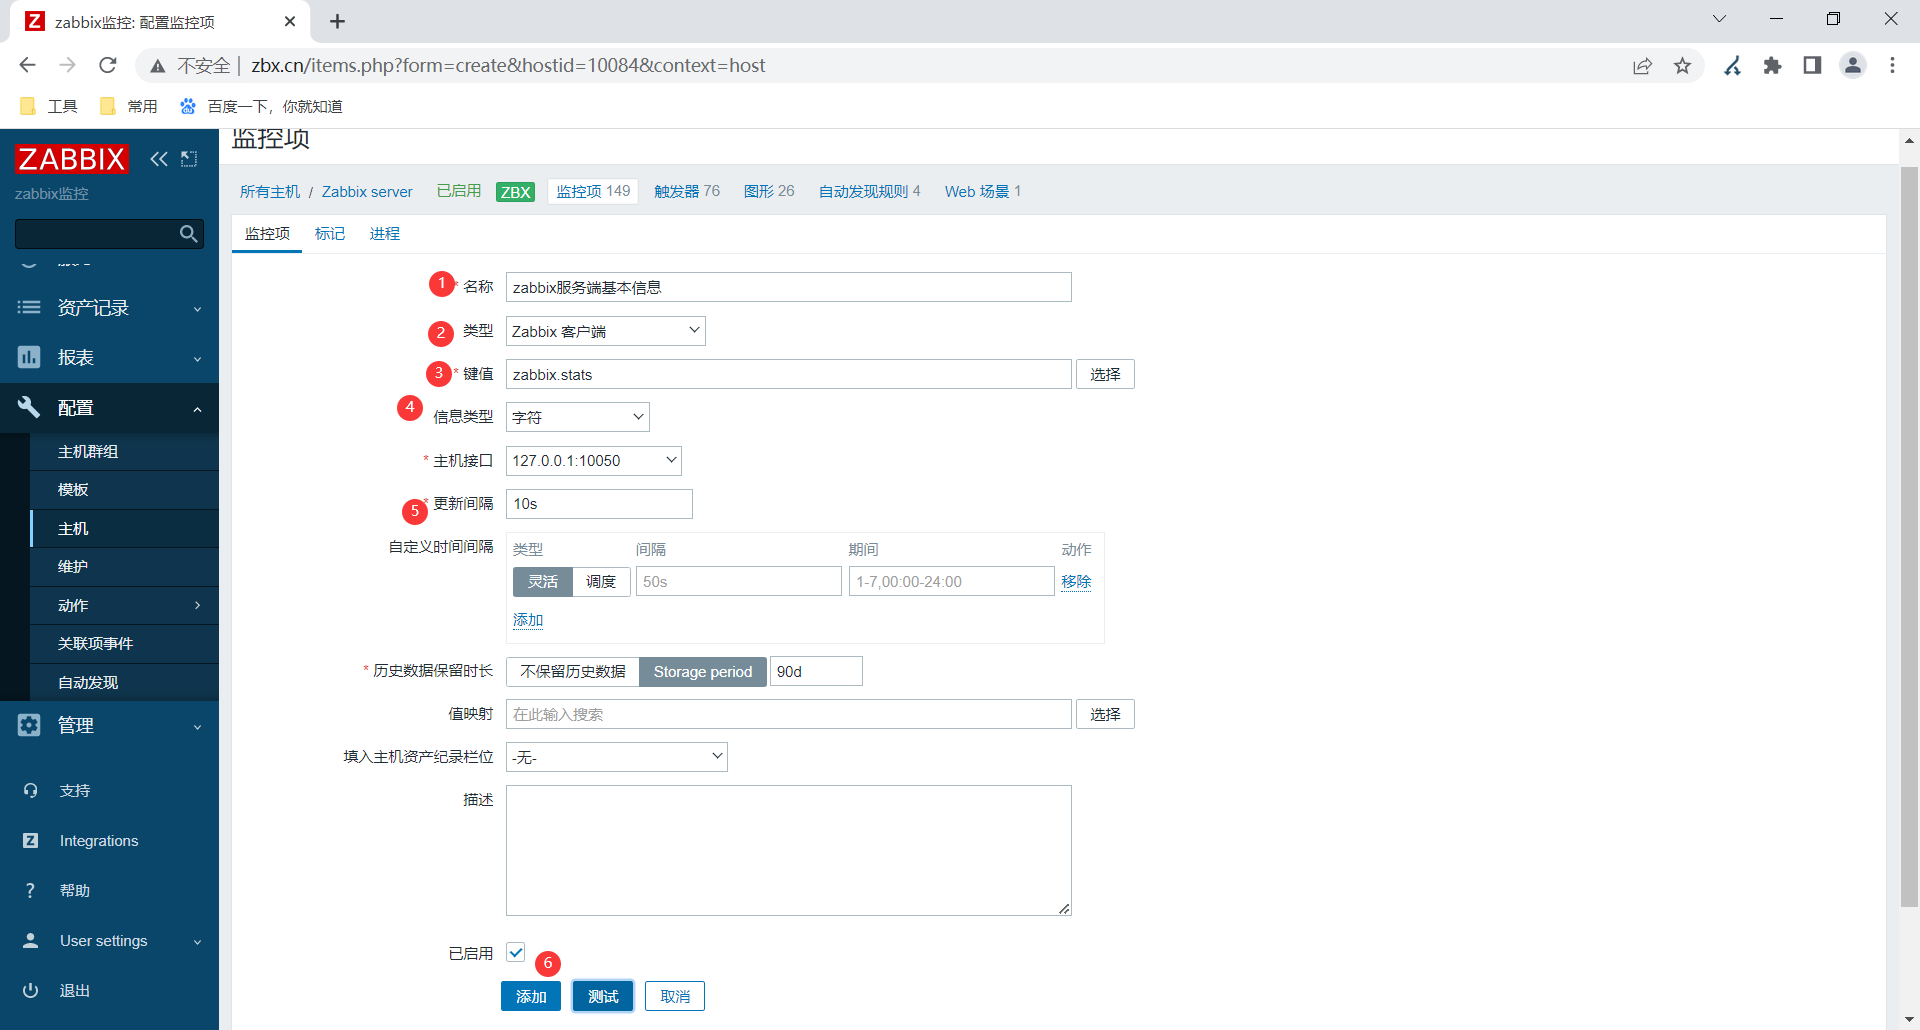
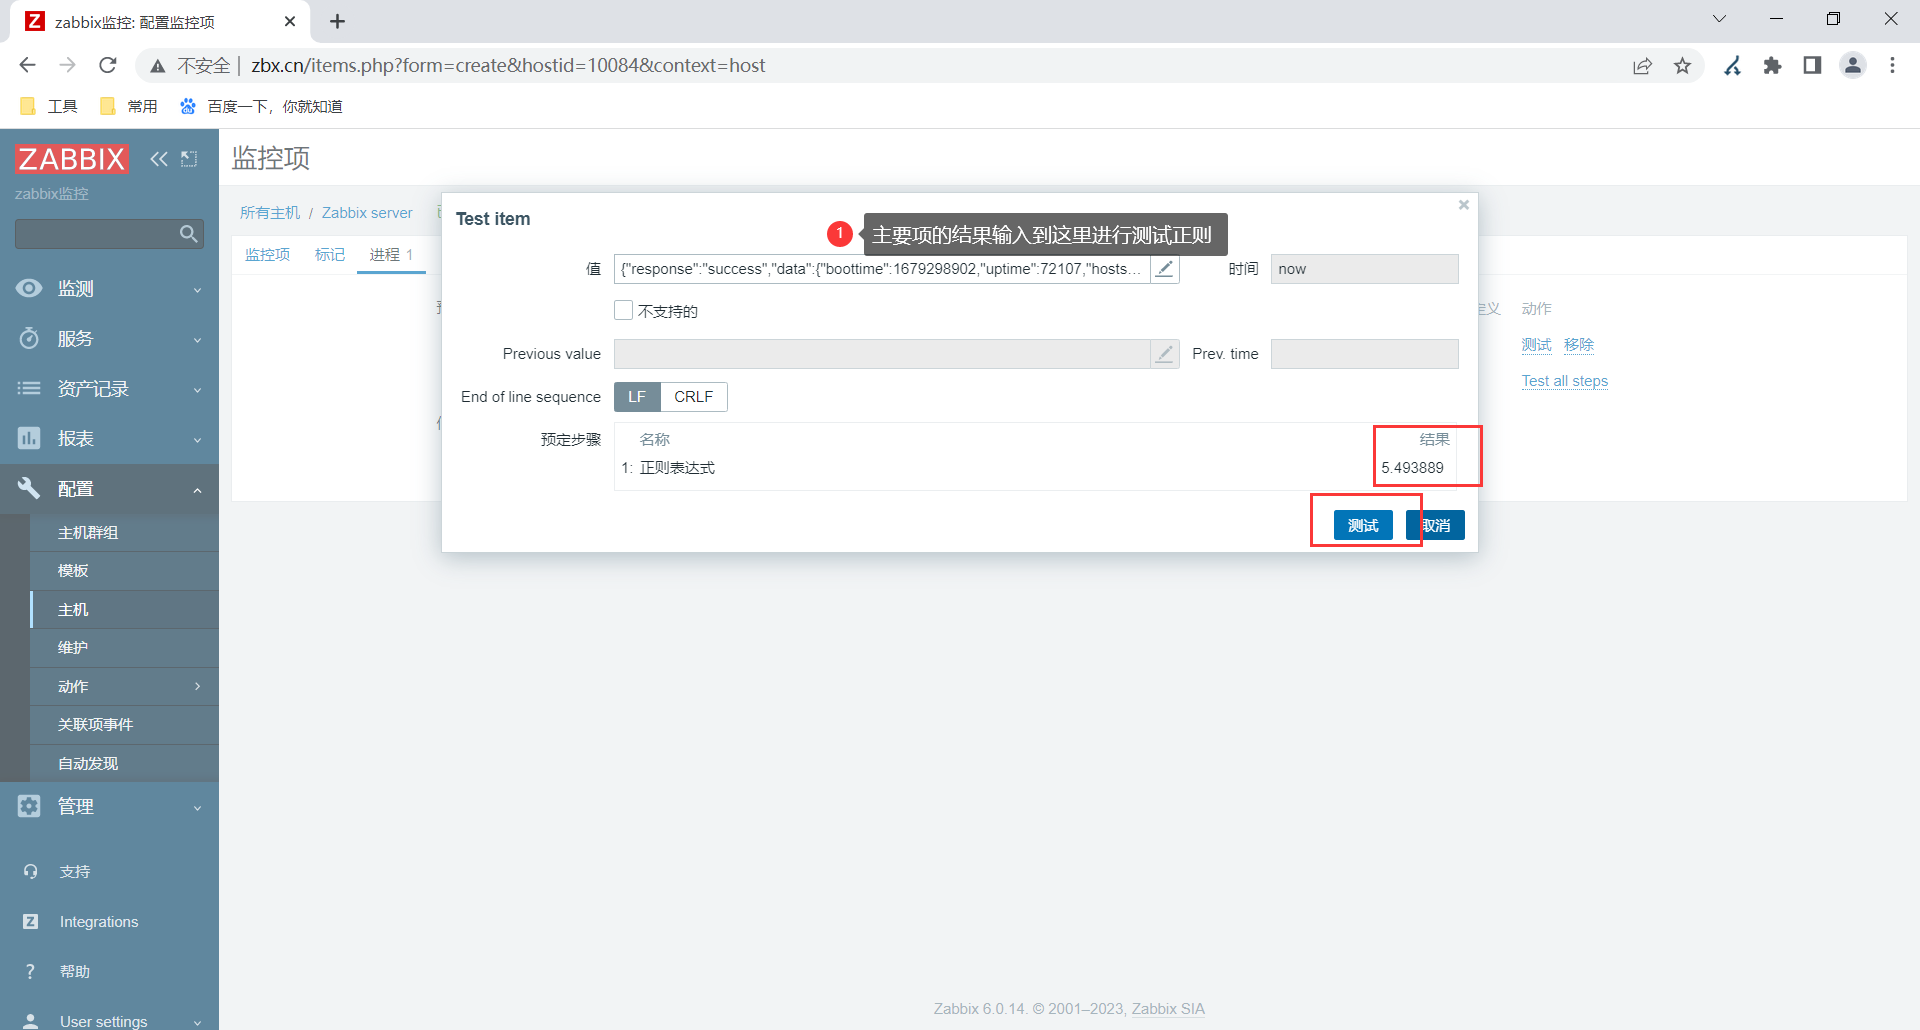
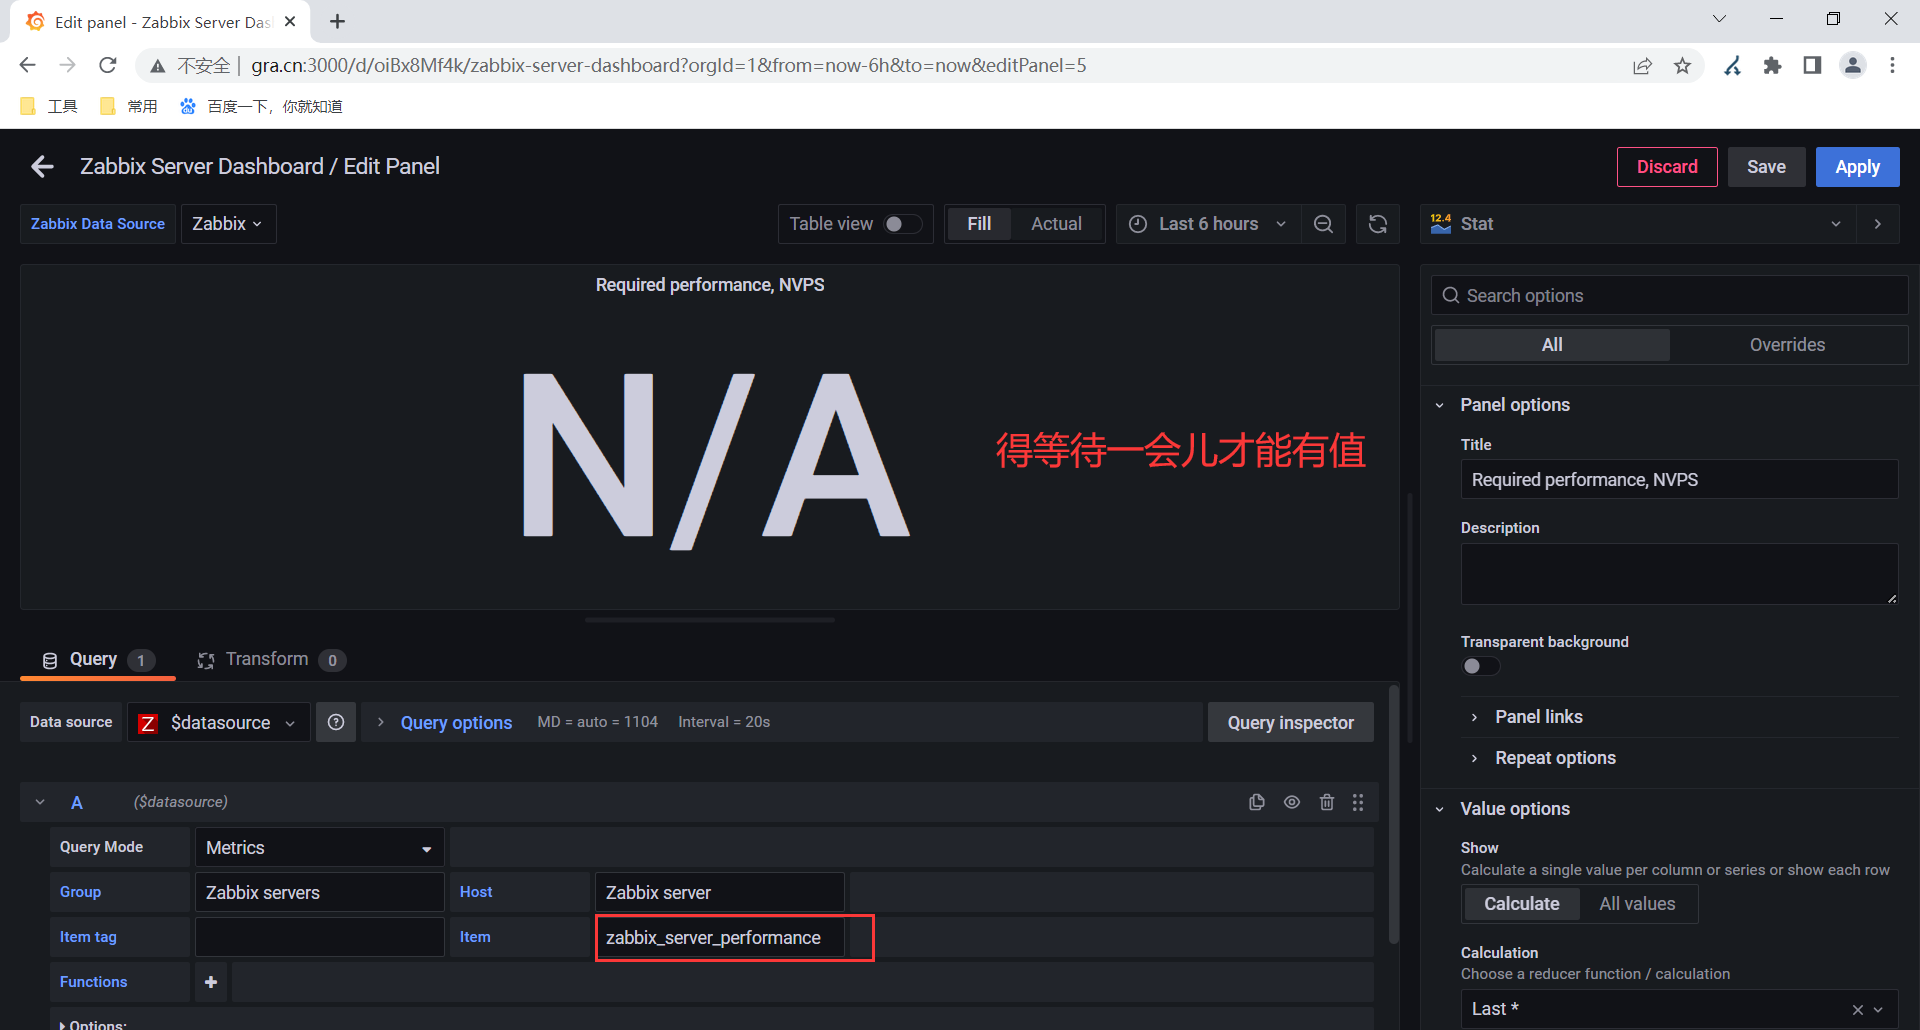
四、自定义监控获取zbx服务端的每秒新值
zabbix.stats键值的结果之一.
需要通过自定义监控创建1个监控项运行zabbix.stats键值.
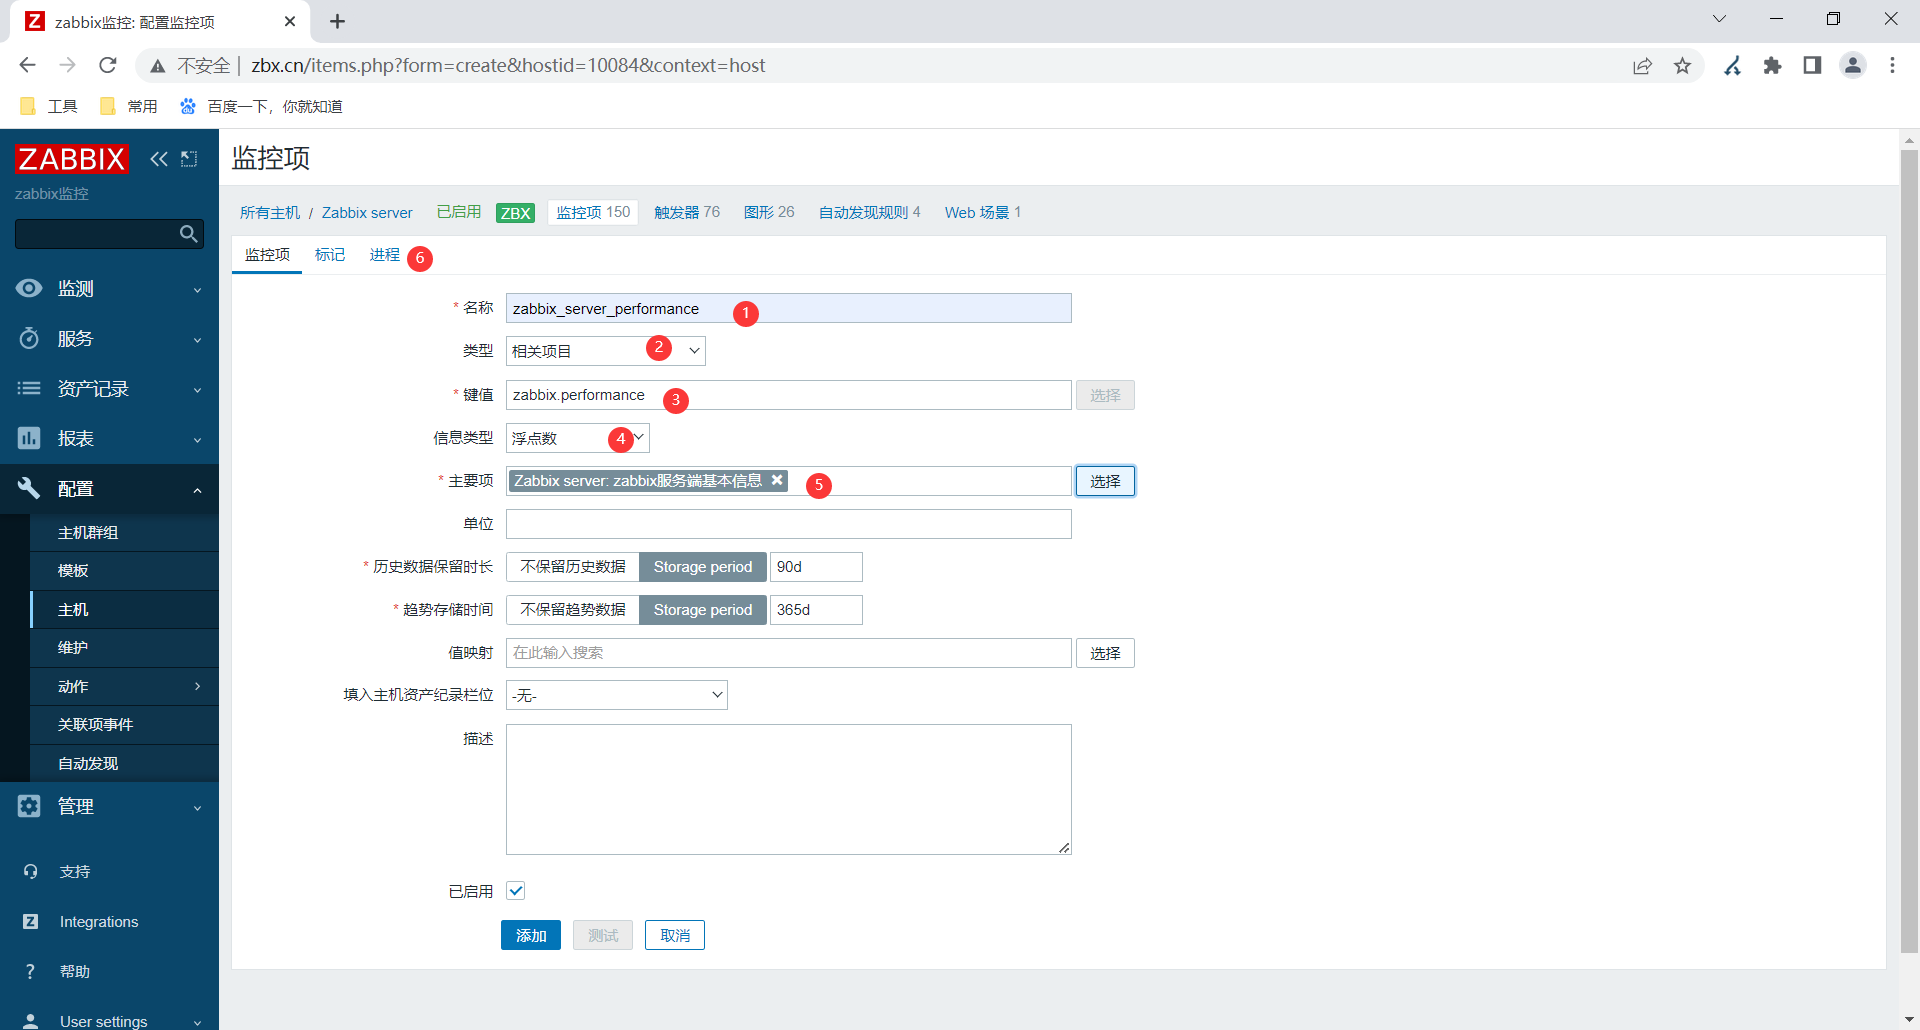
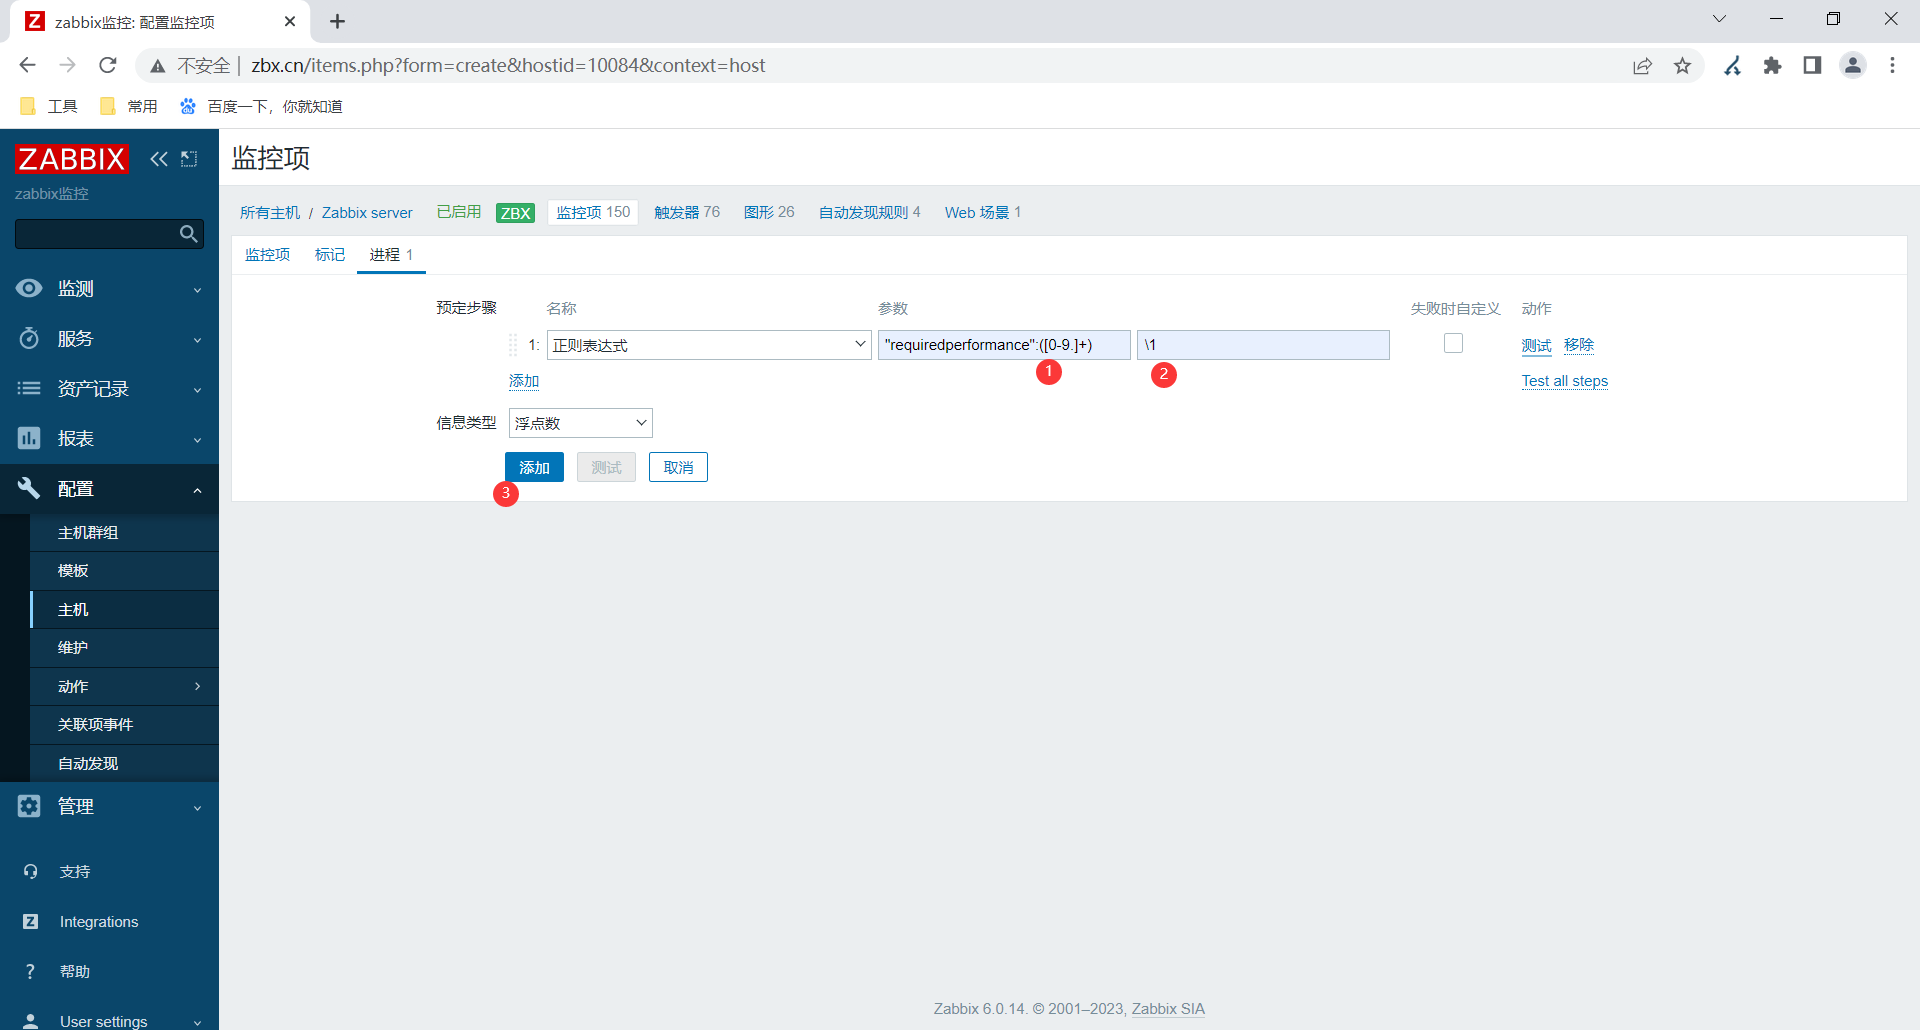
创建相关项(监控项)对上面监控项结果进行过滤(sed反向引用).
1.定义监控项(主要项)
2.创建相关项
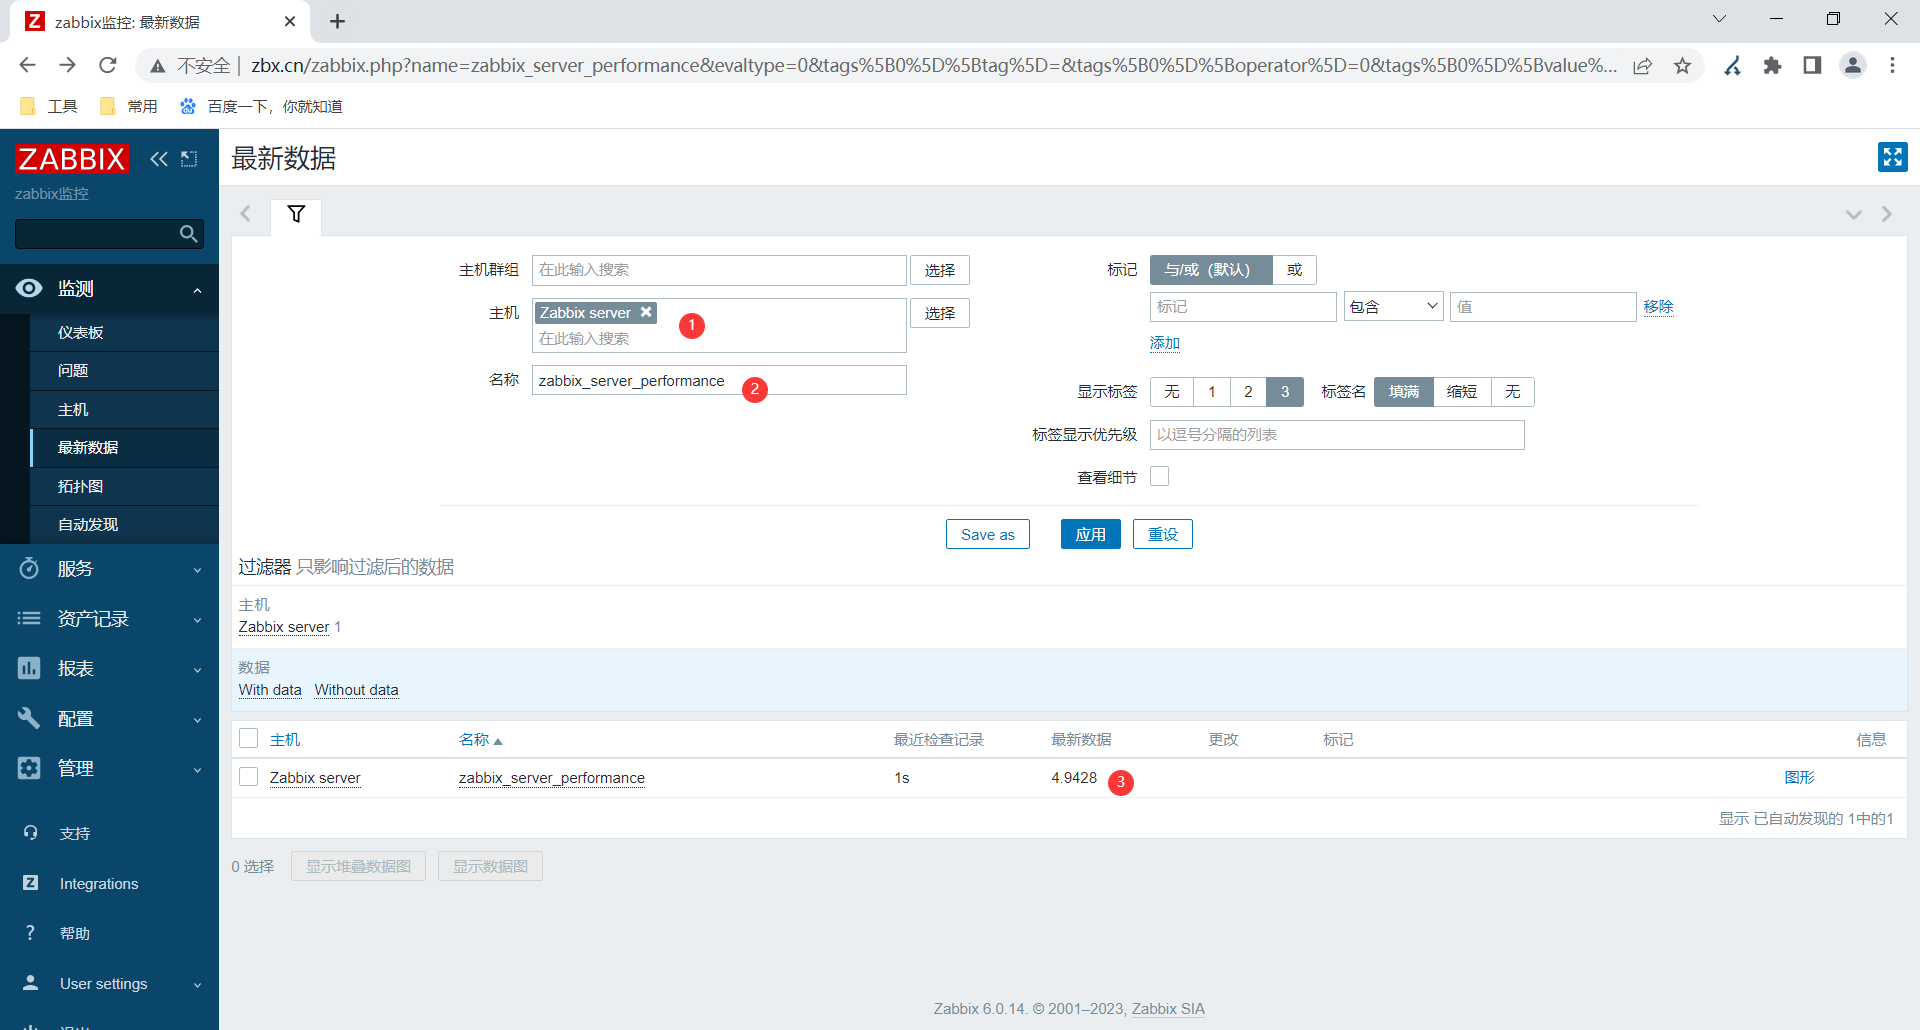
注意事项:
如果zabbix做了高可用,这里可能会有问题
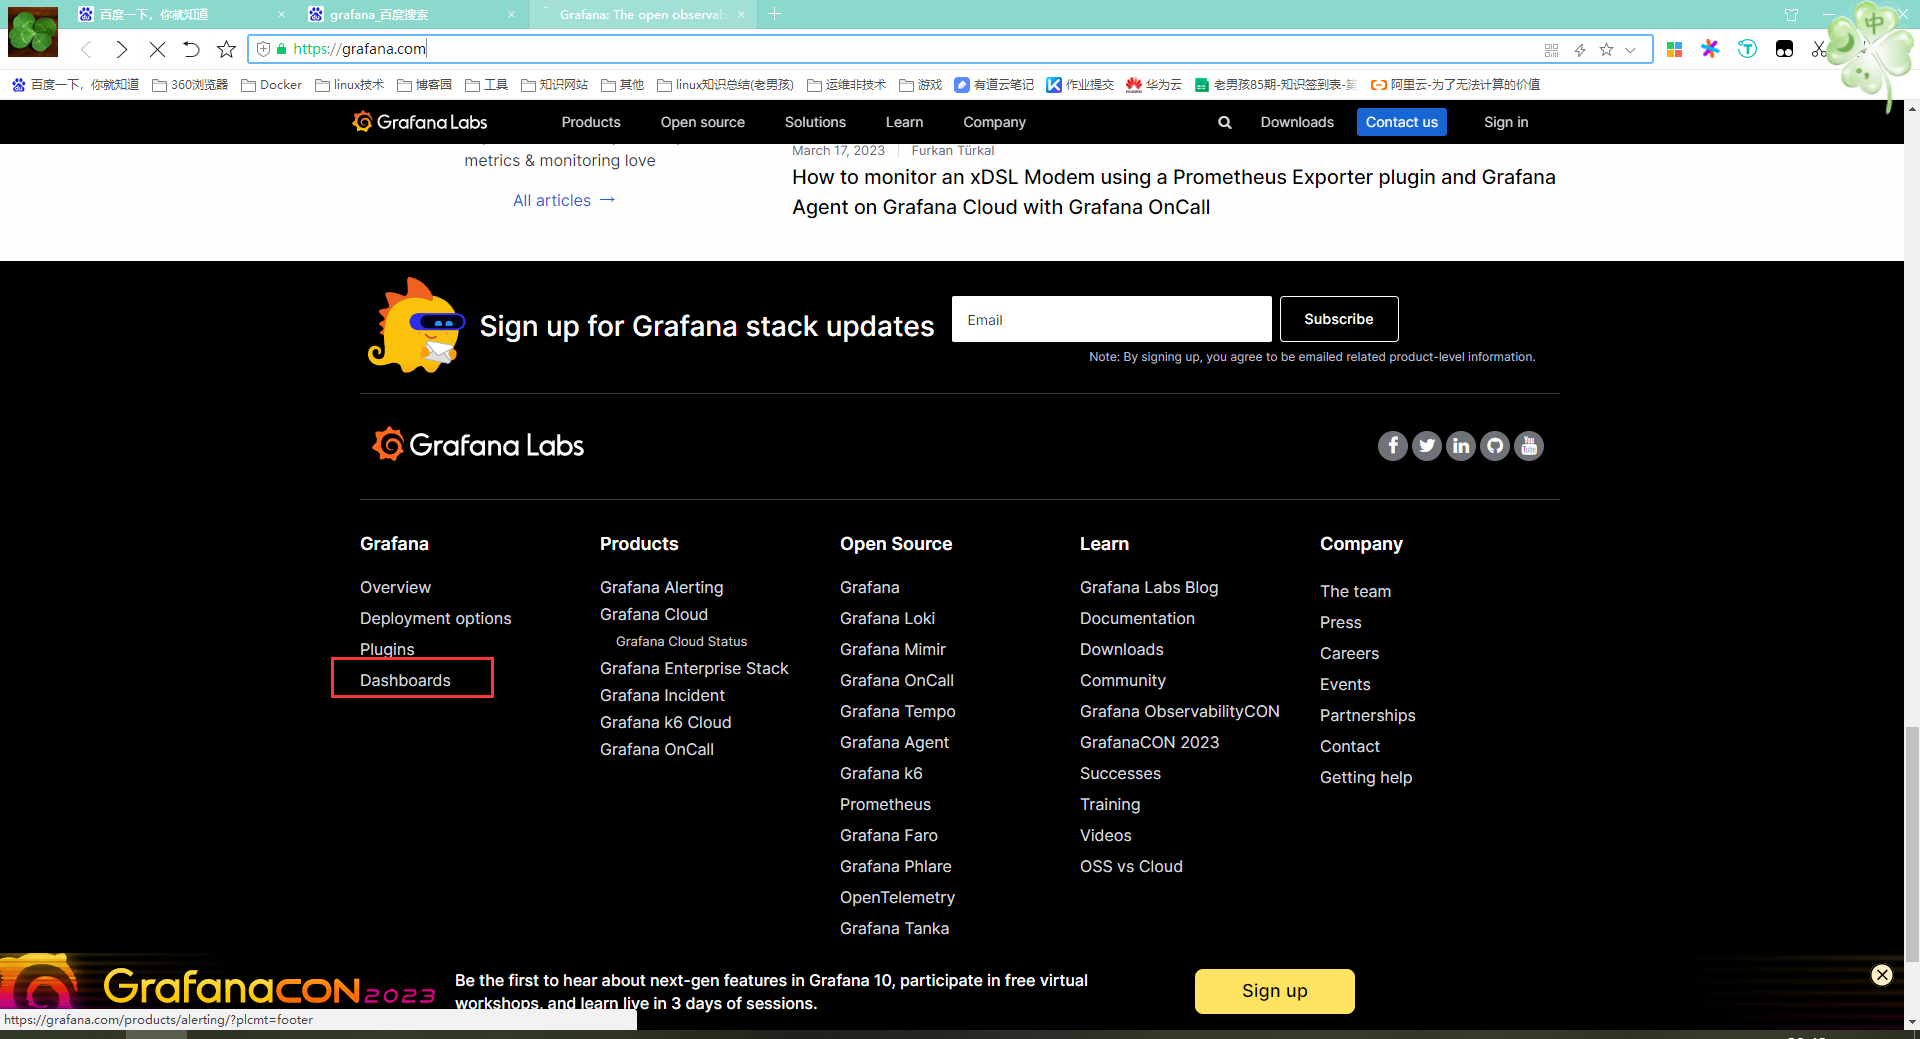
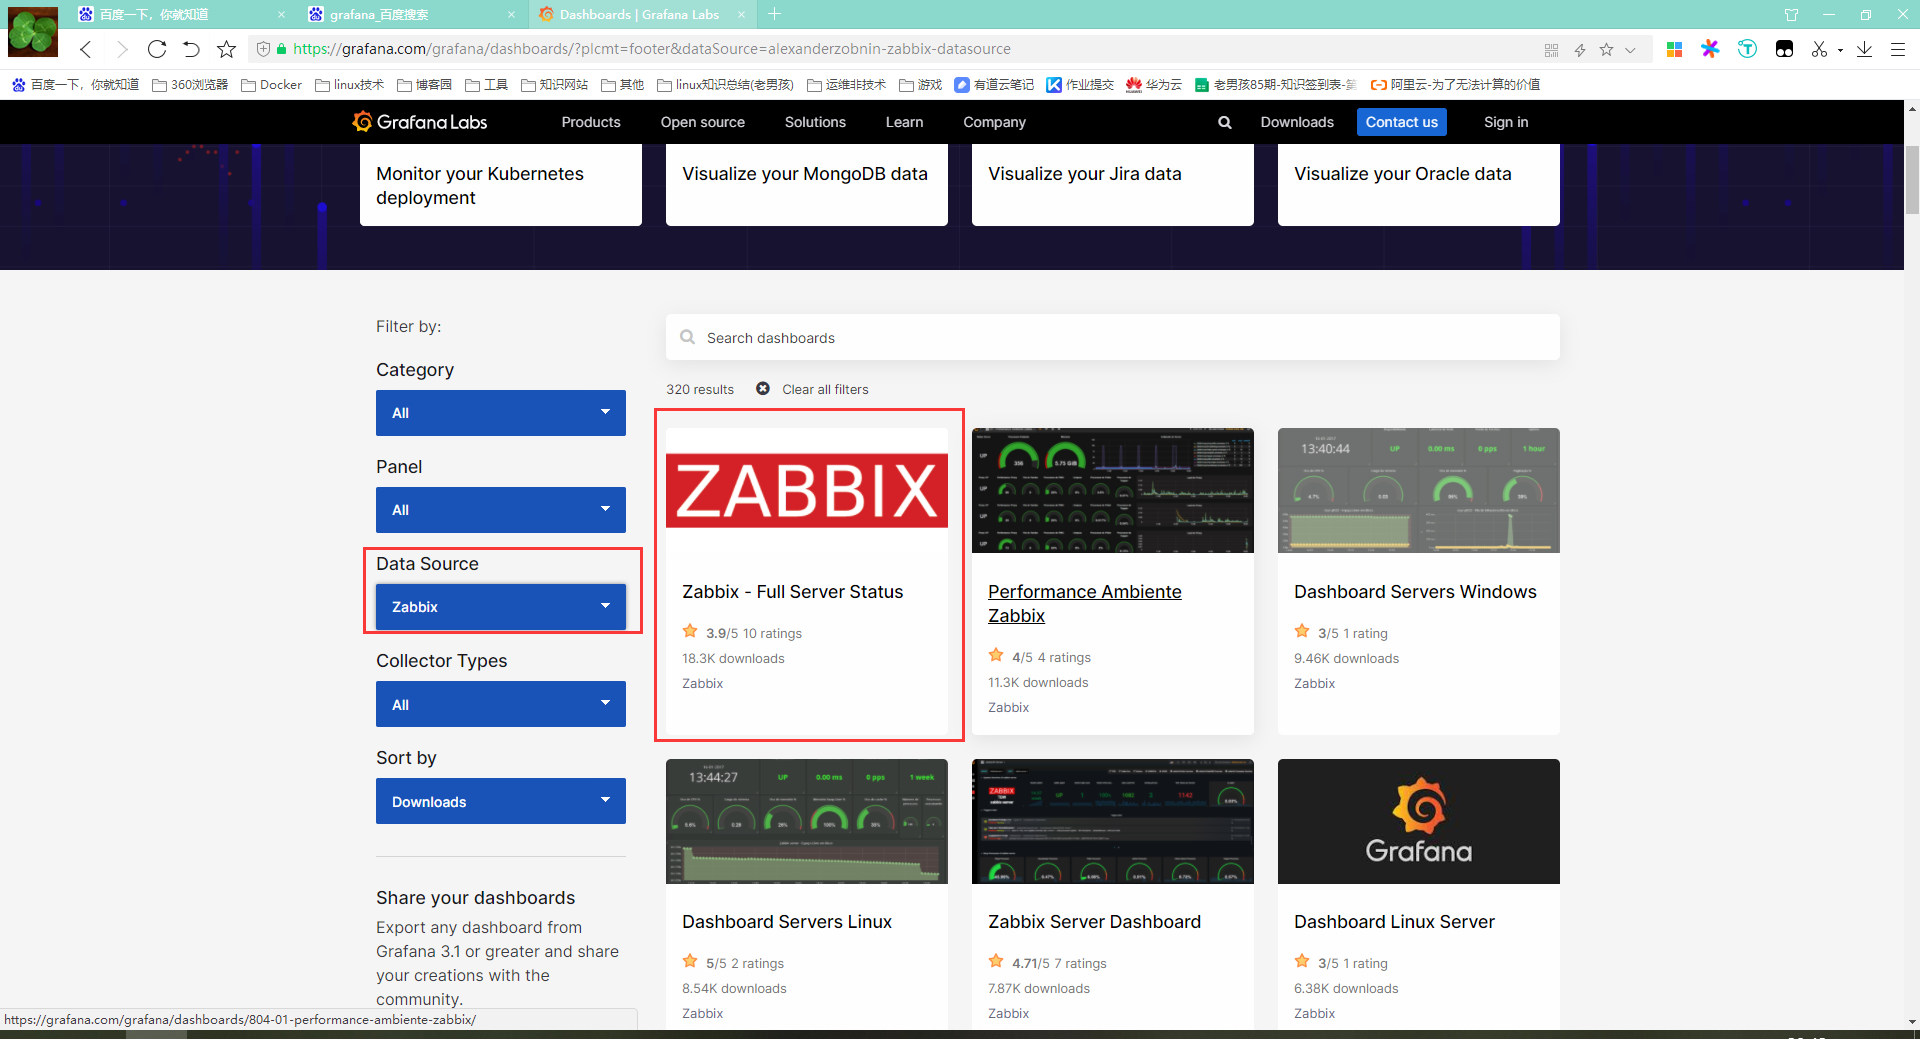
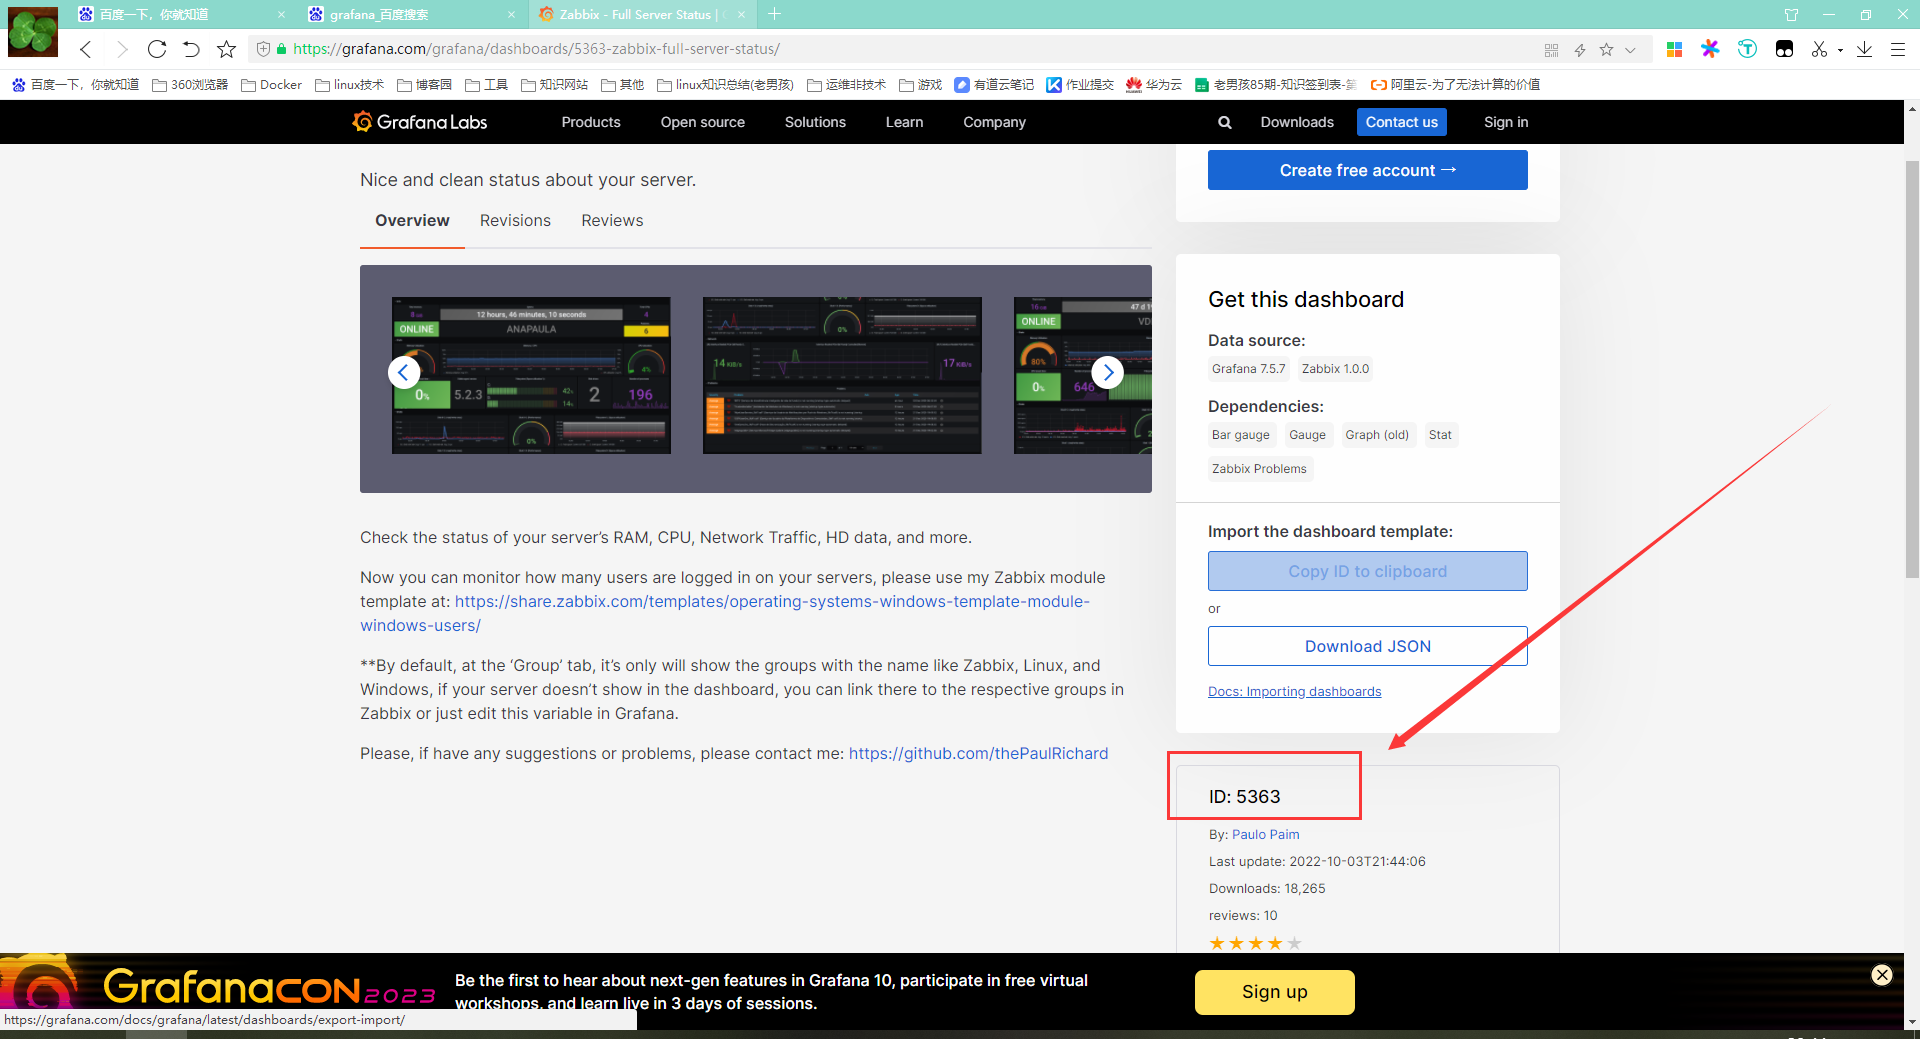
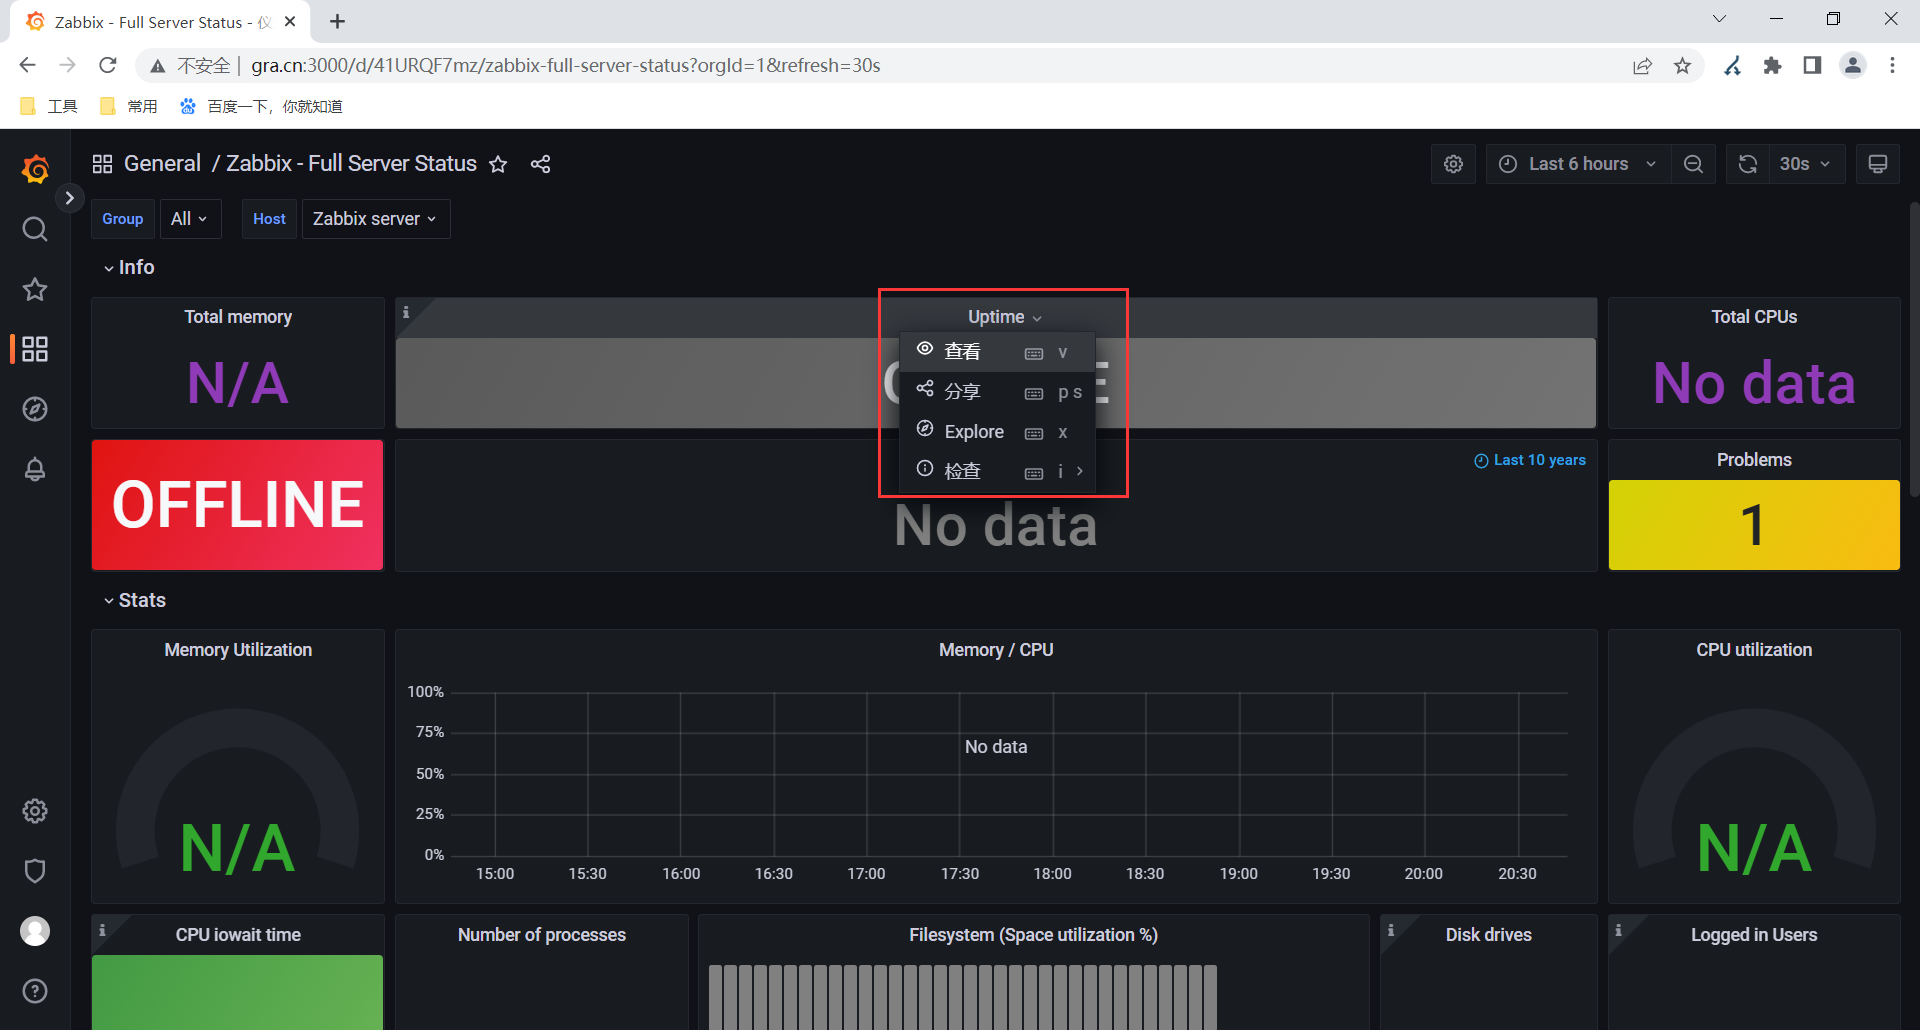
五、更完善的模板(仪表盘)
下载官方仪表盘https://grafana.com/grafana/dashboards/?plcmt=footer
1.下载模板
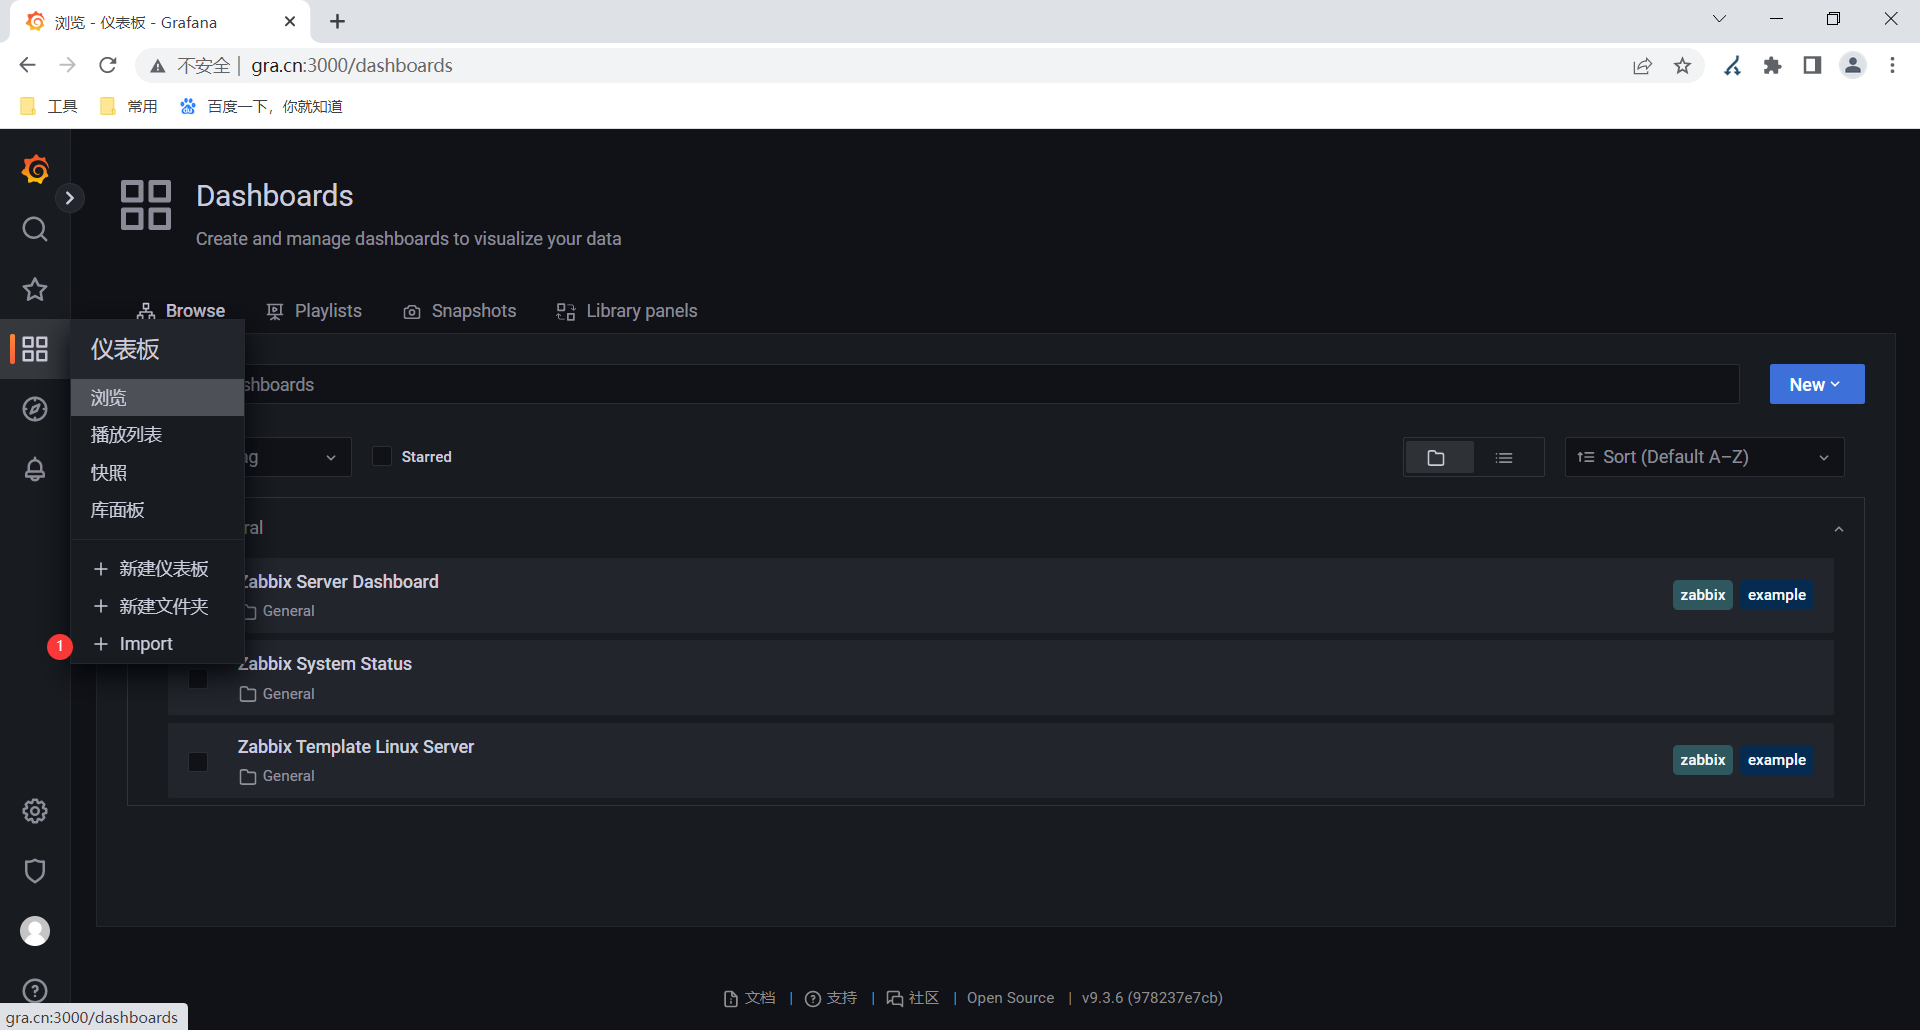
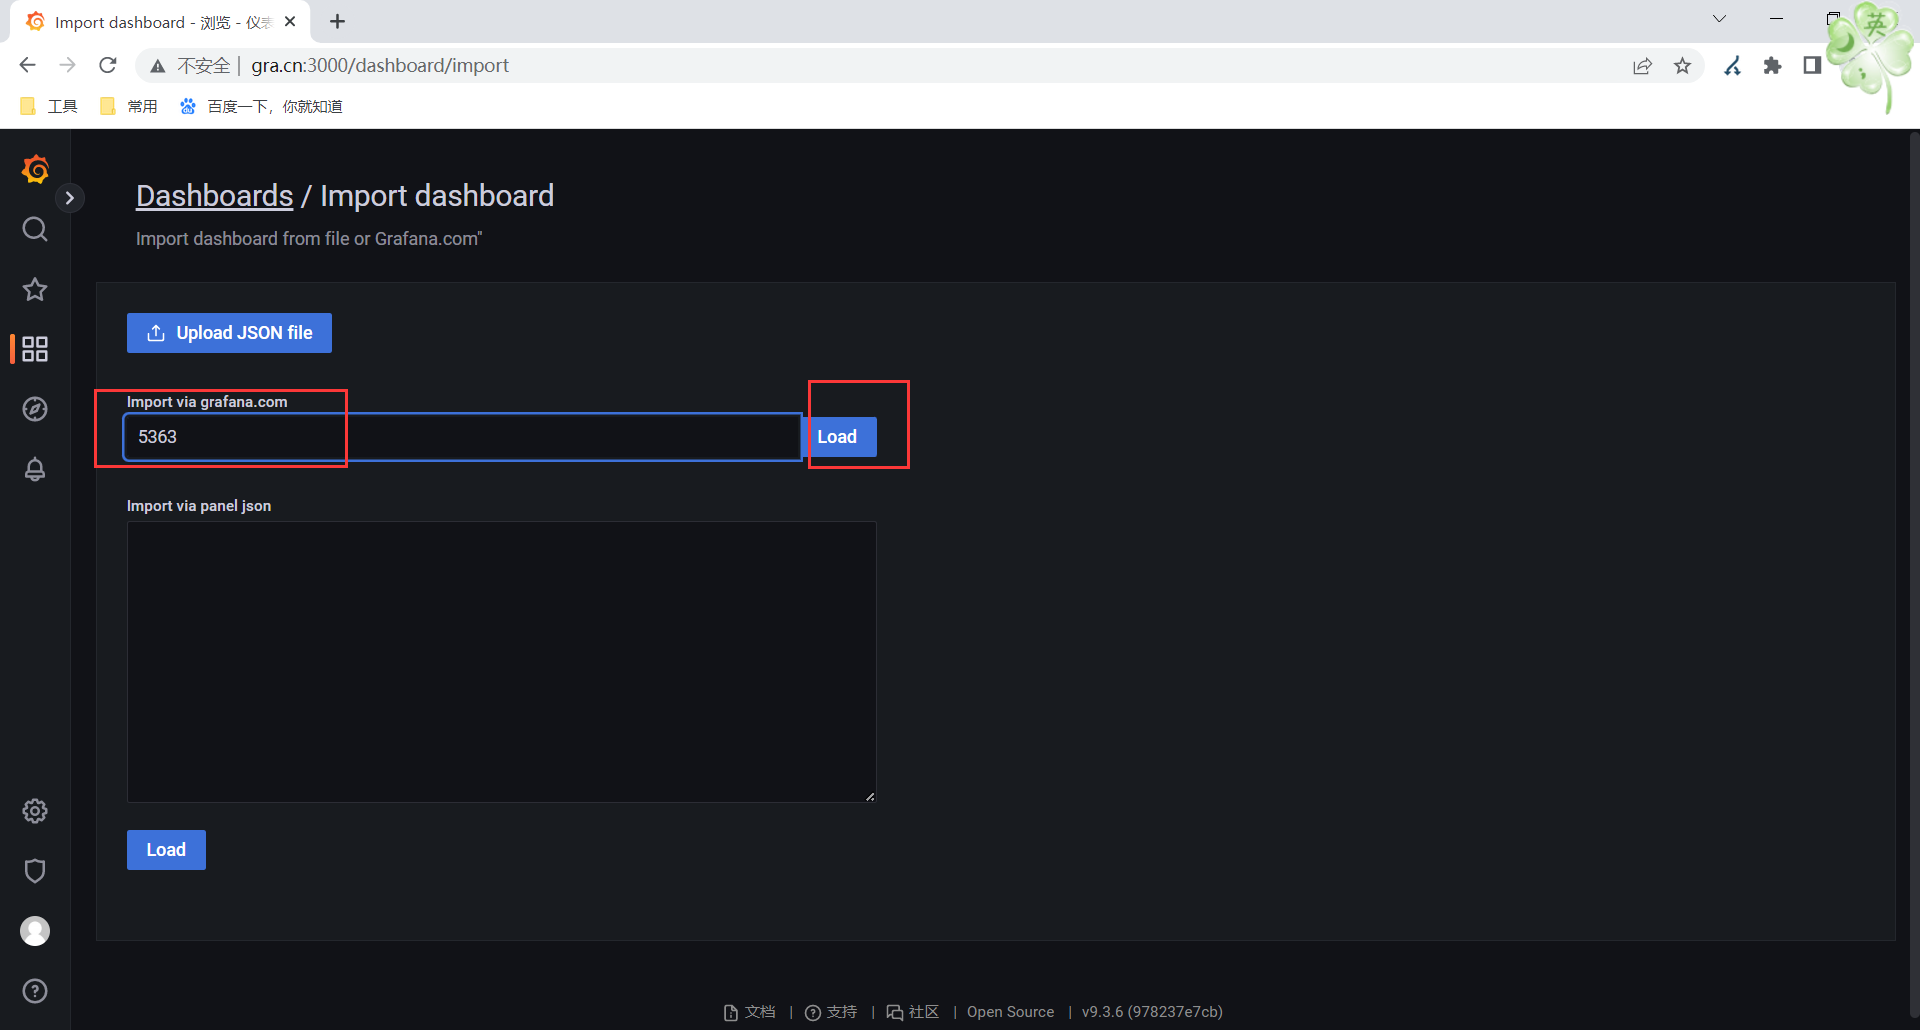
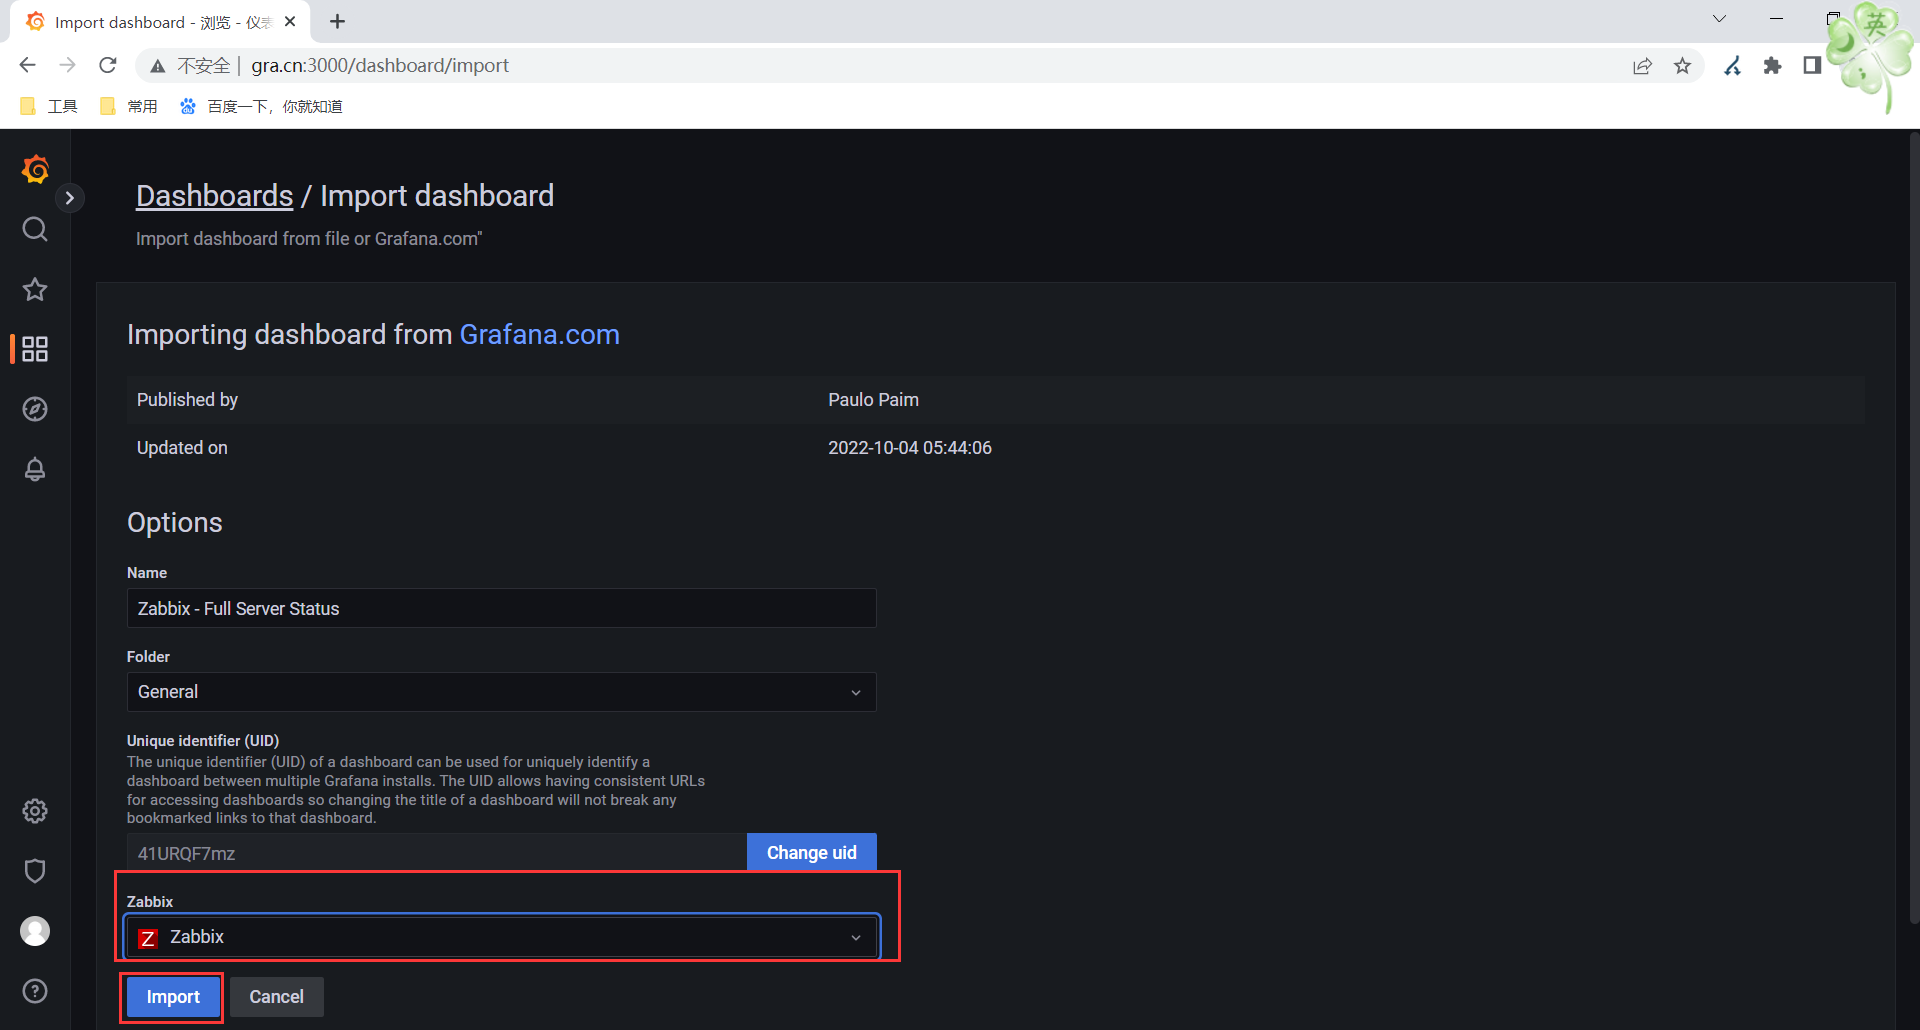
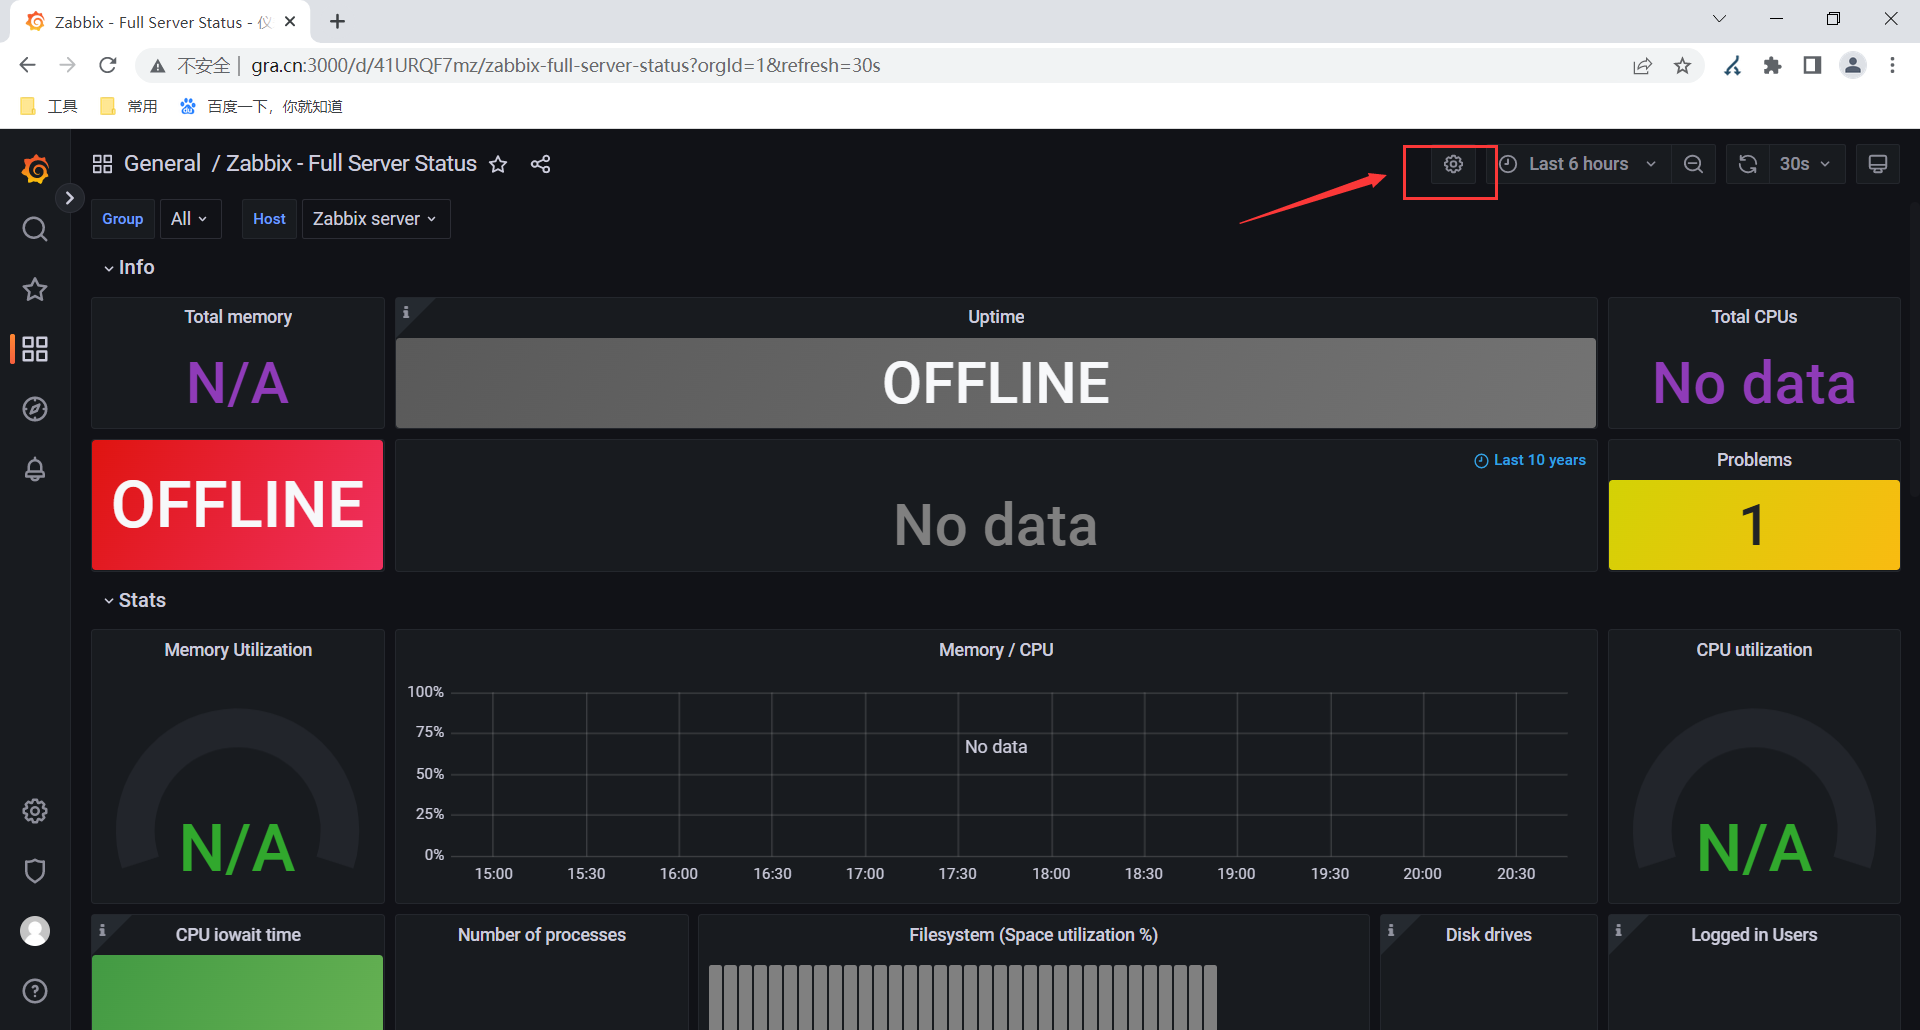
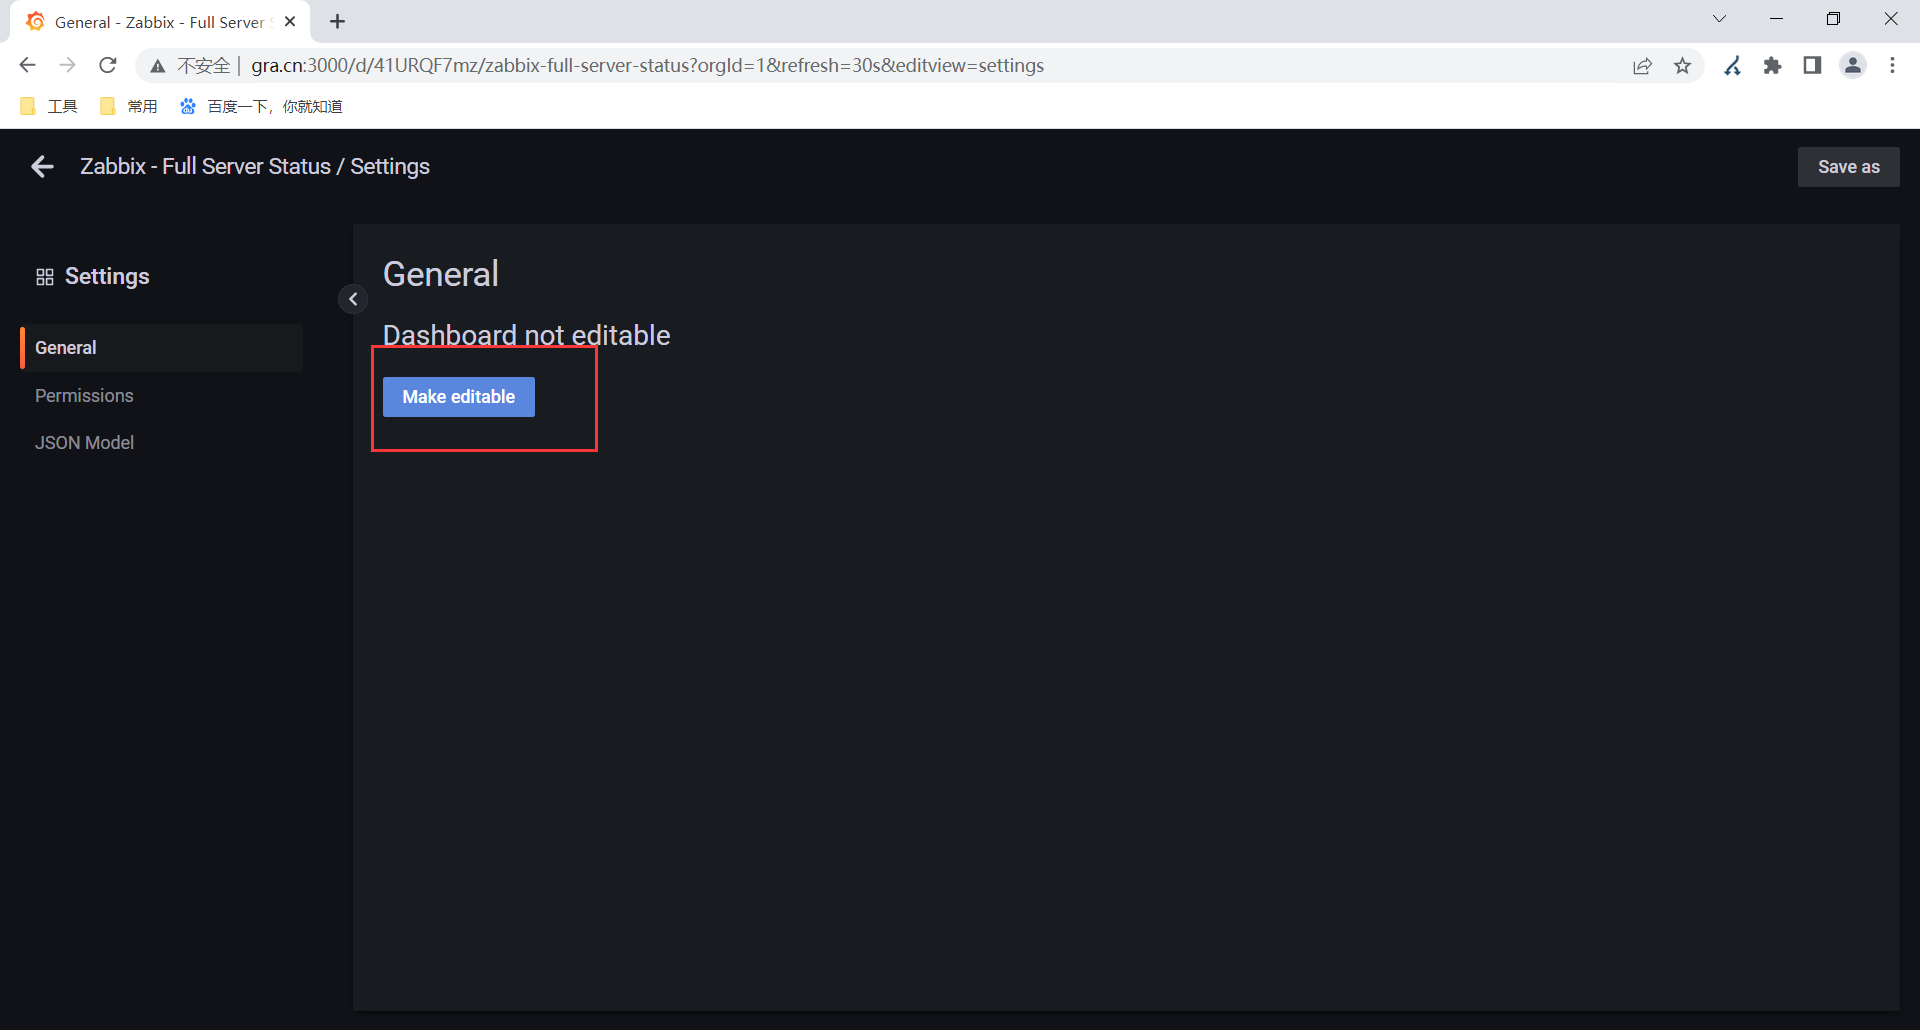
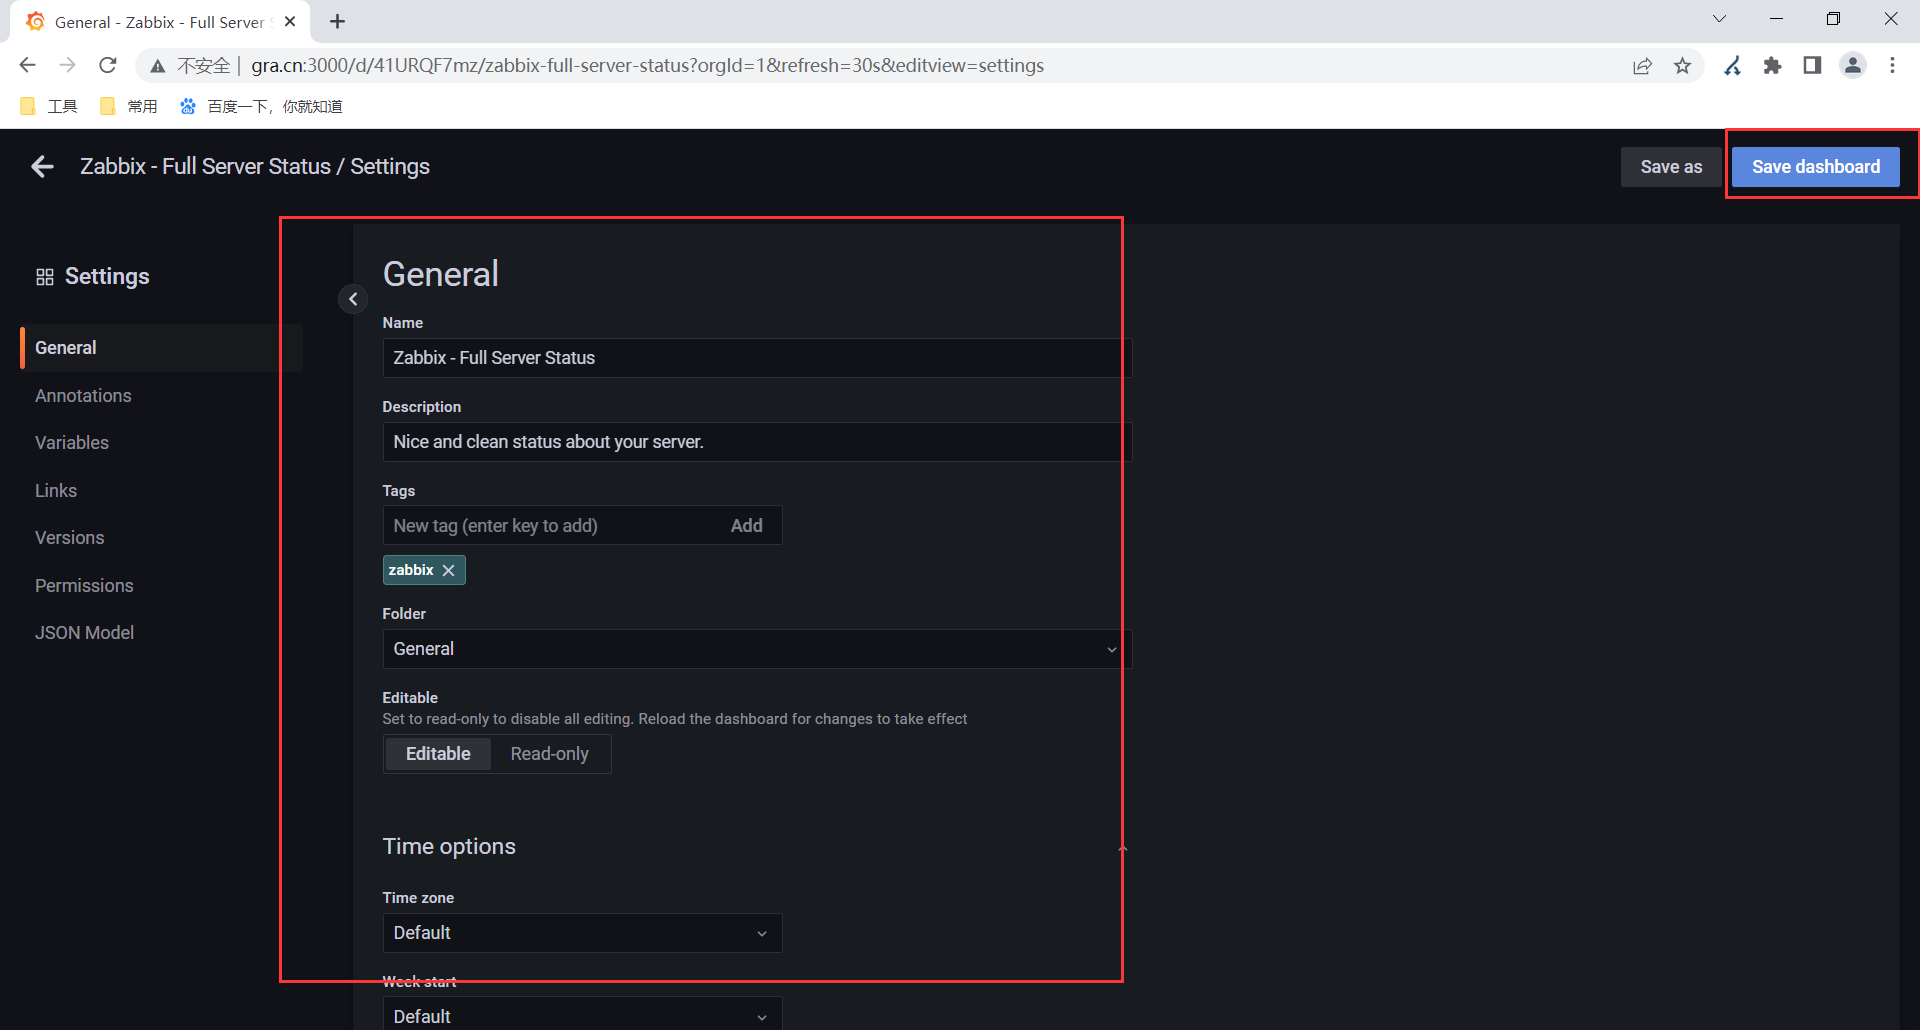
2.配置模板可编辑

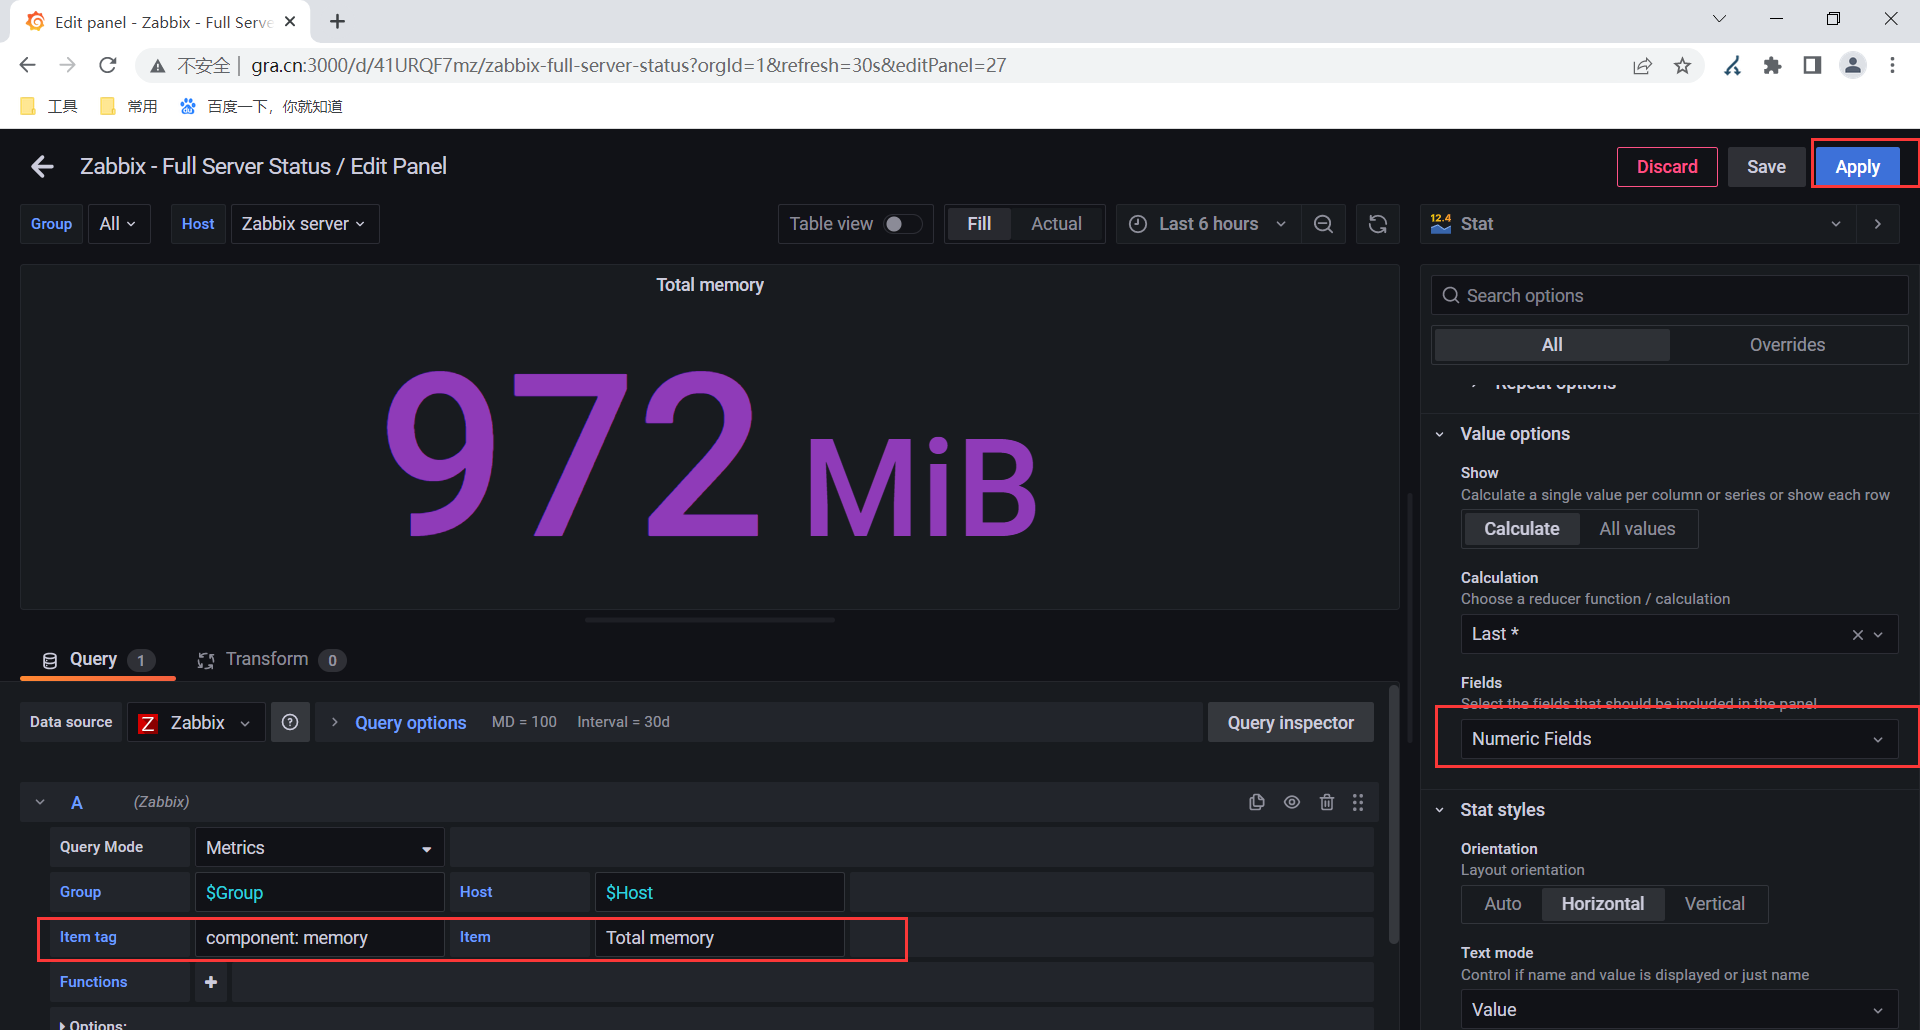
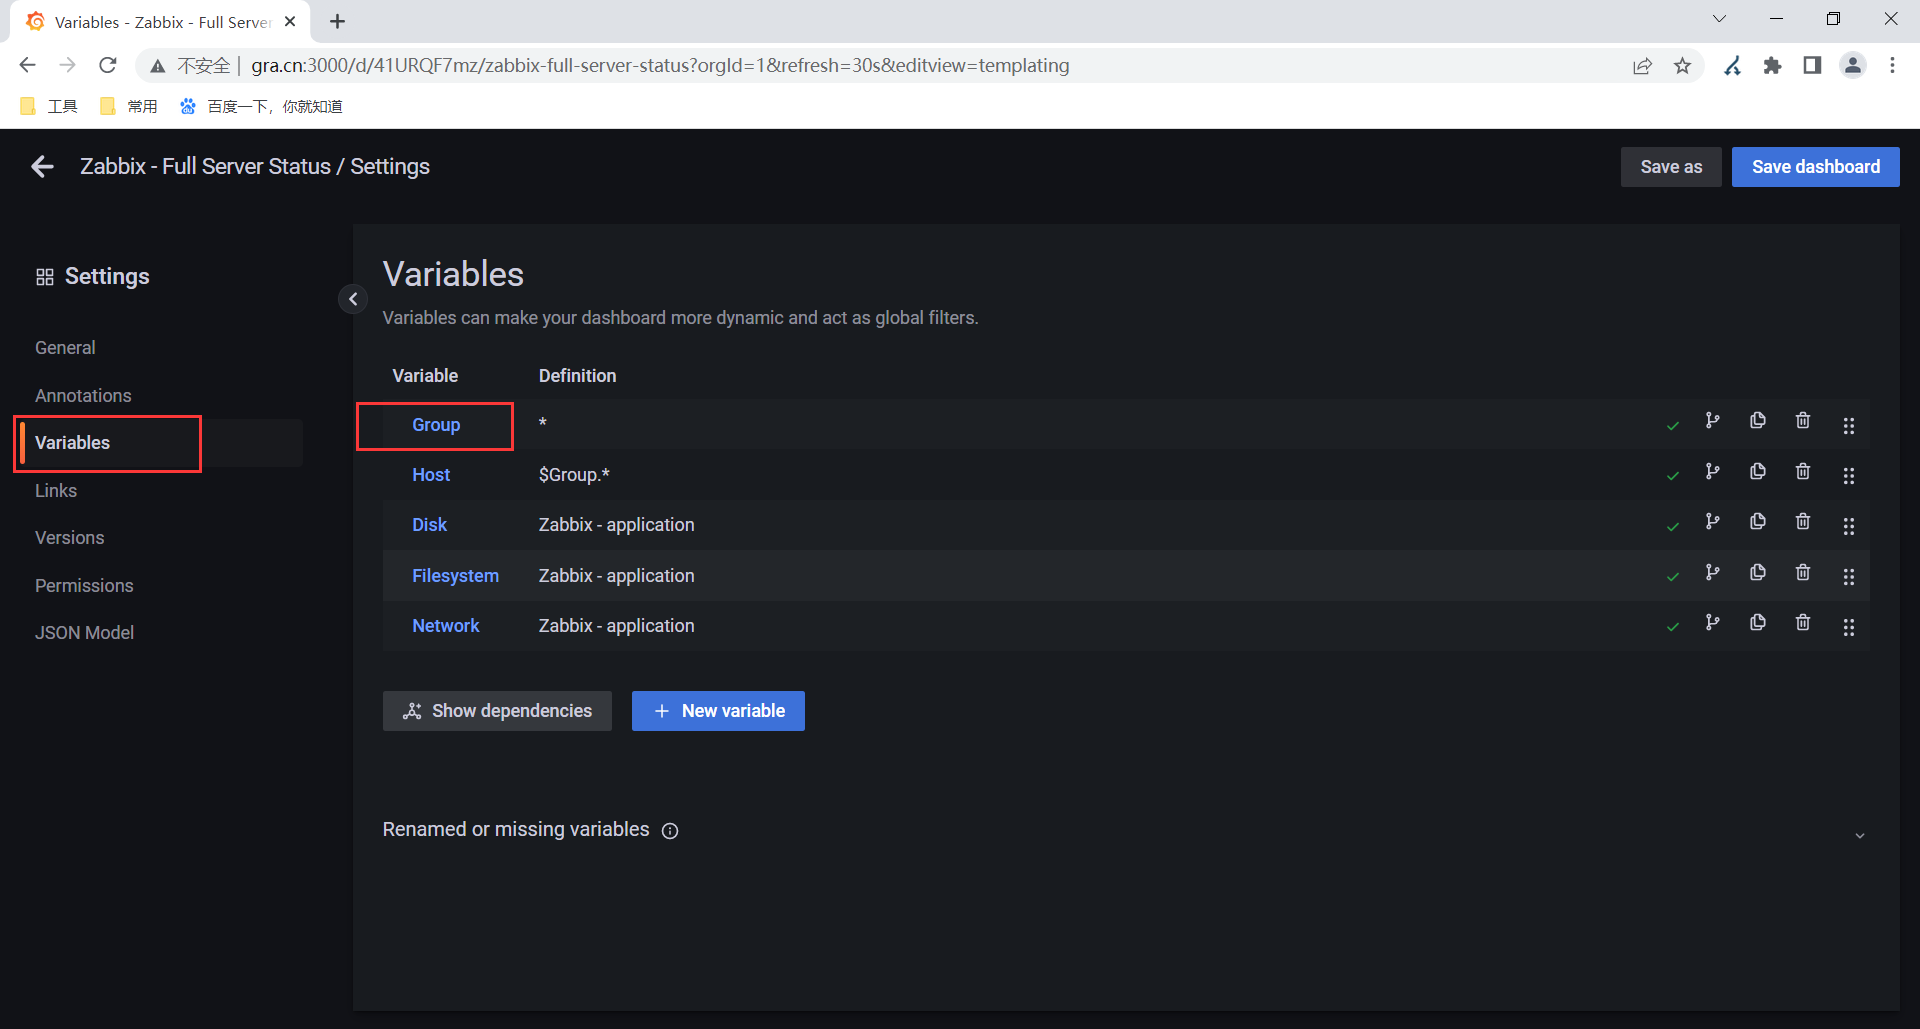
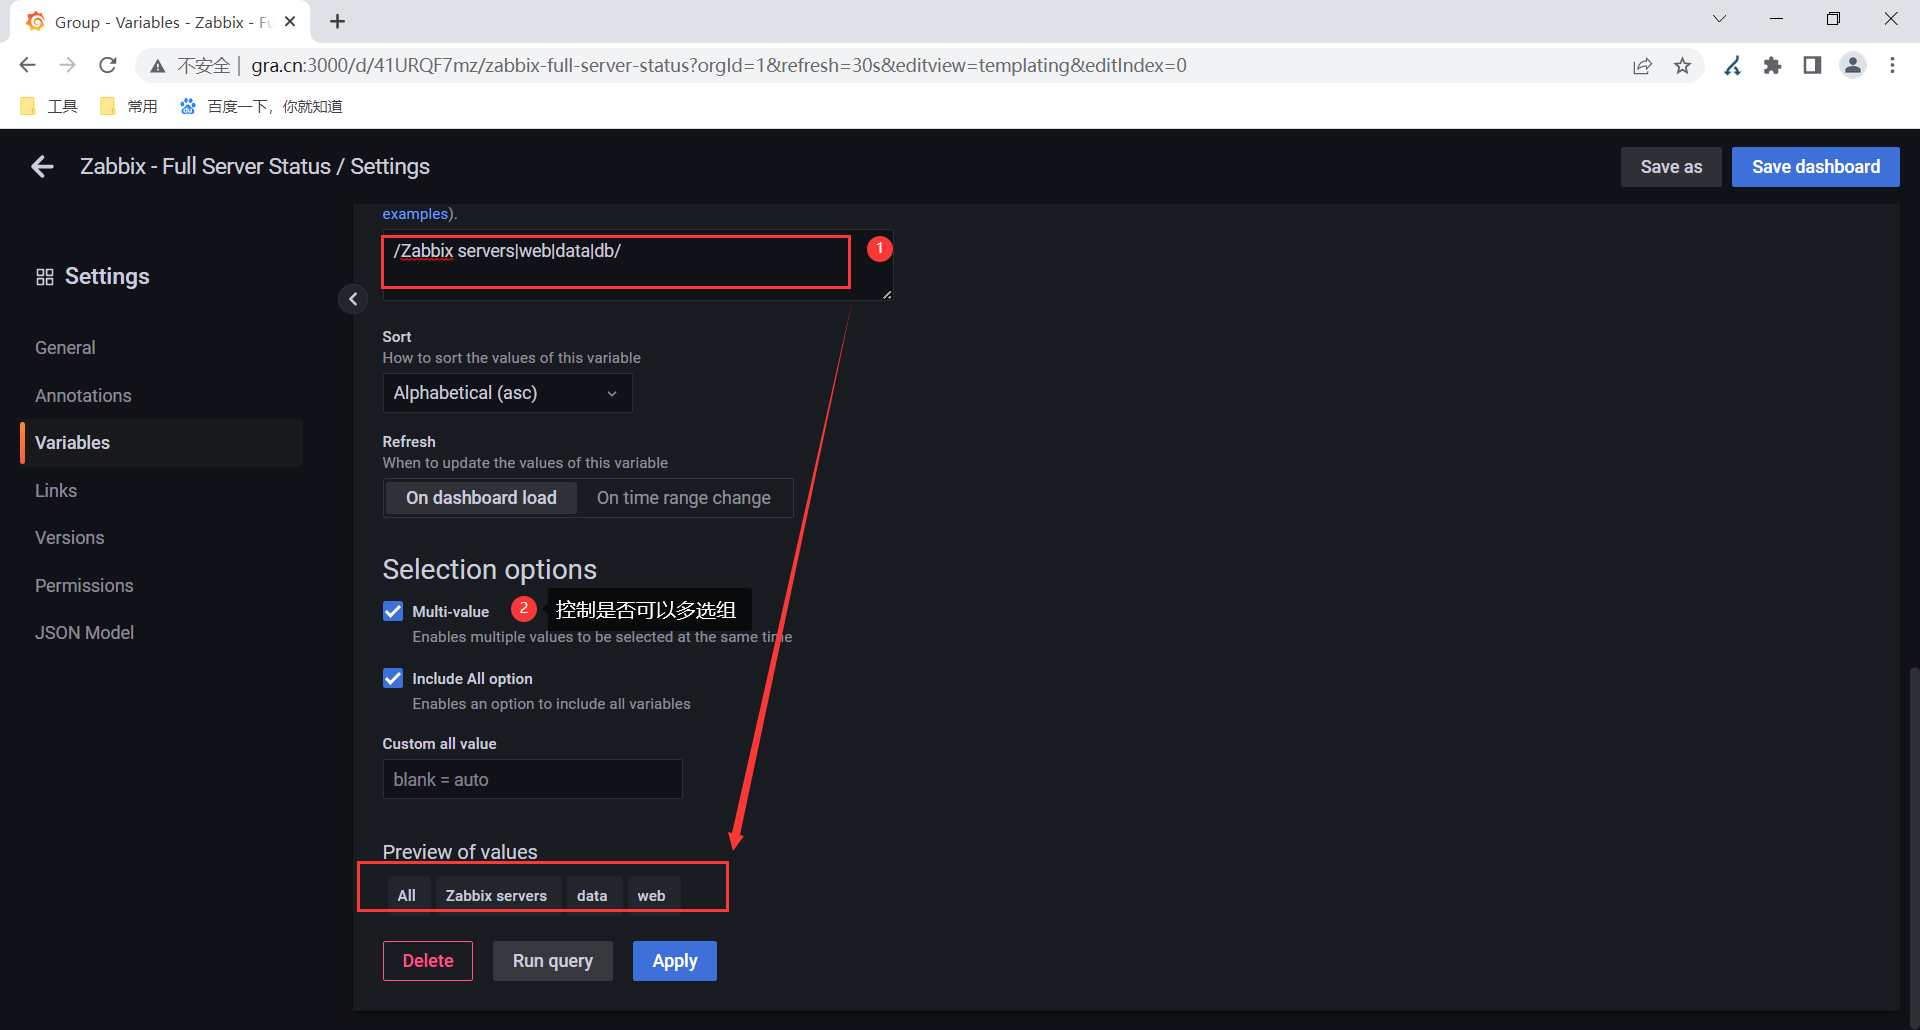
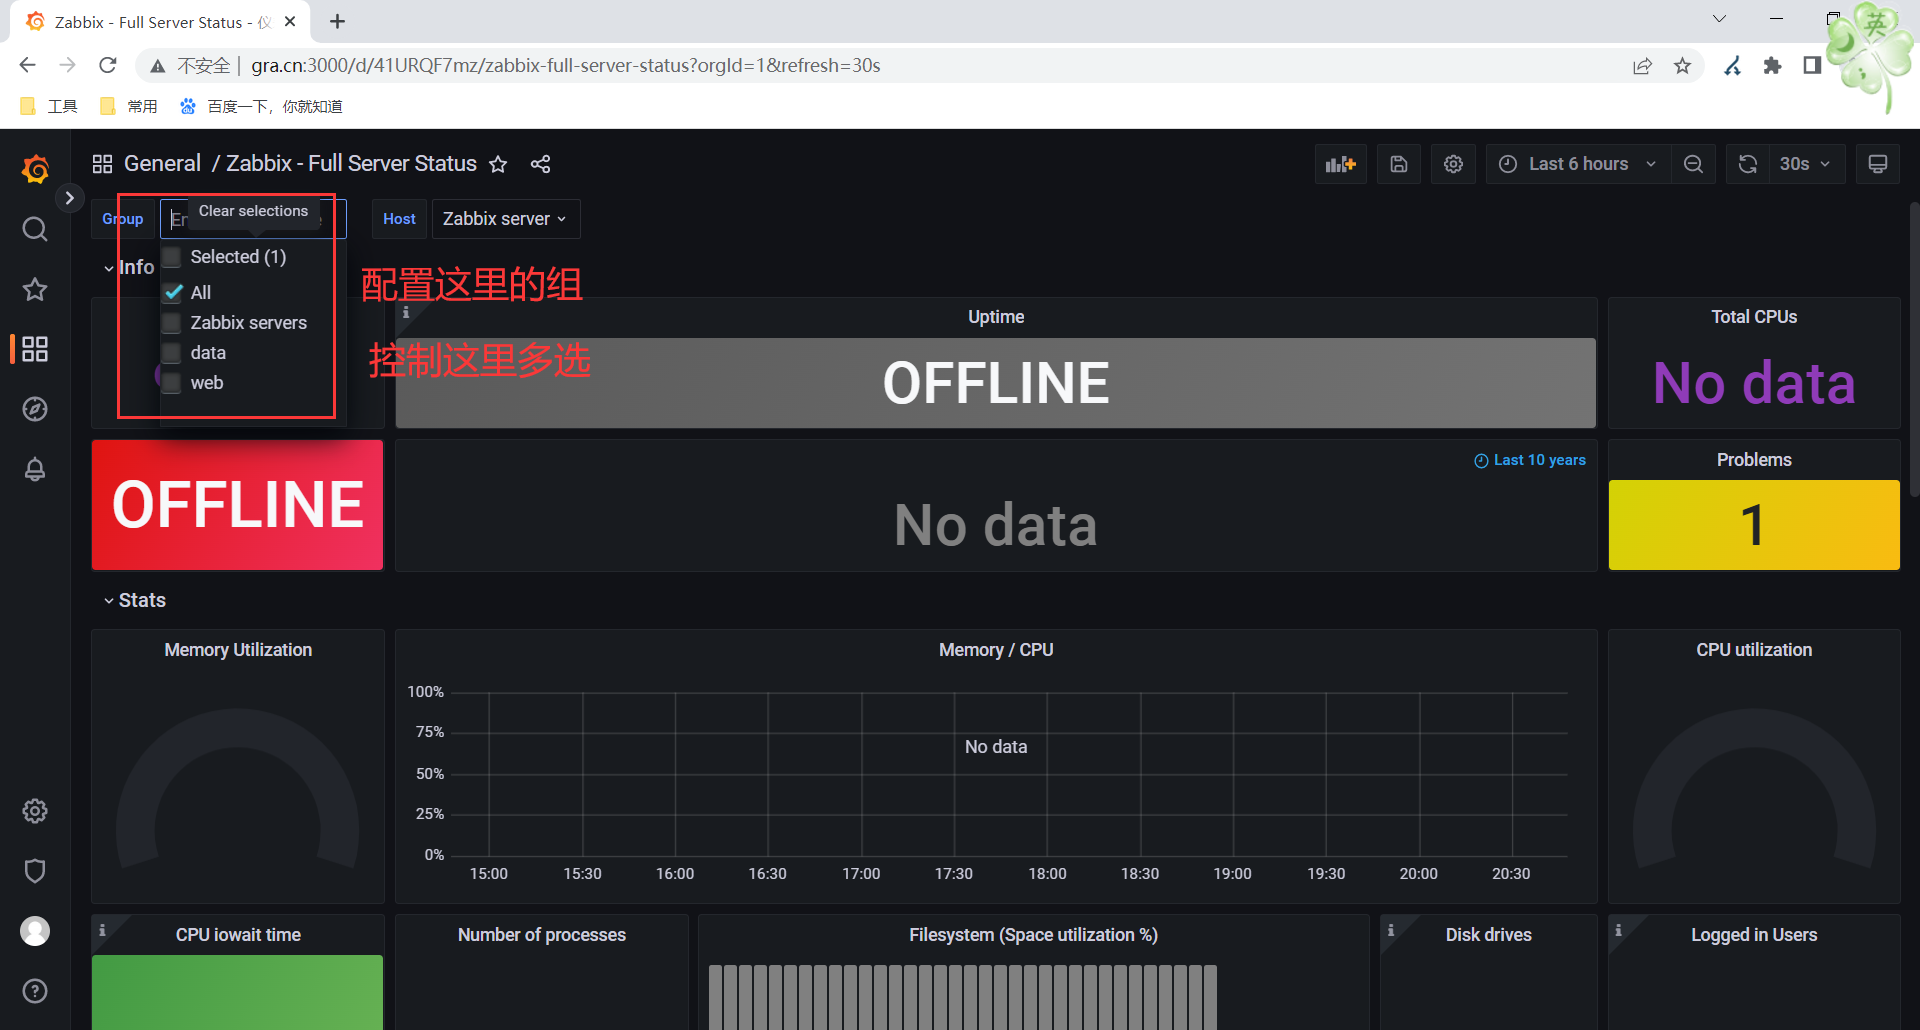
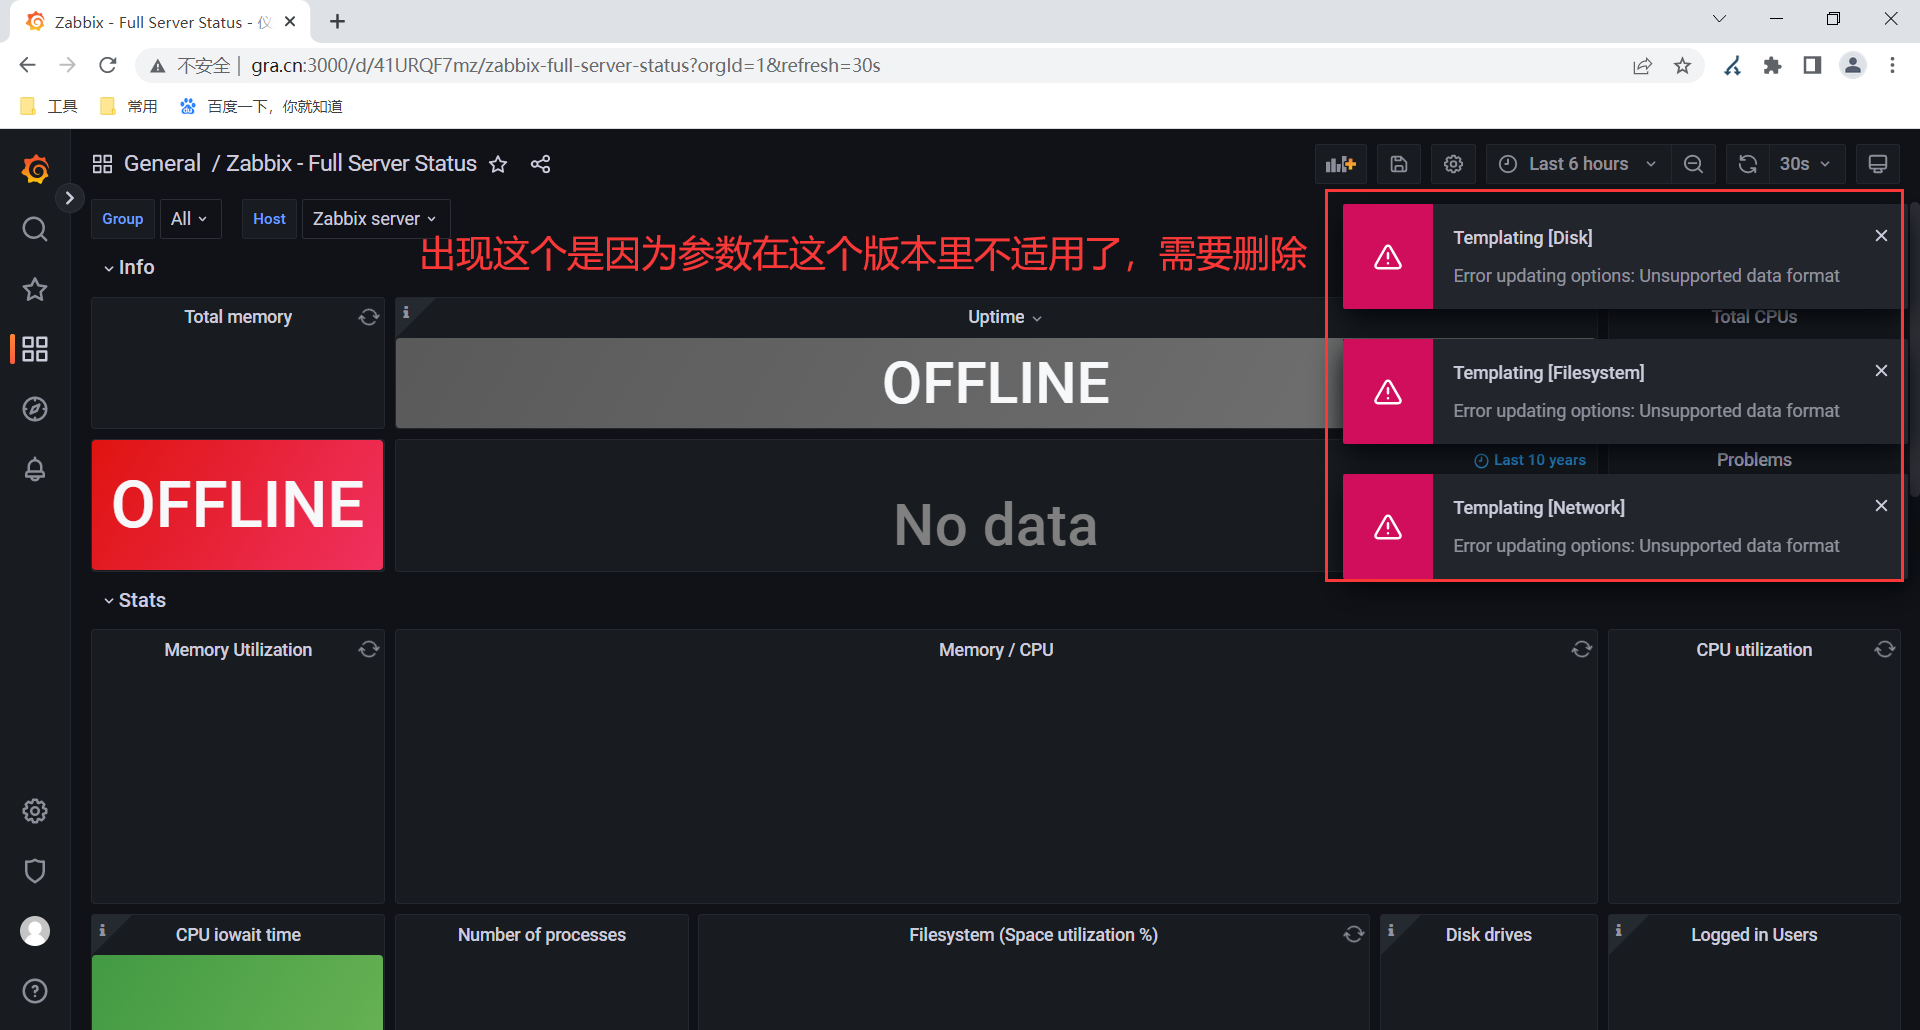
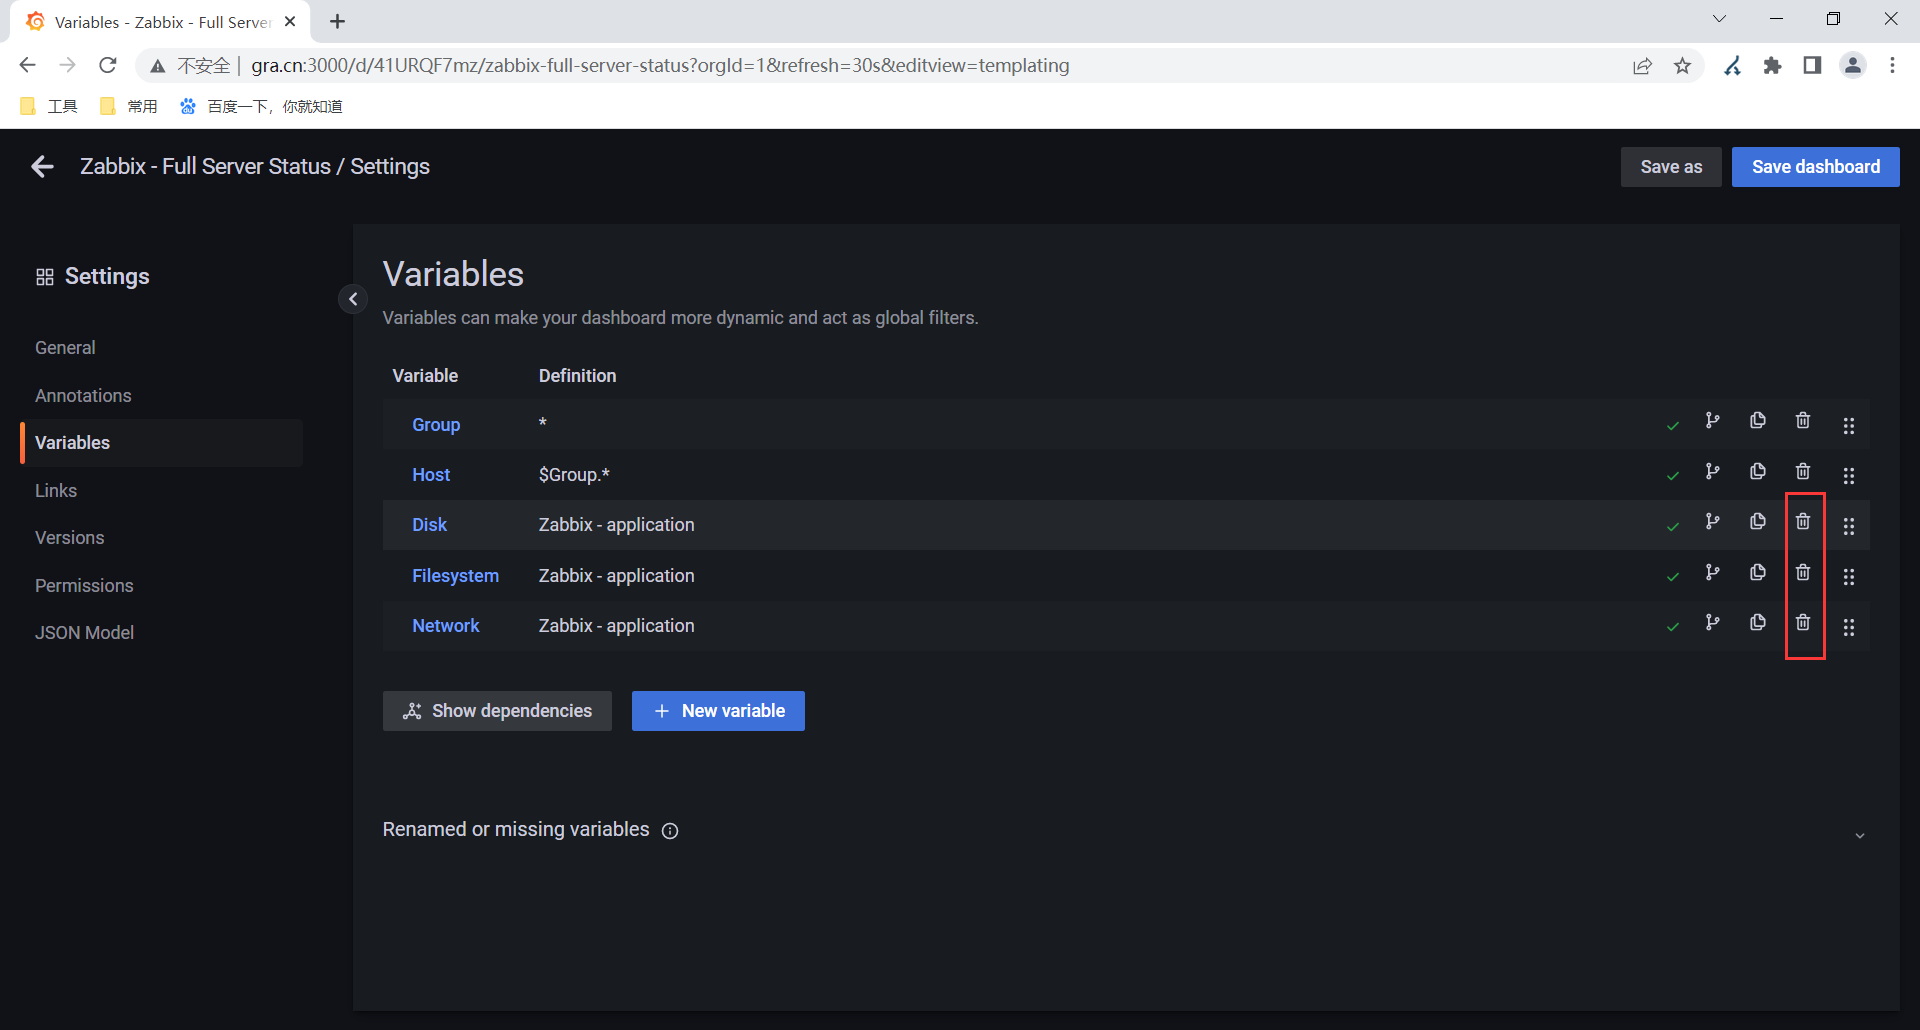
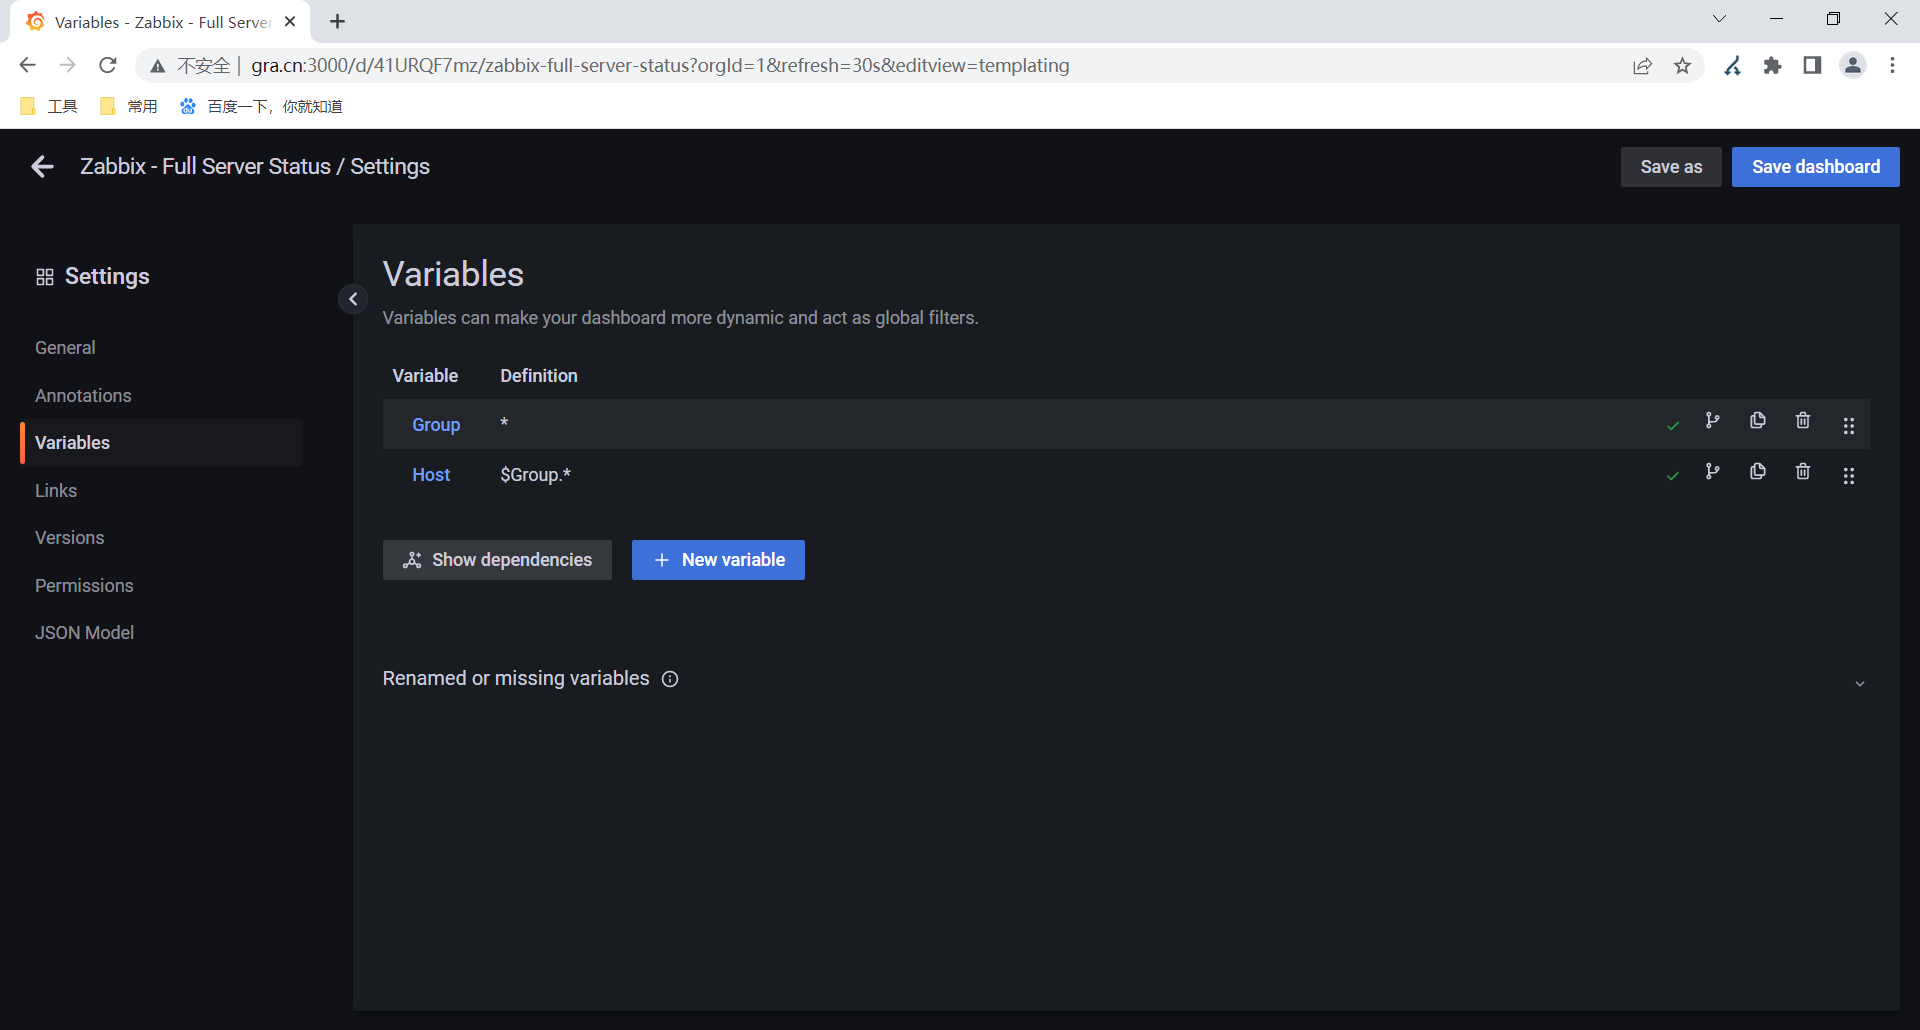
3.grafana仪表盘中变量的设置与修改
本文作者:wh459086748
本文链接:https://www.cnblogs.com/world-of-yuan/p/17248056.html
版权声明:本作品采用知识共享署名-非商业性使用-禁止演绎 2.5 中国大陆许可协议进行许可。
分类:
Linux


【推荐】国内首个AI IDE,深度理解中文开发场景,立即下载体验Trae
【推荐】编程新体验,更懂你的AI,立即体验豆包MarsCode编程助手
【推荐】抖音旗下AI助手豆包,你的智能百科全书,全免费不限次数
【推荐】轻量又高性能的 SSH 工具 IShell:AI 加持,快人一步
· 震惊!C++程序真的从main开始吗?99%的程序员都答错了
· 【硬核科普】Trae如何「偷看」你的代码?零基础破解AI编程运行原理
· 单元测试从入门到精通
· 上周热点回顾(3.3-3.9)
· winform 绘制太阳,地球,月球 运作规律