
极客时间运维进阶训练营第二十周作业
1、Prometheus 基于 consul 实现服务发现,并总结服务发现过程
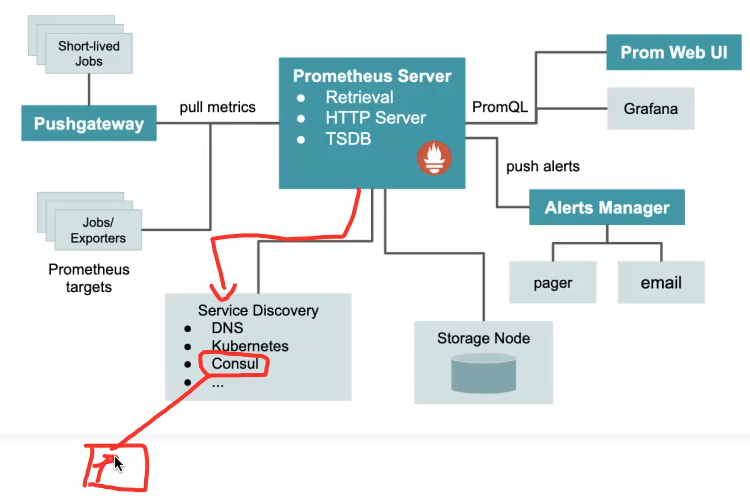
Prometheus 监听consul 注册内容 自动监控注册到consul中的服务信息
前提:服务需要提供prom能接收的指标数据接口
2、Prometheus 监控 JAVA 服务 (Tomcat)、Redis、MySQL、HAProxy
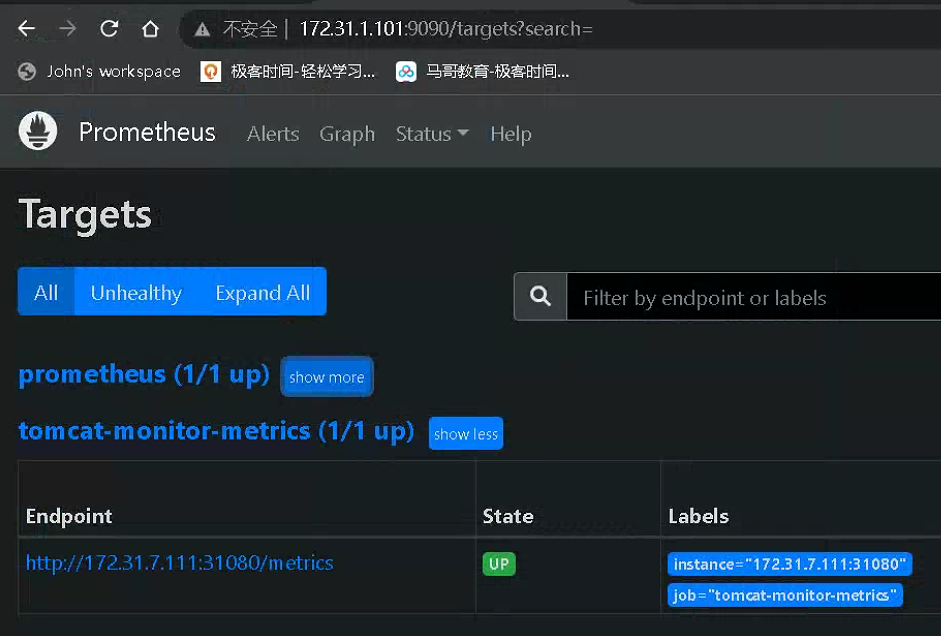
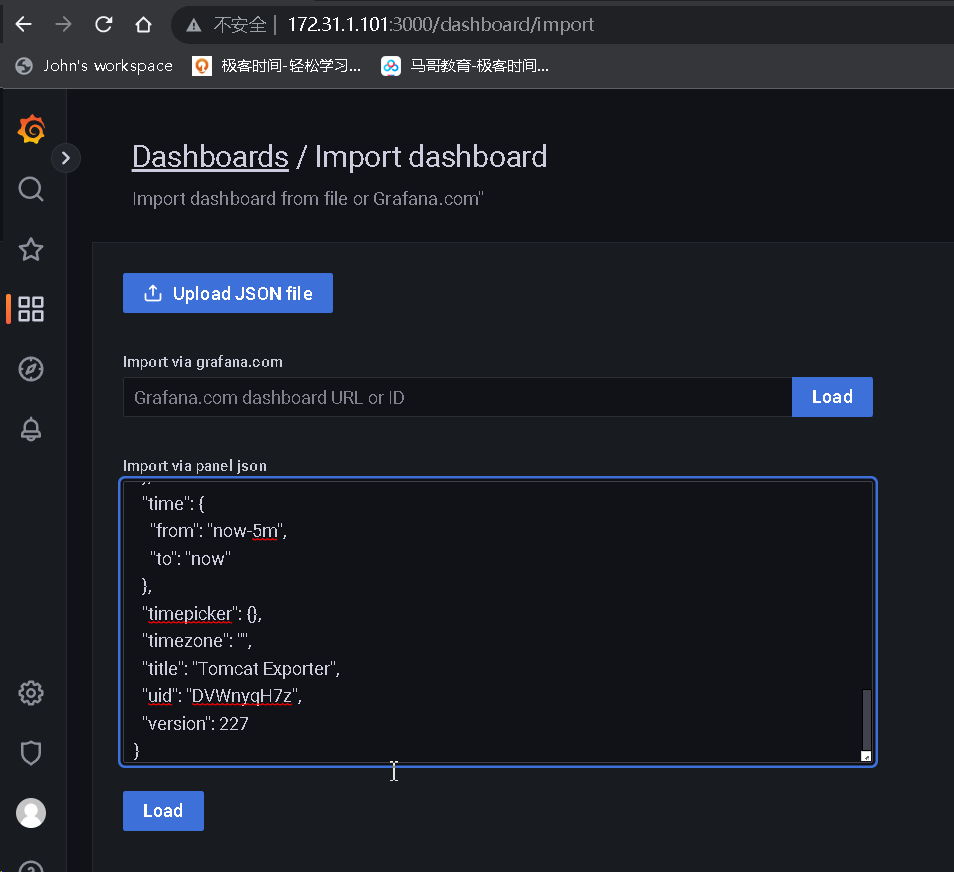
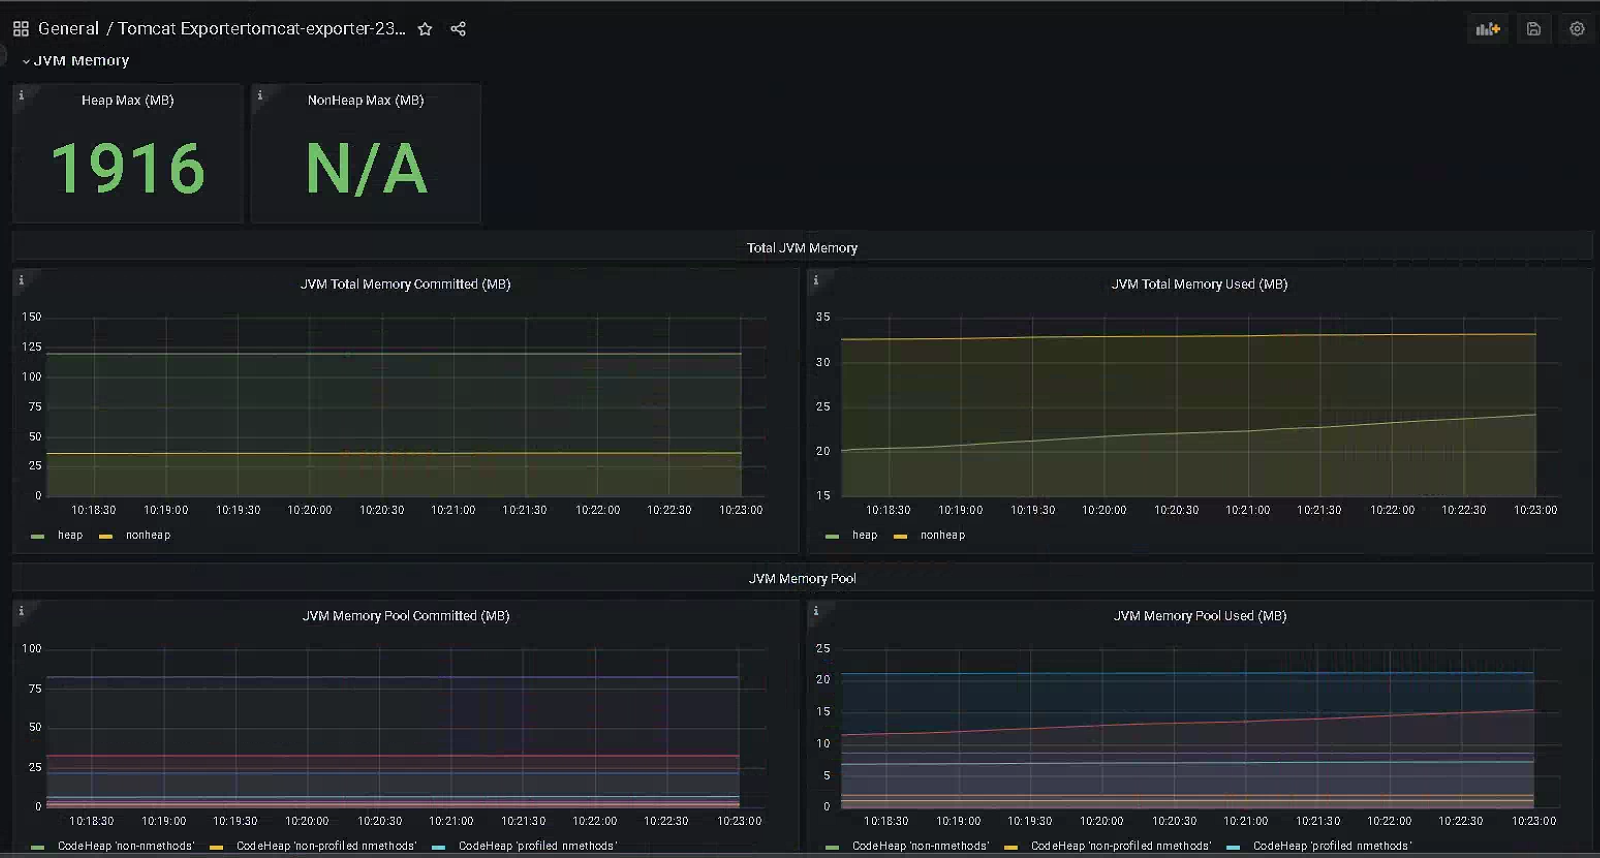
2.1 java tomcat


# 制作镜像 root@k8s-master1:~/day20/1.prometheus-case-files/app-monitor-case/1.tomcat/tomcat-image# cat server.xml <?xml version="1.0" encoding="UTF-8"?> <!-- Licensed to the Apache Software Foundation (ASF) under one or more contributor license agreements. See the NOTICE file distributed with this work for additional information regarding copyright ownership. The ASF licenses this file to You under the Apache License, Version 2.0 (the "License"); you may not use this file except in compliance with the License. You may obtain a copy of the License at http://www.apache.org/licenses/LICENSE-2.0 Unless required by applicable law or agreed to in writing, software distributed under the License is distributed on an "AS IS" BASIS, WITHOUT WARRANTIES OR CONDITIONS OF ANY KIND, either express or implied. See the License for the specific language governing permissions and limitations under the License. --> <!-- Note: A "Server" is not itself a "Container", so you may not define subcomponents such as "Valves" at this level. Documentation at /docs/config/server.html --> <Server port="8005" shutdown="SHUTDOWN"> <Listener className="org.apache.catalina.startup.VersionLoggerListener" /> <!-- Security listener. Documentation at /docs/config/listeners.html <Listener className="org.apache.catalina.security.SecurityListener" /> --> <!--APR library loader. Documentation at /docs/apr.html --> <Listener className="org.apache.catalina.core.AprLifecycleListener" SSLEngine="on" /> <!-- Prevent memory leaks due to use of particular java/javax APIs--> <Listener className="org.apache.catalina.core.JreMemoryLeakPreventionListener" /> <Listener className="org.apache.catalina.mbeans.GlobalResourcesLifecycleListener" /> <Listener className="org.apache.catalina.core.ThreadLocalLeakPreventionListener" /> <!-- Global JNDI resources Documentation at /docs/jndi-resources-howto.html --> <GlobalNamingResources> <!-- Editable user database that can also be used by UserDatabaseRealm to authenticate users --> <Resource name="UserDatabase" auth="Container" type="org.apache.catalina.UserDatabase" description="User database that can be updated and saved" factory="org.apache.catalina.users.MemoryUserDatabaseFactory" pathname="conf/tomcat-users.xml" /> </GlobalNamingResources> <!-- A "Service" is a collection of one or more "Connectors" that share a single "Container" Note: A "Service" is not itself a "Container", so you may not define subcomponents such as "Valves" at this level. Documentation at /docs/config/service.html --> <Service name="Catalina"> <!--The connectors can use a shared executor, you can define one or more named thread pools--> <!-- <Executor name="tomcatThreadPool" namePrefix="catalina-exec-" maxThreads="150" minSpareThreads="4"/> --> <!-- A "Connector" represents an endpoint by which requests are received and responses are returned. Documentation at : Java HTTP Connector: /docs/config/http.html Java AJP Connector: /docs/config/ajp.html APR (HTTP/AJP) Connector: /docs/apr.html Define a non-SSL/TLS HTTP/1.1 Connector on port 8080 --> <Connector port="8080" protocol="HTTP/1.1" connectionTimeout="20000" redirectPort="8443" /> <!-- A "Connector" using the shared thread pool--> <!-- <Connector executor="tomcatThreadPool" port="8080" protocol="HTTP/1.1" connectionTimeout="20000" redirectPort="8443" /> --> <!-- Define an SSL/TLS HTTP/1.1 Connector on port 8443 This connector uses the NIO implementation. The default SSLImplementation will depend on the presence of the APR/native library and the useOpenSSL attribute of the AprLifecycleListener. Either JSSE or OpenSSL style configuration may be used regardless of the SSLImplementation selected. JSSE style configuration is used below. --> <!-- <Connector port="8443" protocol="org.apache.coyote.http11.Http11NioProtocol" maxThreads="150" SSLEnabled="true"> <SSLHostConfig> <Certificate certificateKeystoreFile="conf/localhost-rsa.jks" type="RSA" /> </SSLHostConfig> </Connector> --> <!-- Define an SSL/TLS HTTP/1.1 Connector on port 8443 with HTTP/2 This connector uses the APR/native implementation which always uses OpenSSL for TLS. Either JSSE or OpenSSL style configuration may be used. OpenSSL style configuration is used below. --> <!-- <Connector port="8443" protocol="org.apache.coyote.http11.Http11AprProtocol" maxThreads="150" SSLEnabled="true" > <UpgradeProtocol className="org.apache.coyote.http2.Http2Protocol" /> <SSLHostConfig> <Certificate certificateKeyFile="conf/localhost-rsa-key.pem" certificateFile="conf/localhost-rsa-cert.pem" certificateChainFile="conf/localhost-rsa-chain.pem" type="RSA" /> </SSLHostConfig> </Connector> --> <!-- Define an AJP 1.3 Connector on port 8009 --> <!-- <Connector protocol="AJP/1.3" address="::1" port="8009" redirectPort="8443" /> --> <!-- An Engine represents the entry point (within Catalina) that processes every request. The Engine implementation for Tomcat stand alone analyzes the HTTP headers included with the request, and passes them on to the appropriate Host (virtual host). Documentation at /docs/config/engine.html --> <!-- You should set jvmRoute to support load-balancing via AJP ie : <Engine name="Catalina" defaultHost="localhost" jvmRoute="jvm1"> --> <Engine name="Catalina" defaultHost="localhost"> <!--For clustering, please take a look at documentation at: /docs/cluster-howto.html (simple how to) /docs/config/cluster.html (reference documentation) --> <!-- <Cluster className="org.apache.catalina.ha.tcp.SimpleTcpCluster"/> --> <!-- Use the LockOutRealm to prevent attempts to guess user passwords via a brute-force attack --> <Realm className="org.apache.catalina.realm.LockOutRealm"> <!-- This Realm uses the UserDatabase configured in the global JNDI resources under the key "UserDatabase". Any edits that are performed against this UserDatabase are immediately available for use by the Realm. --> <Realm className="org.apache.catalina.realm.UserDatabaseRealm" resourceName="UserDatabase"/> </Realm> <Host name="localhost" appBase="/data/tomcat/webapps" unpackWARs="false" autoDeploy="false"> <!-- SingleSignOn valve, share authentication between web applications Documentation at: /docs/config/valve.html --> <!-- <Valve className="org.apache.catalina.authenticator.SingleSignOn" /> --> <!-- Access log processes all example. Documentation at: /docs/config/valve.html Note: The pattern used is equivalent to using pattern="common" --> <Valve className="org.apache.catalina.valves.AccessLogValve" directory="logs" prefix="localhost_access_log" suffix=".txt" pattern="%h %l %u %t "%r" %s %b" /> </Host> </Engine> </Service> </Server> root@k8s-master1:~/day20/1.prometheus-case-files/app-monitor-case/1.tomcat/tomcat-image# # <Host name="localhost" appBase="/data/tomcat/webapps" unpackWARs="false" autoDeploy="false"> 中appbase 定义了app root@k8s-master1:~/day20/1.prometheus-case-files/app-monitor-case/1.tomcat/tomcat-image# cat Dockerfile #FROM tomcat:8.5.73-jdk11-corretto FROM tomcat:8.5.73 LABEL maintainer="jack 2973707860@qq.com" ADD server.xml /usr/local/tomcat/conf/server.xml RUN mkdir /data/tomcat/webapps -p ADD myapp /data/tomcat/webapps/myapp ADD metrics.war /data/tomcat/webapps # 如果是其他环境需要将如下jar包放到lib环境中 ADD simpleclient-0.8.0.jar /usr/local/tomcat/lib/ ADD simpleclient_common-0.8.0.jar /usr/local/tomcat/lib/ ADD simpleclient_hotspot-0.8.0.jar /usr/local/tomcat/lib/ ADD simpleclient_servlet-0.8.0.jar /usr/local/tomcat/lib/ ADD tomcat_exporter_client-0.0.12.jar /usr/local/tomcat/lib/ #ADD run_tomcat.sh /apps/tomcat/bin/ EXPOSE 8080 8443 8009 #CMD ["/apps/tomcat/bin/catalina.sh","run"] # 使用了官方镜像,因此无需启动 #CMD ["/apps/tomcat/bin/run_tomcat.sh"] # # 使用了官方镜像,因此无需启动 root@k8s-master1:~/day20/1.prometheus-case-files/app-monitor-case/1.tomcat/tomcat-image# cat myapp/index.jsp <h1>tomcat app1</h1> root@k8s-master1:~/day20/1.prometheus-case-files/app-monitor-case/1.tomcat/tomcat-image# root@k8s-master1:~/day20/1.prometheus-case-files/app-monitor-case/1.tomcat/tomcat-image# cat run_tomcat.sh #!/bin/bash echo "1.1.1.1 www.a.com" >> /etc/hosts su - magedu -c "/apps/tomcat/bin/catalina.sh start" tail -f /etc/hosts root@k8s-master1:~/day20/1.prometheus-case-files/app-monitor-case/1.tomcat/tomcat-image# cat build-command.sh #!/bin/bash #nerdctl build -t harbor.magedu.net/magedu/tomcat-app1:v1 . #nerdctl push harbor.magedu.net/magedu/tomcat-app1:v1 docker build -t harbor.iclinux.com/magedu/tomcat-app1:v1 . docker push harbor.iclinux.com/magedu/tomcat-app1:v1 root@k8s-master1:~/day20/1.prometheus-case-files/app-monitor-case/1.tomcat/tomcat-image# ./build-command.sh # 测试镜像 root@k8s-master1:~/day20/1.prometheus-case-files/app-monitor-case/1.tomcat/tomcat-image# docker run -ti --rm -p 8081:8080 harbor.iclinux.com/magedu/tomcat-app1:v1 root@prometheus-server01:/apps/prometheus/file_sd# curl http://172.31.7.101:8081/myapp/index.jsp <h1>tomcat app1</h1> # 检查指标数据 root@prometheus-server01:/apps/prometheus/file_sd# curl http://172.31.7.101:8081/myapp/metrics <!doctype html><html lang="en"><head><title>HTTP Status 404 – Not Found</title><style type="text" # 清理一些pod root@k8s-master1:~/day20/1.prometheus-case-files# kubectl delete -f . # 部署tomcat root@k8s-master1:~/day20/1.prometheus-case-files/app-monitor-case/1.tomcat/yaml# cat tomcat-deploy.yaml apiVersion: apps/v1 kind: Deployment metadata: name: tomcat-deployment namespace: default spec: selector: matchLabels: app: tomcat replicas: 1 # tells deployment to run 2 pods matching the template template: # create pods using pod definition in this template metadata: labels: app: tomcat annotations: prometheus.io/scrape: 'true' prometheus.io/port: "8080" spec: containers: - name: tomcat image: harbor.iclinux.com/magedu/tomcat-app1:v1 imagePullPolicy: Always ports: - containerPort: 8080 securityContext: privileged: true root@k8s-master1:~/day20/1.prometheus-case-files/app-monitor-case/1.tomcat/yaml# cat tomcat-svc.yaml kind: Service #service 类型 apiVersion: v1 metadata: annotations: prometheus.io/scrape: 'true' prometheus.io/port: "8080" name: tomcat-service spec: selector: app: tomcat ports: - nodePort: 31080 port: 80 protocol: TCP targetPort: 8080 type: NodePort root@k8s-master1:~/day20/1.prometheus-case-files/app-monitor-case/1.tomcat/yaml# kubectl apply -f tomcat-deploy.yaml -f tomcat-svc.yaml deployment.apps/tomcat-deployment created service/tomcat-service created root@k8s-master1:~/day20/1.prometheus-case-files/app-monitor-case/1.tomcat/yaml# curl http://172.31.7.111:31080/myapp/ <h1>tomcat app1</h1> root@k8s-master1:~/day20/1.prometheus-case-files/app-monitor-case/1.tomcat/yaml# curl http://172.31.7.111:31080/metrics/ # HELP tomcat_session_active_total Number of active sessions # TYPE tomcat_session_active_total gauge # prome 配置指标发现 - job_name: "tomcat-monitor-metrics" static_configs: - targets: ["172.31.7.111:31080"]
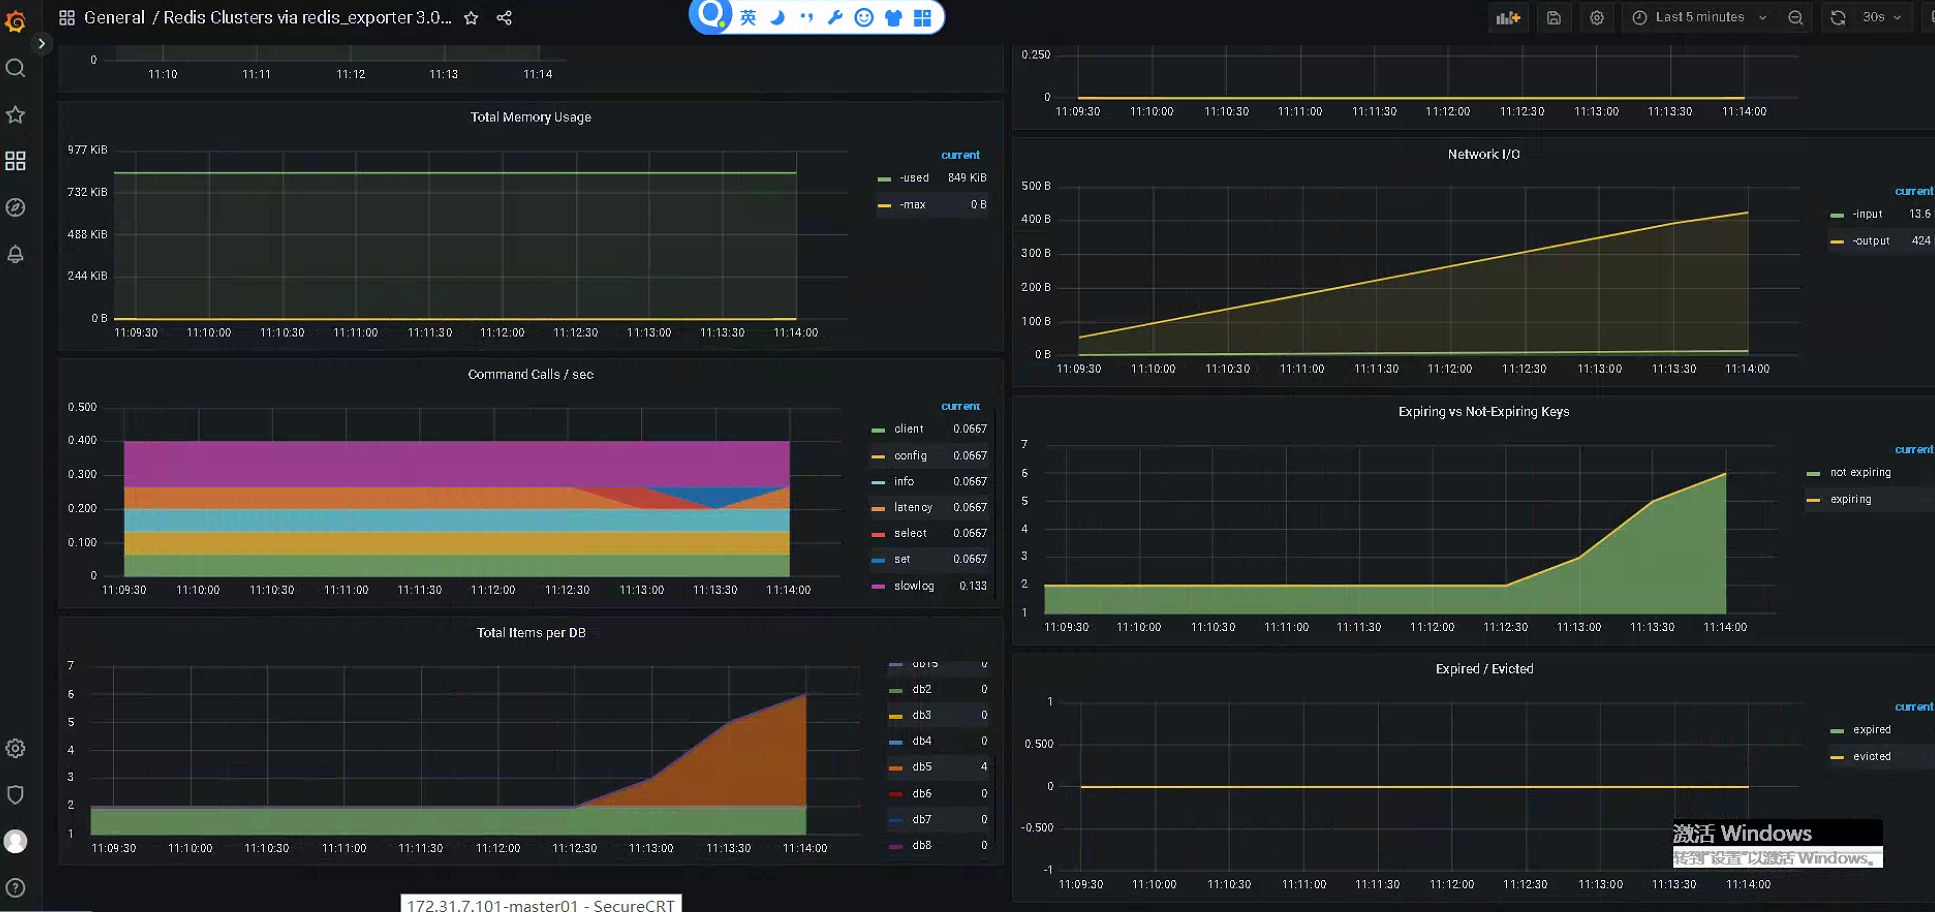
2.2 redis
root@k8s-master1:~/day20/1.prometheus-case-files/app-monitor-case/2.redis/yaml# cat redis-deployment.yaml
apiVersion: apps/v1
kind: Deployment
metadata:
  name: redis
  namespace: magedu
spec:
  replicas: 1
  selector:
    matchLabels:
      app: redis
  template:
    metadata:
      labels:
        app: redis
    spec:
      containers:
      - name: redis
        image: redis:4.0.14
        resources:
          requests:
            cpu: 200m
            memory: 156Mi
        ports:
        - containerPort: 6379
      - name: redis-exporter
        image: oliver006/redis_exporter:latest
        resources:
          requests:
            cpu: 100m
            memory: 128Mi
        ports:
        - containerPort: 9121

root@k8s-master1:~/day20/1.prometheus-case-files/app-monitor-case/2.redis/yaml# cat redis-exporter-svc.yaml
kind: Service  #service 类型
apiVersion: v1
metadata:
  annotations:
    prometheus.io/scrape: 'true'
    prometheus.io/port: "9121"
  name: redis-exporter-service
  namespace: magedu
spec:
  selector:
    app: redis
  ports:
  - nodePort: 31082
    name: prom
    port: 9121
    protocol: TCP
    targetPort: 9121
  type: NodePort
root@k8s-master1:~/day20/1.prometheus-case-files/app-monitor-case/2.redis/yaml# cat redis-redis-svc.yaml
kind: Service  #service 类型
apiVersion: v1
metadata:
#  annotations:
#    prometheus.io/scrape: 'false'
  name: redis-redis-service
  namespace: magedu
spec:
  selector:
    app: redis
  ports:
  - nodePort: 31081
    name: redis
    port: 6379
    protocol: TCP
    targetPort: 6379
  type: NodePort

root@k8s-master1:~/day20/1.prometheus-case-files/app-monitor-case/2.redis/yaml# kubectl  apply -f redis-deployment.yaml -f redis-exporter-svc.yaml -f  redis-redis-svc.yaml
deployment.apps/redis created
service/redis-exporter-service created
service/redis-redis-service created

# 验证redis

root@k8s-master1:~/day20/1.prometheus-case-files/app-monitor-case/2.redis/yaml# apt install -y redis-server

root@k8s-master1:~/day20/1.prometheus-case-files/app-monitor-case/2.redis/yaml# redis-cli  -h 172.31.7.111 -p 31081
172.31.7.111:31081> info
# Server
redis_version:4.0.14
redis_git_sha1:00000000
redis_git_dirty:0
redis_build_id:165c932261a105d7
redis_mode:standalone

172.31.7.111:31081> set k1 v1
OK
172.31.7.111:31081> get k1
"v1"
172.31.7.111:31081> SELECT 2
OK
172.31.7.111:31081[2]> SELECT 1
OK
172.31.7.111:31081[1]>

172.31.7.111:31081[1]> SELECT 0
OK
172.31.7.111:31081> KEYS *
1) "k2"
2) "k1"

172.31.7.111:31081> SELECT 5
OK
172.31.7.111:31081[5]> set k1 v1
OK
172.31.7.111:31081[5]> set k2 v2
OK
172.31.7.111:31081[5]> set k2 v3
OK
172.31.7.111:31081[5]> set k3 v3
OK
172.31.7.111:31081[5]> set k4 v4
OK

172.31.7.111:31081[5]> KEYS *
1) "k2"
2) "k1"
3) "k4"
4) "k3"

root@k8s-master1:~# curl http://172.31.7.111:31082
<html>
<head><title>Redis Exporter v1.33.0</title></head>
<body>
<h1>Redis Exporter v1.33.0</h1>
<p><a href='/metrics'>Metrics</a></p>
</body>
</html>
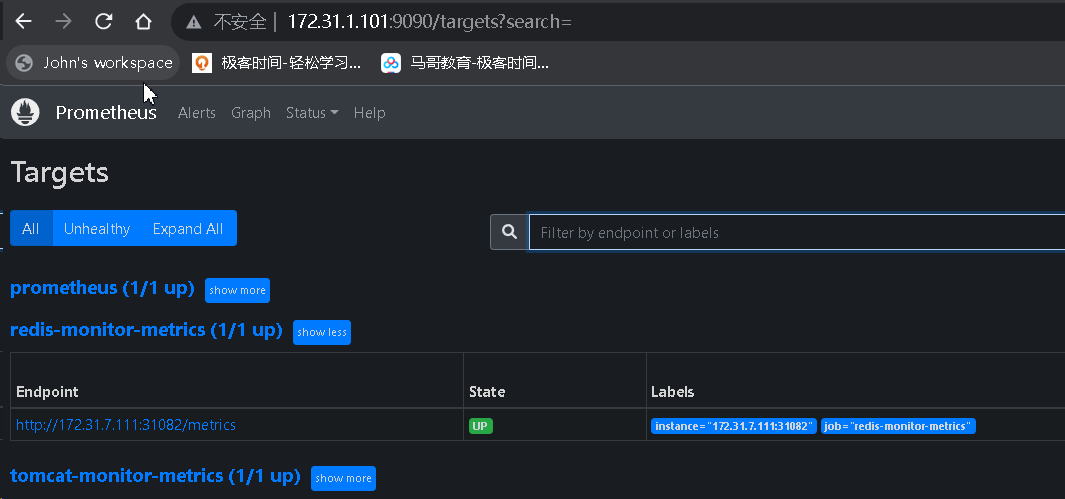
  - job_name: "redis-monitor-metrics"
    static_configs:
     - targets: ["172.31.7.111:31082"]
2.3 mysql
# 安装mysql
root@prometheus-server02:~# apt install -y mariadb-server
cp /etc/mysql/mariadb.conf.d/50-server.cnf{,.bak}
sed -i s'/127.0.0.1/0.0.0.0/g' /etc/mysql/mariadb.conf.d/50-server.cnf
systemctl  restart mysql

# 创建账号
mysql
 CREATE USER 'mysql_exporter'@'localhost' IDENTIFIED BY 'imnot007*';
GRANT PROCESS, REPLICATION CLIENT, SELECT ON *.* TO 'mysql_exporter'@'localhost';

# 验证
mysql -umysql_exporter -pimnot007* -hlocalhost

# 现在安装exporter
root@prometheus-server02:~# cd /usr/local/src/

root@prometheus-server02:/usr/local/src# wget https://github.com/prometheus/mysqld_exporter/releases/download/v0.14.0/mysqld_exporter-0.14.0.linux-amd64.tar.gz

root@prometheus-server02:/usr/local/src# tar xf mysqld_exporter-0.14.0.linux-amd64.tar.gz
root@prometheus-server02:/usr/local/src# cp  mysqld_exporter-0.14.0.linux-amd64/mysqld_exporter  /usr/local/bin/

tee /root/.my.cnf << "EOF"
[client]
user=mysql_exporter
password=imnot007*
EOF

tee /etc/systemd/system/mysqld_exporter.service << "EOF"
[Unit]
Description=Prometheus Node Exporter
After=network.target
[Service]
ExecStart=/usr/local/bin/mysqld_exporter --config.my-cnf=/root/.my.cnf
[Install]
WantedBy=multi-user.target

EOF

systemctl daemon-reload && systemctl restart mysqld_exporter && systemctl enable mysqld_exporter


root@prometheus-server02:/usr/local/src# curl  http://172.31.1.102:9104/metrics
# TYPE go_gc_cycles_automatic_gc_cycles_total counter
go_gc_cycles_automatic_gc_cycles_total 1
# HELP go_gc_cycles_forced_gc_cycles_total Count of completed GC cycles forced by the application.
# TYPE go_gc_cycles_forced_gc_cycles_total counter
go_gc_cycles_forced_gc_cycles_total 0
# HELP go_gc_cycles_total_gc_cycles_total Count of all completed GC cycles.
# TYPE go_gc_cycles_total_gc_cycles_total counter
go_gc_cycles_total_gc_cycles_total 1
# HELP go_gc_duration_seconds A summary of the pause duration of garbage collection cycles.
100 24354    0 24354    0     0  1796k      0 --:--:-- --:--:-- --:--:-- 1829k
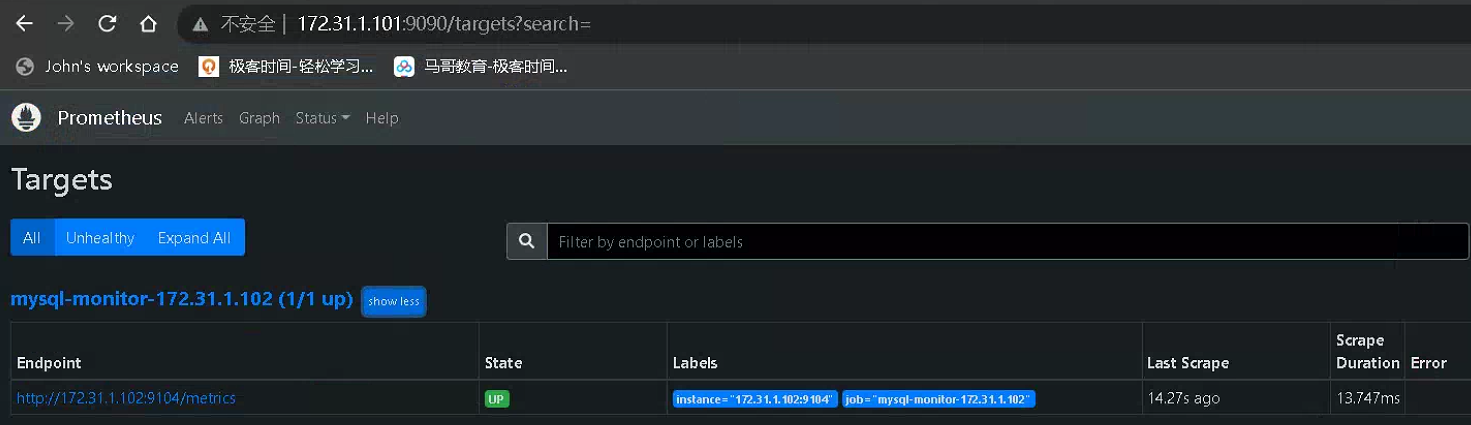
  - job_name: mysql-monitor-172.31.1.102
    static_configs:
      - targets: ['172.31.1.102:9104']

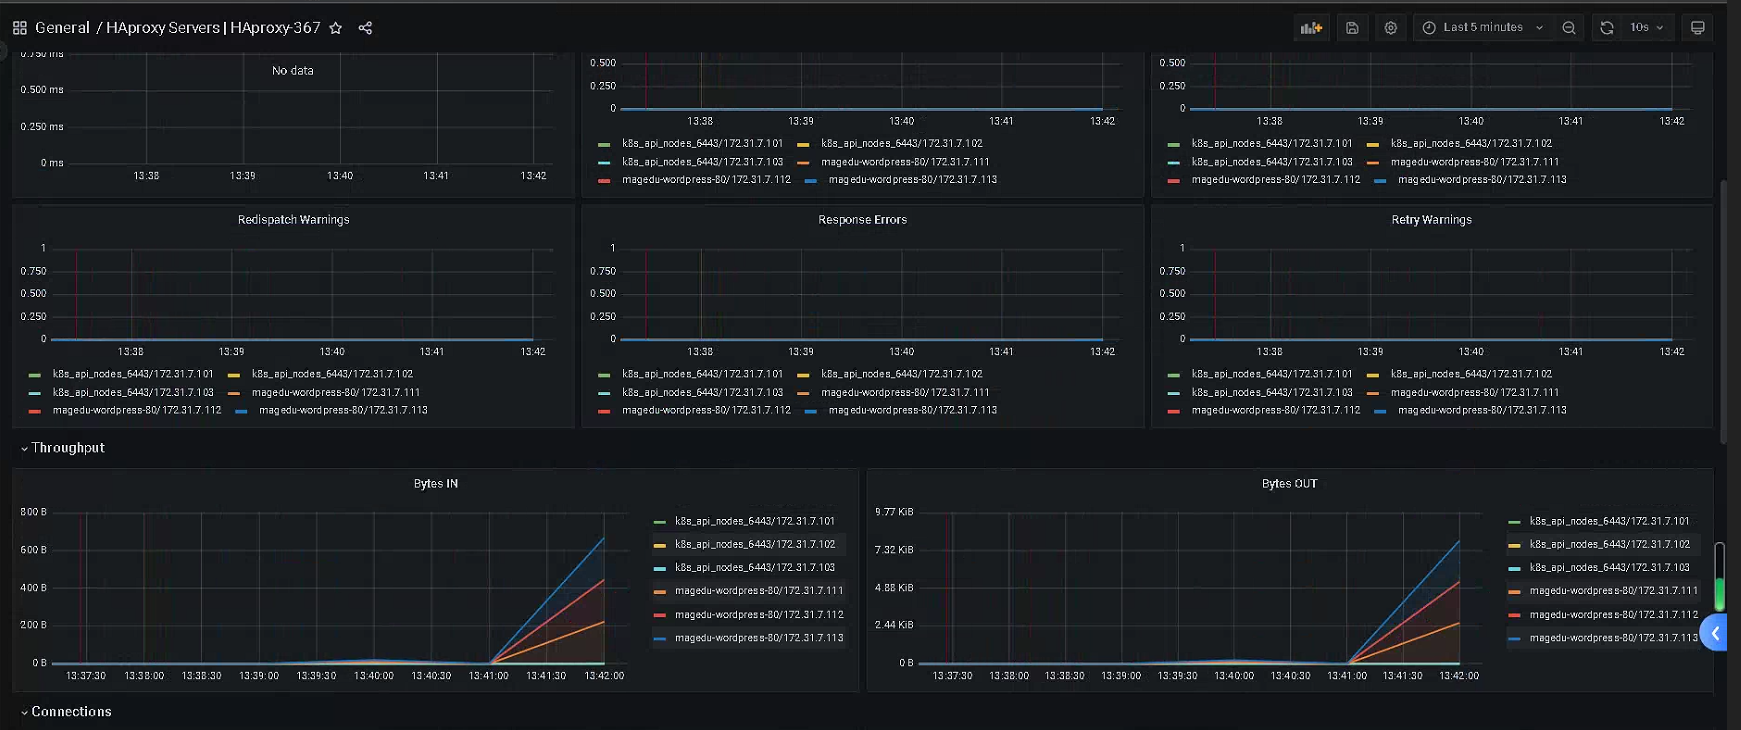
2.4 HA proxy
tee -a /etc/haproxy/haproxy.cfg << "EOF"
listen stats
  bind :8899
  stats enable
  #stats hide-version
  stats uri /haproxy-status
  stats realm HAPorxy\ Stats\ Page
  stats auth haadmin:123456
  stats auth admin:123456
EOF
systemctl  reload haproxy

root@k8s-ha1:~# curl 172.31.7.109:8899/haproxy-status
<html><body><h1>401 Unauthorized</h1>
You need a valid user and password to access this content.
</body></html>
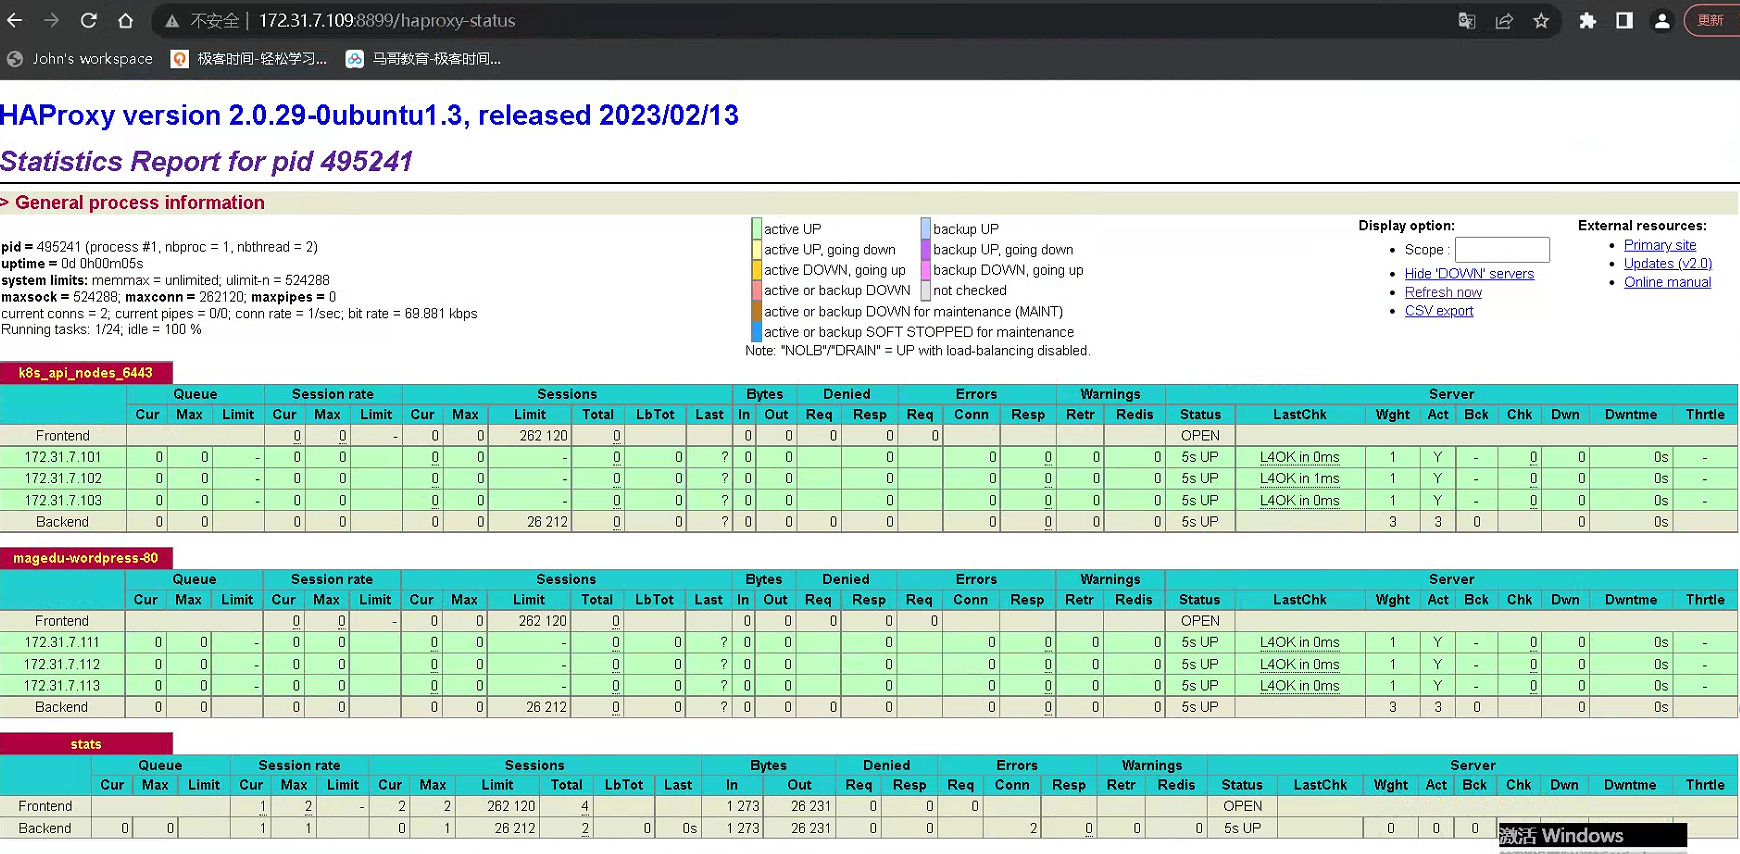
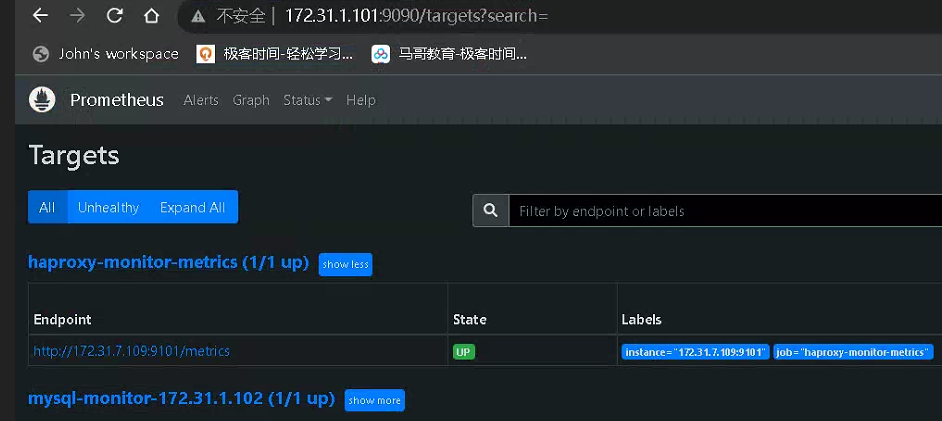
# 部署exporter
root@k8s-ha1:/usr/local/src# tar xf haproxy_exporter-0.15.0.linux-amd64.tar.gz
root@k8s-ha1:/usr/local/src# mv haproxy_exporter-0.15.0.linux-amd64/haproxy_exporter  /usr/local/bin/
root@k8s-ha1:/usr/local/src# haproxy_exporter --haproxy.scrape-uri=unix:/run/haproxy/admin.sock &
#另一种方式: haproxy_exporter  --haproxy.scrape-uri="http://haadmin:123456@172.0.0.1/haproxy-status;csv"

  - job_name: 'haproxy-monitor-metrics'
    static_configs:
    - targets: ['172.31.7.109:9101']
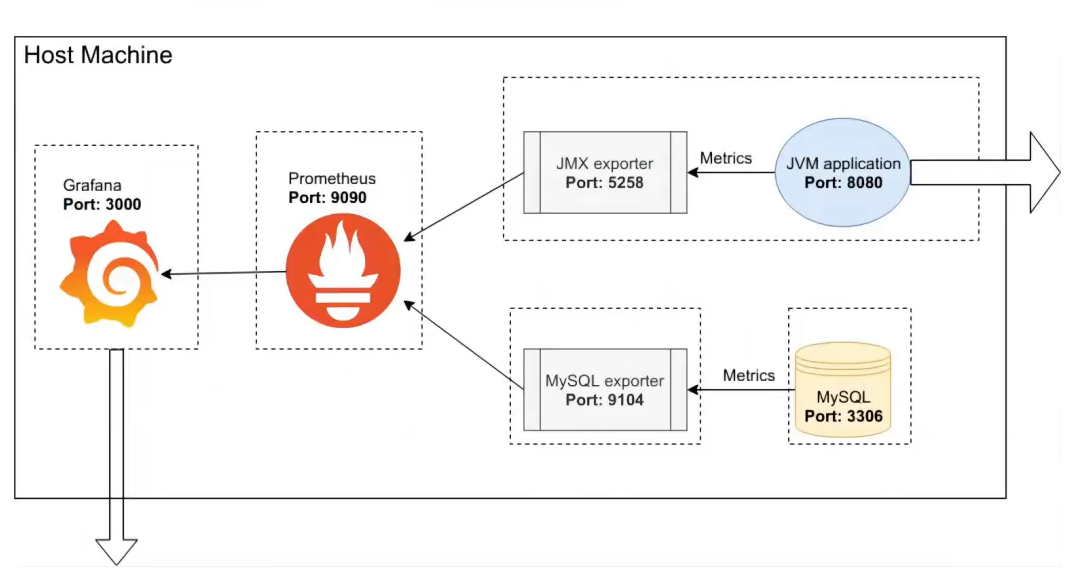
3、总结 Prometheus 基于 exporter 进行指标数据采集的流程
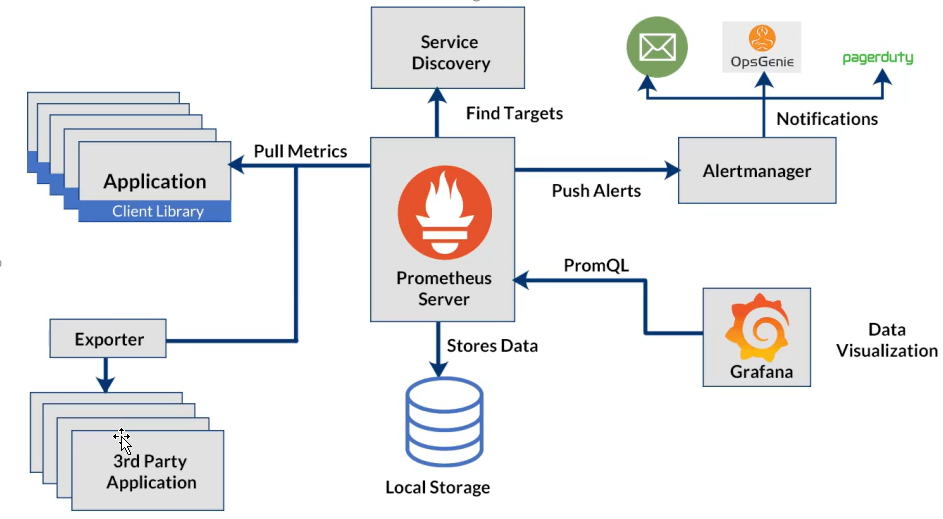
编写应用程序所需要暴露参数的export代码,exporter启动后将会自动抽取数据并能够通过接口供给pormetheus获取,prom 获取数据存储下来,供给grafana展示使用,通过promsql监控参数异常情况后调用alermanager 进行告警
4、Prometheus 集合 AlertManager 实现邮件、钉钉、微信告警
基于钉钉告警模板与企业微信告警模板实现自定义告警内容
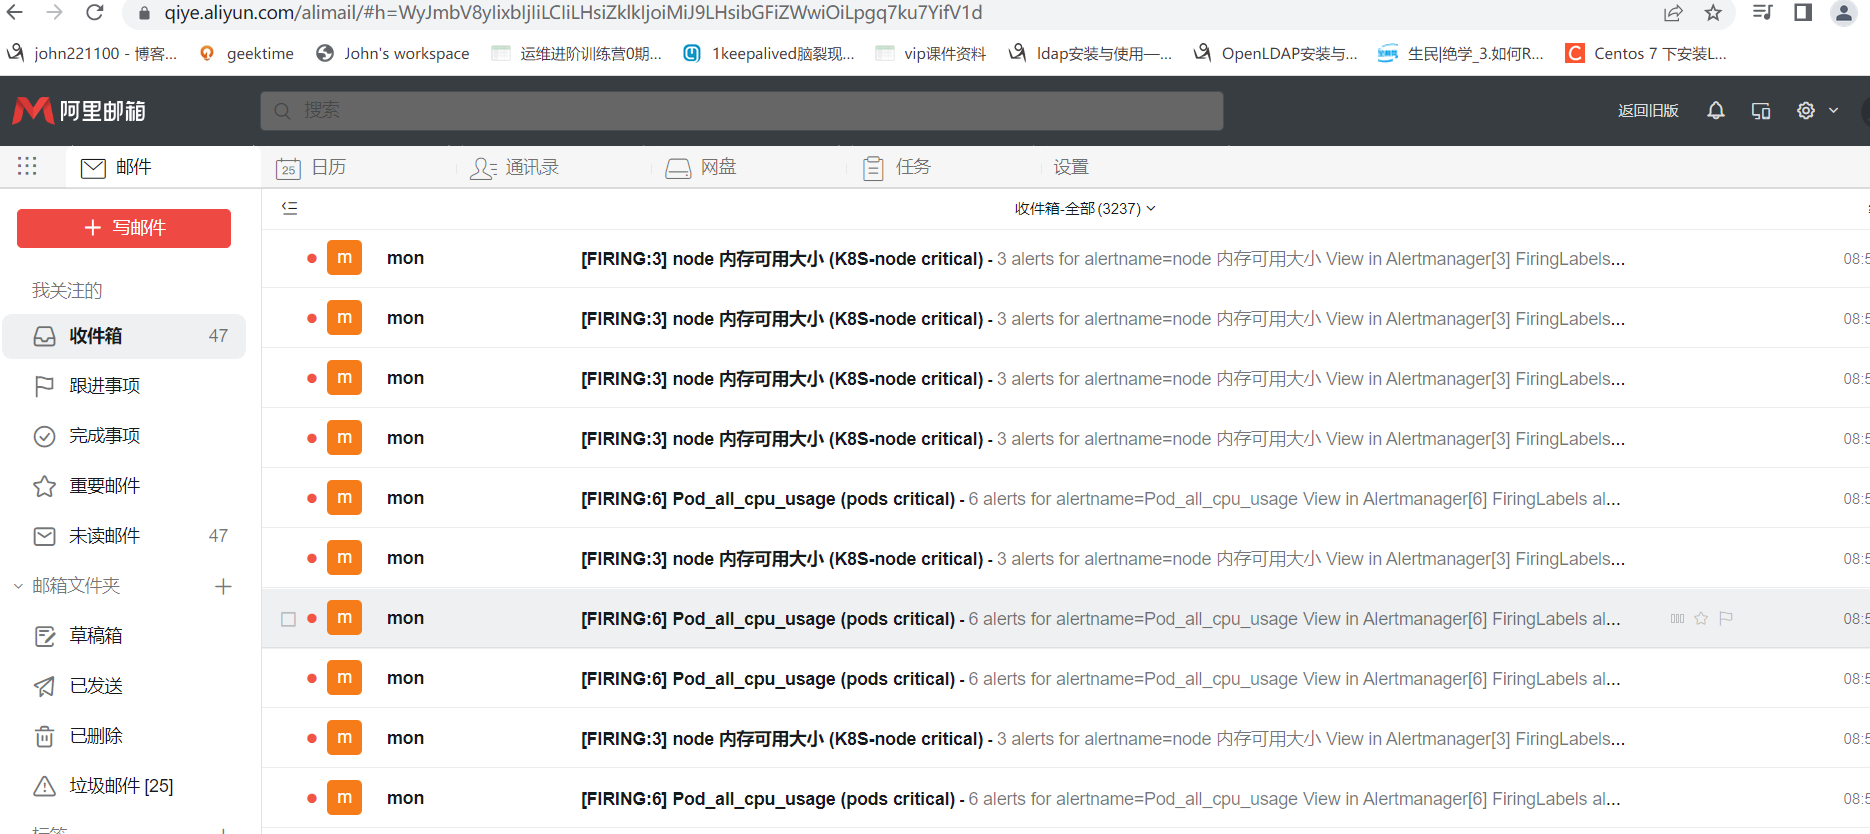
4.1 邮件告警
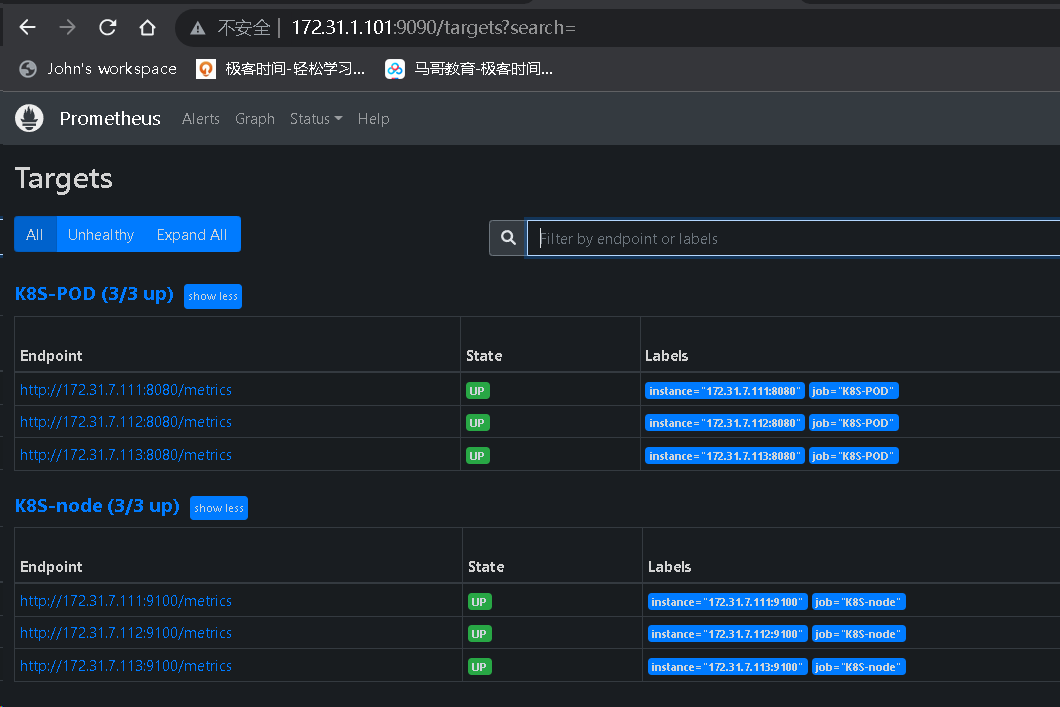
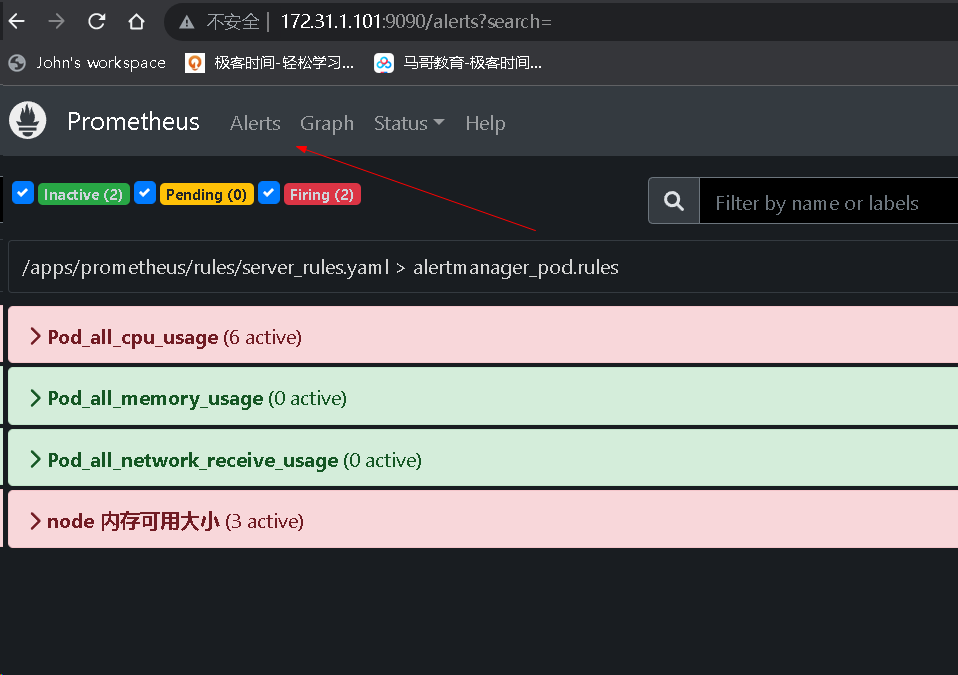
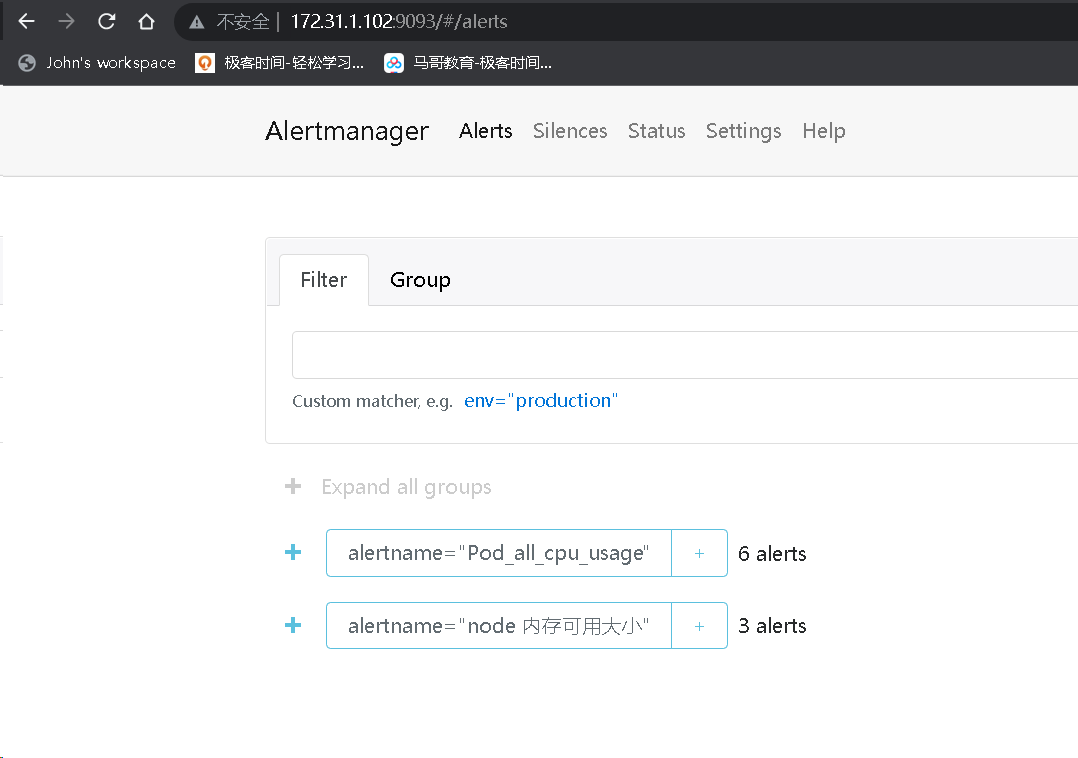
cd  /usr/local/src/
tar xf alertmanager-0.25.0.linux-amd64.tar.gz

root@prometheus-server02:/usr/local/src# mv alertmanager-0.25.0.linux-amd64 /apps/
root@prometheus-server02:/usr/local/src# ln -s /apps/alertmanager-0.25.0.linux-amd64/ /apps/alertmanager

tee /etc/systemd/system/alertmanager.service << "EOF"
[Unit]
Description=Prometheus alertmanager
After=network.target

[Service]
ExecStart=/apps/alertmanager/alertmanager --config.file="/apps/alertmanager/alertmanager.yml"

[Install]
WantedBy=multi-user.target
EOF
systemctl daemon-reload && systemctl restart alertmanager && systemctl enable alertmanager

root@prometheus-server02:/usr/local/src# netstat  -ntlp|grep alert
tcp6       0      0 :::9094                 :::*                    LISTEN      87688/alertmanager
tcp6       0      0 :::9093                 :::*                    LISTEN      87688/alertmanager

# 配置alert manager
tee /apps/alertmanager/alertmanager.yml << "EOF"
global:
  resolve_timeout: 2m
  smtp_smarthost: 'smtp.mxhichina.com:465'
  smtp_from: 'mon@iclinux.com'
  smtp_auth_username: 'mon@iclinux.com'
  smtp_auth_password: 'xxxxxxxx'
  #smtp_hello: '@aliyun.com'
  smtp_require_tls: false

route: #route 用来设置报警的分发策略
  group_by: ['alertname'] #采用哪个标签来作为分组依据
  group_wait: 2s
  group_interval: 3s
  repeat_interval: 3s
  receiver: 'email' #设置接收人

receivers:
- name: 'email'
  #webhook_configs:
  #- url: 'http://127.0.0.1:5001/'
  email_configs:
    - to: 'mon@iclinux.com'

inhibit_rules: #抑制的规则
  - source_match: #源匹配级别,当匹配成功发出通知,但是其它'alertname', 'dev', 'instance'产生的  warning 级别的告警通知将被抑制
      severity: 'critical' #报警的事件级别
    target_match:
      severity: 'warning' #调用source_match 的severity 即如果已经有'critical' 级别的报警,那么将匹  配目标为新产生的告警级别为'warning' 的将被抑制
    equal: ['alertname', 'dev', 'instance'] #匹配那些对象的告警
EOF
systemctl  restart alertmanager.service

# 配置prometheus
root@prometheus-server01:/apps/prometheus# vim prometheus.yml
# Alertmanager configuration
alerting:
  alertmanagers:
    - static_configs:
        - targets:
           - 172.31.1.102:9093
rule_files:
  - "/apps/prometheus/rules/server_rules.yaml"

# 报警规则
cd /apps/prometheus && mkdir rules

tee /apps/prometheus/rules/server_rules.yaml << "EOF"
groups:
  - name: alertmanager_pod.rules
    rules:
    - alert: Pod_all_cpu_usage
      expr: (sum by(name)(rate(container_cpu_usage_seconds_total{image!=""}[5m]))*100) > 1  # 告警规则,故意写错可以通过通过prosql查数的表达式
      for: 10s
      labels:
        severity: critical
        service: pods
      annotations:
        description: 容器 {{ $labels.name }} CPU 资源利用率大于 1% , (current value is {{ $value }})
        summary: Dev CPU 负载告警

    - alert: Pod_all_memory_usage
      #expr: sort_desc(avg by(name)(irate(container_memory_usage_bytes{name!=""}[5m]))*100) > 10 #内存大于10%
      expr: sort_desc(avg by(name)(irate(node_memory_MemFree_bytes {name!=""}[5m]))) > 2 #内存大于2G,正确写法为2*1024*1024*1024
      for: 10s
      labels:
        severity: critical
      annotations:
        description: 容器 {{ $labels.name }} Memory 资源利用率大于 2G , (current value is {{ $value }})
        summary: Dev Memory 负载告警

    - alert: Pod_all_network_receive_usage
      expr: sum by (name)(irate(container_network_receive_bytes_total{container_name="POD"}[1m])) > 1  ## 为演示故意写错
      for: 10s
      labels:
        severity: critical
      annotations:
        description: 容器 {{ $labels.name }} network_receive 资源利用率大于 50M , (current value is {{ $value }})

    - alert: node 内存可用大小
      expr: node_memory_MemFree_bytes > 1 #故意写错
      for: 10s
      labels:
        severity: critical
      annotations:
        description: node节点  {{ $labels.name }} 可用内存大于1字节,当前值为:  {{ $value }}

EOF


# 创建测试pod

root@k8s-master1:~/day20/1.prometheus-case-files# cat case1-daemonset-deploy-cadvisor.yaml
apiVersion: apps/v1
kind: DaemonSet
metadata:
  name: cadvisor
  namespace: monitoring
spec:
  selector:
    matchLabels:
      app: cAdvisor
  template:
    metadata:
      labels:
        app: cAdvisor
    spec:
      tolerations:    #污点容忍,忽略master的NoSchedule
        - effect: NoSchedule
          key: node-role.kubernetes.io/master
      hostNetwork: true
      restartPolicy: Always   # 重启策略
      containers:
      - name: cadvisor
        image: registry.cn-hangzhou.aliyuncs.com/zhangshijie/cadvisor-amd64:v0.45.0
        imagePullPolicy: IfNotPresent  # 镜像策略
        ports:
        - containerPort: 8080
        volumeMounts:
          - name: root
            mountPath: /rootfs
          - name: run
            mountPath: /var/run
          - name: sys
            mountPath: /sys
          - name: docker
            mountPath: /var/lib/docker
            #mountPath: /var/lib/containerd
      volumes:
      - name: root
        hostPath:
          path: /
      - name: run
        hostPath:
          path: /var/run
      - name: sys
        hostPath:
          path: /sys
      - name: docker
        hostPath:
          path: /var/lib/docker
          #path: /var/lib/containerd
root@k8s-master1:~/day20/1.prometheus-case-files# cat case2-daemonset-deploy-node-exporter.yaml
apiVersion: apps/v1
kind: DaemonSet
metadata:
  name: node-exporter
  namespace: monitoring
  labels:
    k8s-app: node-exporter
spec:
  selector:
    matchLabels:
        k8s-app: node-exporter
  template:
    metadata:
      labels:
        k8s-app: node-exporter
    spec:
      tolerations:
        - effect: NoSchedule
          key: node-role.kubernetes.io/master
      containers:
      - image: registry.cn-hangzhou.aliyuncs.com/zhangshijie/node-exporter:v1.5.0
        imagePullPolicy: IfNotPresent
        name: prometheus-node-exporter
        ports:
        - containerPort: 9100
          hostPort: 9100
          protocol: TCP
          name: metrics
        volumeMounts:
        - mountPath: /host/proc
          name: proc
        - mountPath: /host/sys
          name: sys
        - mountPath: /host
          name: rootfs
        args:
        - --path.procfs=/host/proc
        - --path.sysfs=/host/sys
        - --path.rootfs=/host
      volumes:
        - name: proc
          hostPath:
            path: /proc
        - name: sys
          hostPath:
            path: /sys
        - name: rootfs
          hostPath:
            path: /
      hostNetwork: true
      hostPID: true
---
apiVersion: v1
kind: Service
metadata:
  annotations:
    prometheus.io/scrape: "true"
  labels:
    k8s-app: node-exporter
  name: node-exporter
  namespace: monitoring
spec:
  type: NodePort
  ports:
  - name: http
    port: 9100
    nodePort: 39100
    protocol: TCP
  selector:
    k8s-app: node-exporter

root@k8s-master1:~/day20/1.prometheus-case-files# kubectl  apply -f case1-daemonset-deploy-cadvisor.yaml  -f case2-daemonset-deploy-node-exporter.yaml
daemonset.apps/cadvisor created
daemonset.apps/node-exporter created
service/node-exporter created

# prom 配置静态发现
  - job_name: "K8S-POD"
    static_configs:
      - targets: ["172.31.7.111:8080","172.31.7.112:8080","172.31.7.113:8080"]
  - job_name: "K8S-node"
    static_configs:
      - targets: ["172.31.7.111:9100","172.31.7.112:9100","172.31.7.113:9100"]
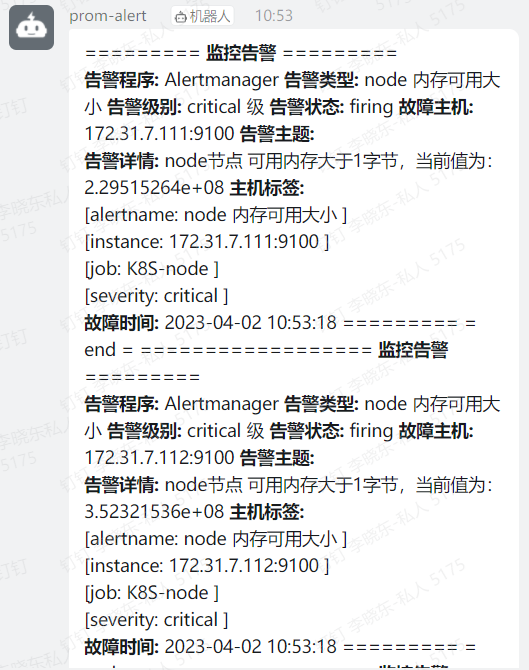
4.2 钉钉告警
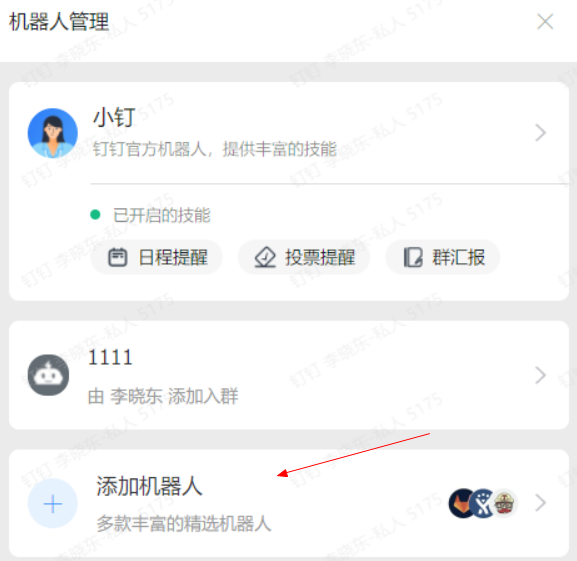
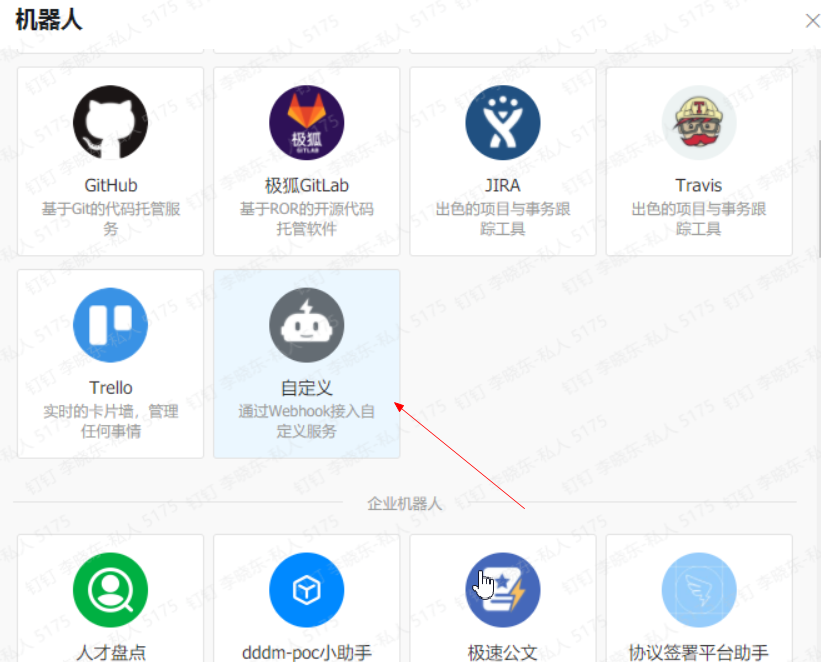
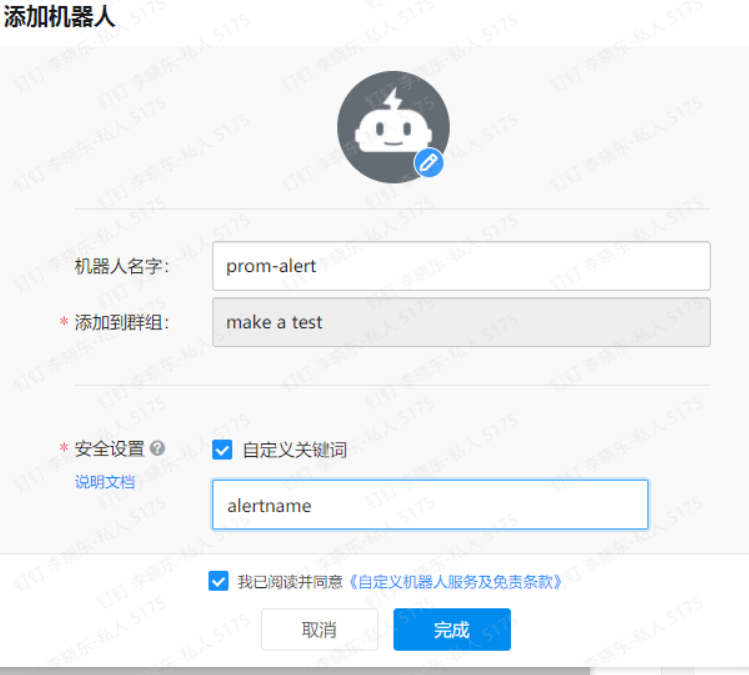
验证钉钉机器人
#!/bin/bash
source   /etc/profile
#PHONE=$1
#SUBJECT=$2
MESSAGE=$1

/usr/bin/curl -X "POST"  'https://oapi.dingtalk.com/robot/send?access_token=65cbfef3732b87f78a200973bbbed0d06f73ed38ae0ff04667fa1fec580faa41' \\
-H 'Content-Type: application/json' \\
-d '{"msgtype": "text",
    "text": {
         "content": "'${MESSAGE}'"
    }
  }'

#!/usr/bin/python3
import sys
import requests
import json
#钉钉告警:
def info(msg):
    url = 'https://oapi.dingtalk.com/robot/send?access_token=65cbfef3732b87f78a200973bbbed0d06f73ed38ae0ff04667fa1fec580faa41'

    headers = {
        'Content-Type': 'application/json;charset=utf-8'
    }
    formdata = {
        "msgtype": "text",
        "text": {"content":str(msg)}
    }
    #print(formdata)
    requests.post(url=url, data=json.dumps(formdata),headers=headers)
info(sys.argv[1])
安装插件
# 从github下载
cd /usr/local/src && wget https://github.com/timonwong/prometheus-webhook-dingtalk/releases/download/v1.4.0/prometheus-webhook-dingtalk-1.4.0.linux-amd64.tar.gz
root@prometheus-server03:/usr/local/src# tar xf prometheus-webhook-dingtalk-1.4.0.linux-amd64.tar.gz
root@prometheus-server03:/usr/local/src# mv prometheus-webhook-dingtalk-1.4.0.linux-amd64 /apps/

ln -sf /apps/prometheus-webhook-dingtalk-1.4.0.linux-amd64/  /apps/prometheus-webhook-dingtalk
cd  /apps/prometheus-webhook-dingtalk
nohup ./prometheus-webhook-dingtalk --web.enable-ui --web.listen-address="0.0.0.0:8060" --ding.profile="alertname=https://oapi.dingtalk.com/robot/send?access_token=8a0a74aac1cac011698d64c95f9db734c1995b3f3ee0d6e5742d9ec4aadb2318" &
# 注意  alertname 为机器人的关键词,否则会报错

# 配置告警邮件 alartmanager 服务器

tee /apps/alertmanager/alertmanager.yml << "EOF"
global:
  resolve_timeout: 2m
  smtp_smarthost: 'smtp.mxhichina.com:465'
  smtp_from: 'mon@iclinux.com'
  smtp_auth_username: 'mon@iclinux.com'
  smtp_auth_password: 'xxxxxx'
  #smtp_hello: '@aliyun.com'
  smtp_require_tls: false

route: #route 用来设置报警的分发策略
  group_by: ['alertname'] #采用哪个标签来作为分组依据
  group_wait: 2s
  group_interval: 3s
  repeat_interval: 3s
  receiver: 'dingding' #设置接收人

receivers:
  - name: 'email'
    #webhook_configs:
    #- url: 'http://127.0.0.1:5001/'
    email_configs:
      - to: 'mon@iclinux.com'
  - name: dingding
    webhook_configs:
    - url: 'http://172.31.1.103:8060/dingtalk/alertname/send' # alertname 为钉钉机器人关键词
      send_resolved: true

inhibit_rules: #抑制的规则
  - source_match: #源匹配级别,当匹配成功发出通知,但是其它'alertname', 'dev', 'instance'产生的  warning 级别的告警通知将被抑制
      severity: 'critical' #报警的事件级别
    target_match:
      severity: 'warning' #调用source_match 的severity 即如果已经有'critical' 级别的报警,那么将匹  配目标为新产生的告警级别为'warning' 的将被抑制
    equal: ['alertname', 'dev', 'instance'] #匹配那些对象的告警
EOF
systemctl  restart alertmanager.service


# webhook-dingtalk 服务器配置模板

tee /apps/prometheus-webhook-dingtalk/template_dingtalk.yaml << "EOF"
{{ define "dingding.to.message" }}

{{- if gt (len .Alerts.Firing) 0 -}}
{{- range $index, $alert := .Alerts -}}

=========  **监控告警** =========

**告警程序:**     Alertmanager
**告警类型:**    {{ $alert.Labels.alertname }}
**告警级别:**    {{ $alert.Labels.severity }} 级
**告警状态:**    {{ .Status }}
**故障主机:**    {{ $alert.Labels.instance }} {{ $alert.Labels.device }}
**告警主题:**    {{ .Annotations.summary }}
**告警详情:**    {{ $alert.Annotations.message }}{{ $alert.Annotations.description}}
**主机标签:**    {{ range .Labels.SortedPairs  }}  </br> [{{ .Name }}: {{ .Value | markdown | html }} ]
{{- end }} </br>

**故障时间:**    {{ ($alert.StartsAt.Add 28800e9).Format "2006-01-02 15:04:05" }}
========= = end =  =========
{{- end }}
{{- end }}

{{- if gt (len .Alerts.Resolved) 0 -}}
{{- range $index, $alert := .Alerts -}}

========= 告警恢复 =========
**告警程序:**     Alertmanager
**告警主题:**    {{ $alert.Annotations.summary }}
**告警主机:**    {{ .Labels.instance }}
**告警类型:**    {{ .Labels.alertname }}
**告警级别:**    {{ $alert.Labels.severity }} 级
**告警状态:**    {{   .Status }}
**告警详情:**    {{ $alert.Annotations.message }}{{ $alert.Annotations.description}}
**故障时间:**    {{ ($alert.StartsAt.Add 28800e9).Format "2006-01-02 15:04:05" }}
**恢复时间:**    {{ ($alert.EndsAt.Add 28800e9).Format "2006-01-02 15:04:05" }}

========= = **end** =  =========
{{- end }}
{{- end }}
{{- end }}
EOF


tee /apps/prometheus-webhook-dingtalk/config.yml << "EOF"
## Request timeout
# timeout: 5s

## Customizable templates path
templates:
  - /apps/prometheus-webhook-dingtalk/template_dingtalk.yaml
#   - contrib/templates/legacy/template.tmpl

## You can also override default template using `default_message`
## The following example to use the 'legacy' template from v0.3.0
# default_message:
#   title: '{{ template "legacy.title" . }}'
#   text: '{{ template "legacy.content" . }}'


## Targets, previously was known as "profiles"
targets:
  alertname:    # 此处为关键词
    url: https://oapi.dingtalk.com/robot/send?access_token=8a0a74aac1cac011698d64c95f9db734c1995b3f3ee0d6e5742d9ec4aadb2318
    # secret for signature
    # secret: SEC716a2b98ec7bbacf8a78f849caf17adf6450bb29b3d1b62ff53cd393839f1927
    message:
      # Use legacy template
      text: '{{ template "dingding.to.message" . }}'

EOF

./prometheus-webhook-dingtalk --web.listen-address="0.0.0.0:8060" --web.enable-ui --config.file="config.yml"
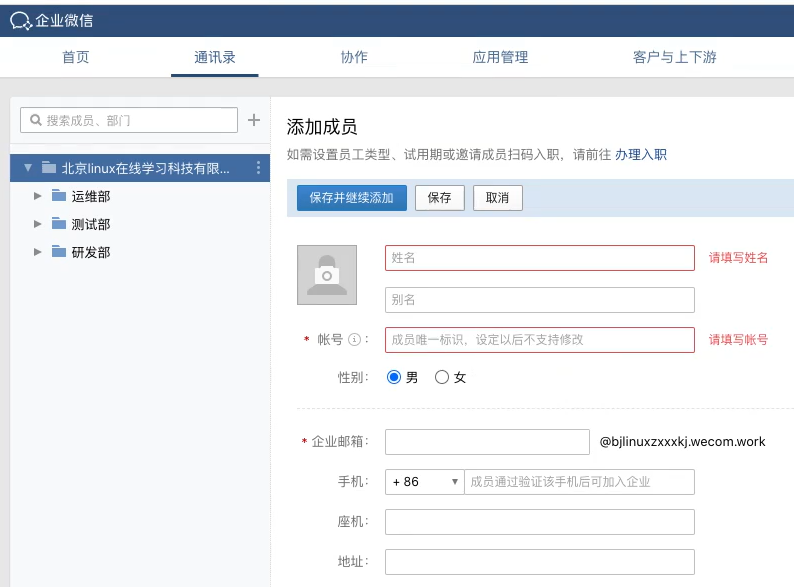
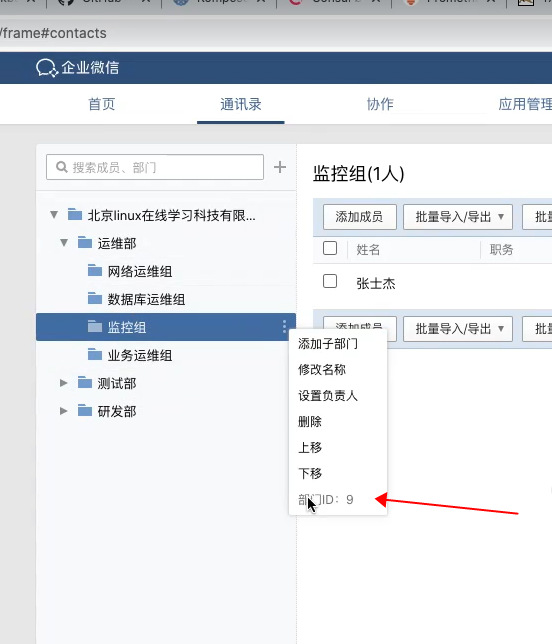
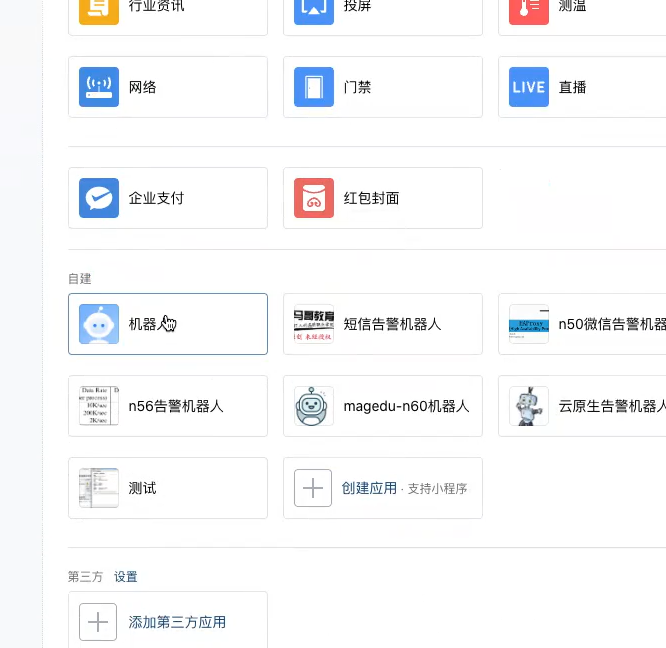
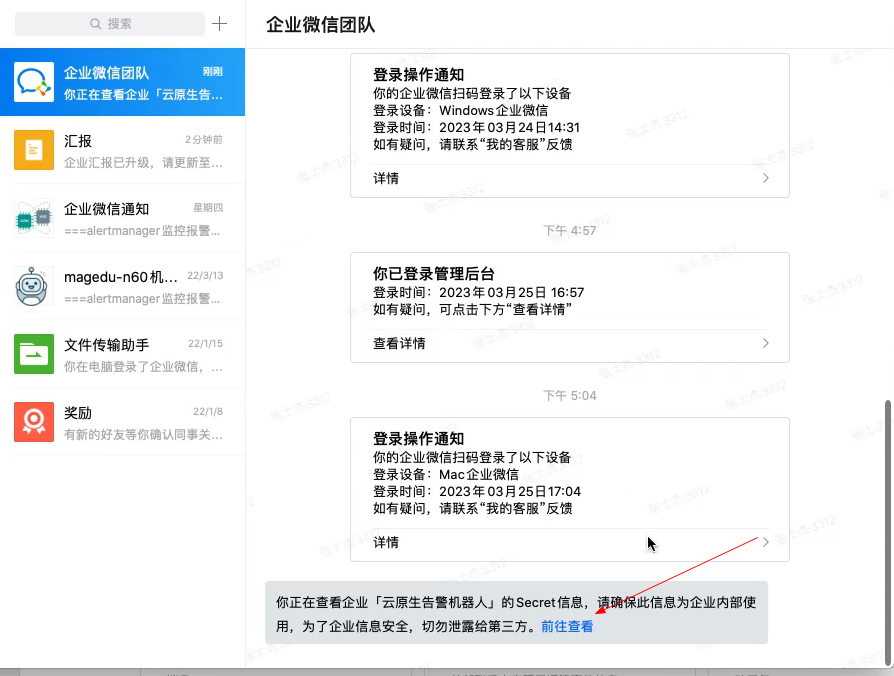
4.3 微信告警
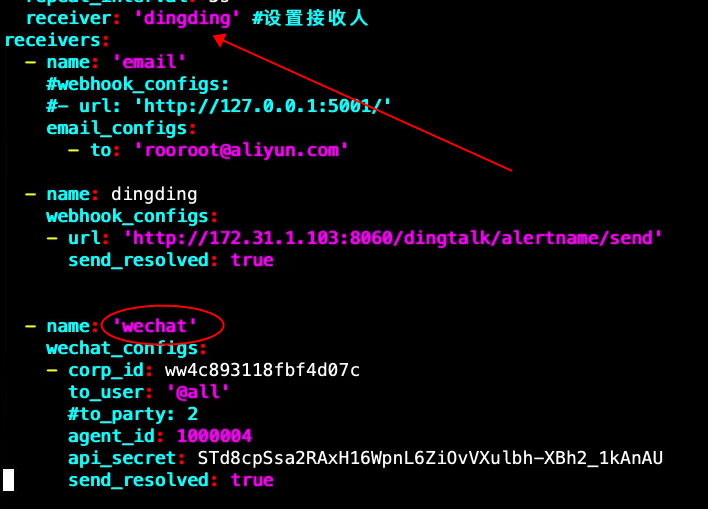
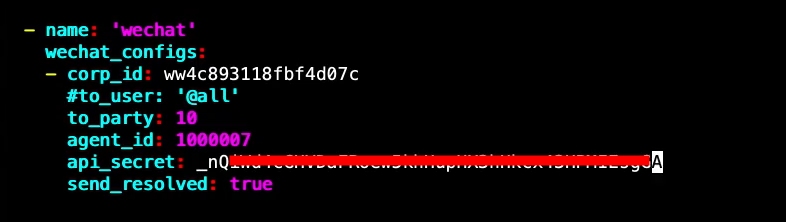
# altermagager 设置
tee message_template.templ << "EOF"
{{ define "wechat.default.message" }}
{{- if gt (len .Alerts.Firing) 0 -}}
{{- range $index, $alert := .Alerts -}}
{{- if eq $index 0 -}}
**********告警通知**********
告警类型: {{ $alert.Labels.alertname }}
告警级别: {{ $alert.Labels.severity }}
{{- end }}
=====================
告警主题: {{ $alert.Annotations.summary }}
告警详情: {{ $alert.Annotations.description }}
故障时间: {{ $alert.StartsAt.Local.Format "2006-01-02 15:04:05" }}
{{ if gt (len $alert.Labels.instance) 0 -}}故障实例: {{ $alert.Labels.instance }}{{- end -}}
{{- end }}
{{- end }}

{{- if gt (len .Alerts.Resolved) 0 -}}
{{- range $index, $alert := .Alerts -}}
{{- if eq $index 0 -}}
**********恢复通知**********
告警类型: {{ $alert.Labels.alertname }}
告警级别: {{ $alert.Labels.severity }}
{{- end }}
=====================
告警主题: {{ $alert.Annotations.summary }}
告警详情: {{ $alert.Annotations.description }}
故障时间: {{ $alert.StartsAt.Local.Format "2006-01-02 15:04:05" }}
恢复时间: {{ $alert.EndsAt.Local.Format "2006-01-02 15:04:05" }}
{{ if gt (len $alert.Labels.instance) 0 -}}故障实例: {{ $alert.Labels.instance }}{{- end -}}
{{- end }}
{{- end }}
{{- end }}
EOF


 浙公网安备 33010602011771号