

极客时间运维进阶训练营第七周作业
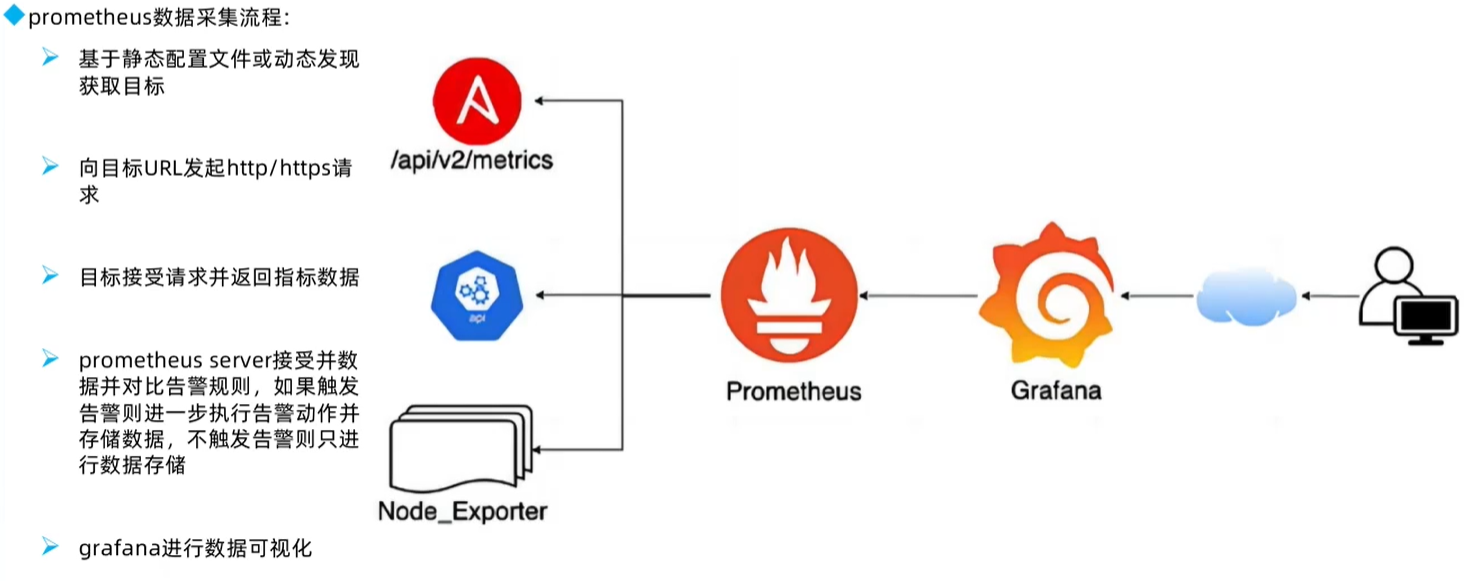
1、了解 Prometheus 各组件的功能,熟悉 Prometheus 的数据采集流程
主要组件功能
server:主服务,存储指标数据和查询指标数据,提供api接口供第三方调取
targets:静态发现目标后执行指标数据抓取
service discovery:动态发现目标后执行指标数据抓取
push gateway:数据收集代理服务器,收集短生命周期数据,由server拉取
alerting:调用alermanager组件实现告警通知
data visualization and export:数据可视化和数据导出
2、基于 Docker 或二进制部署 Prometheus Server
install -d /apps
tar xzf /usr/local/src/prometheus-2.40.5.linux-amd64.tar.gz  -C /apps/
ln -s /apps/prometheus-2.40.5.linux-amd64 /apps/prometheus

tee /etc/systemd/system/prometheus.service << "EOF"
[Unit]
Description=Prometheus Server
Documentation=https://prometheus.io/docs/introduction/overview/
After=network.target

[Service]
Restart=on-failure
WorkingDirectory=/apps/prometheus/
ExecStart=/apps/prometheus/prometheus   --config.file=/apps/prometheus/prometheus.yml --web.enable-lifecycle

[Install]
WantedBy=multi-user.target


EOF

## 检查配置文件
 /apps/prometheus/promtool check config /apps/prometheus/prometheus.yml

systemctl daemon-reload && systemctl restart prometheus && systemctl enable prometheus
3、基于 Docker 或二进制部署 node-exporter,并通过 Prometheus 收集 node-exporter 指标数据
BASE_DIR="/apps"
install -d ${BASE_DIR}
tar xzf /usr/local/src/node_exporter-1.5.0.linux-amd64.tar.gz -C ${BASE_DIR}
ln -s /apps/node_exporter-1.5.0.linux-amd64/ /apps/node_exporter

tee  /etc/systemd/system/node-exporter.service << "EOF"
[Unit]
Description=Prometheus Node Exporter
After=network.target

[Service]
ExecStart=/apps/node_exporter/node_exporter

[Install]
WantedBy=multi-user.target
EOF
systemctl   daemon-reload &&  systemctl  restart node-exporter && systemctl  enable  node-exporter
# 验证
# http://192.168.56.141:9100/metrics

# prometheus-server 执行
cp /apps/prometheus/prometheus.yml{,.bak}

tee -a /apps/prometheus/prometheus.yml << "EOF"
  - job_name: "prometheus-nodes"
    # metrics_path: '/metrics'
    # scheme defaults to 'http'.

    static_configs:
      - targets: ["192.168.56.141:9100","192.168.56.142:9100","192.168.56.143:9100"]
EOF
 /apps/prometheus/promtool check config /apps/prometheus/prometheus.yml
systemctl restart prometheus.service
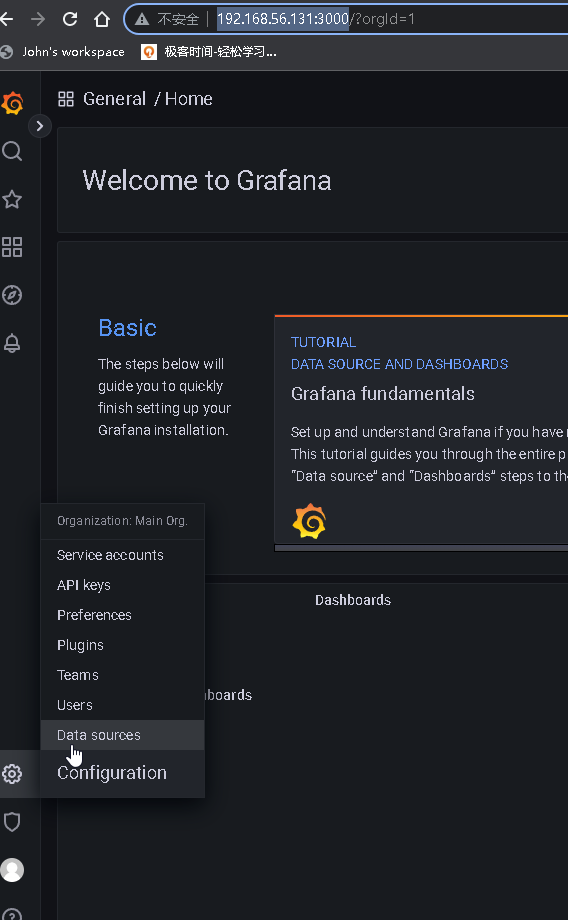
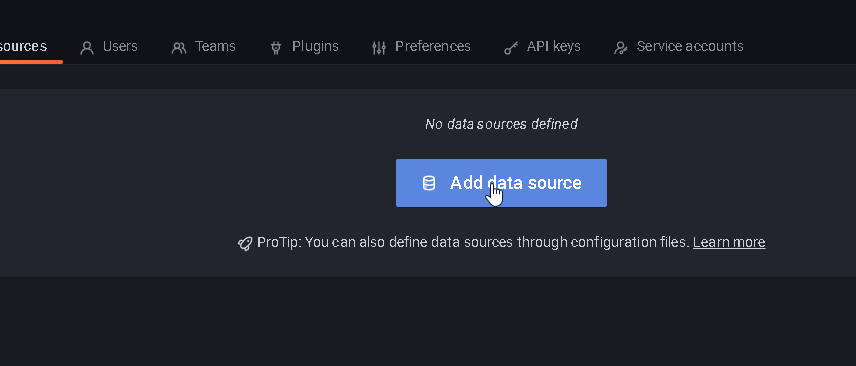
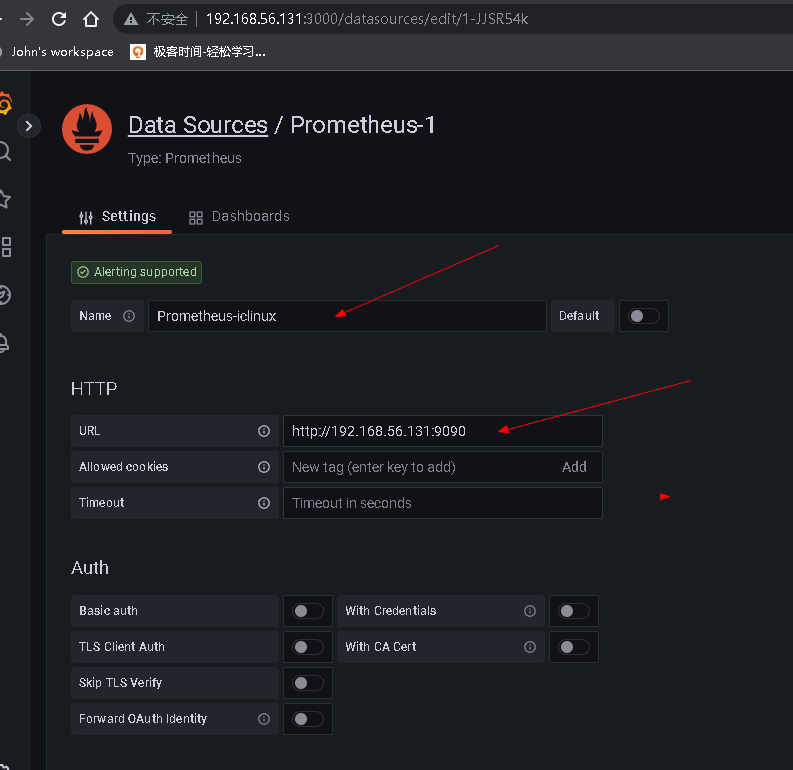
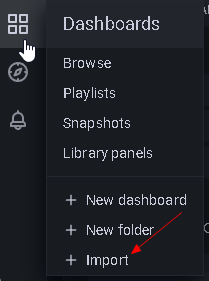
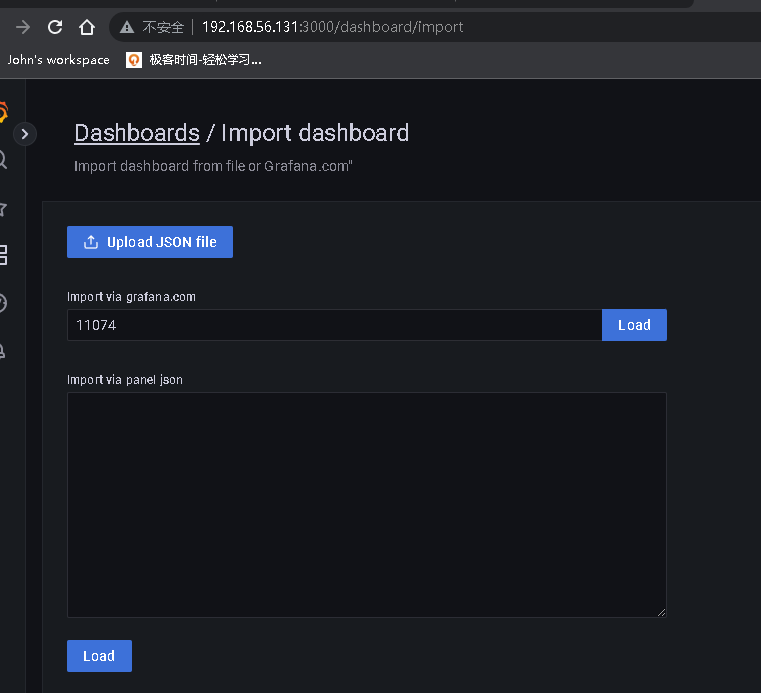
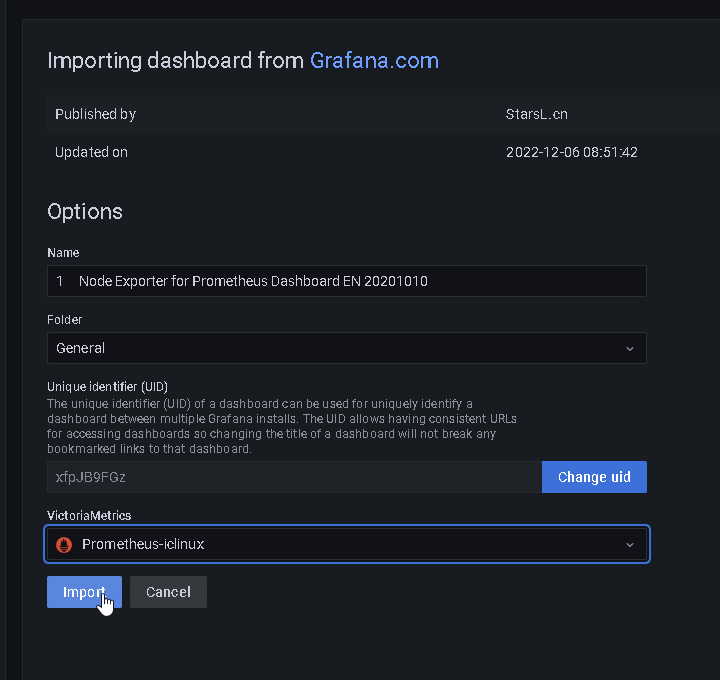
4、安装 Grafana 并添加 Prometheus 数据源,导入模板可以图形显示指标数据
apt install -y adduser libfontconfig1
cd /usr/local/src && curl -O https://dl.grafana.com/enterprise/release/grafana-enterprise_9.3.1_amd64.deb
dpkg -i /usr/local/src/grafana-enterprise_9.3.1_amd64.deb

# 注:生产环境建议在启动的时候设置mysql数据进行初始化表的,不适用默认的
systemctl  restart  grafana-server.service &&  systemctl  enable  grafana-server.service
#入口http://192.168.56.131:3000/
#账号密码  admin\admin

5、掌握 Prometheus 的 PromQL 语句的简单使用
(node_memory_MemTotal_bytes - node_memory_MemFree_bytes)/node_memory_MemTotal_bytes*100
标签的操作:
= 匹配
!= 取反
=~ 使用正则
!~ 不满足正则
时间范围
s 秒
m 分
h 时
d 日
w 周
y 年
eg 5分钟 [5m] 2年[2y]
算数运行:
+ - * / %(模) ^(N次方)
聚合运算
max() 最大值
min() 最小值
avg() 平均值
sum() 求和,数据值相加
count() 计数,统计返回值的条数
count_values() 行数计数,将value赋值给自定义标签为新标签 count_values("node_version", node_os_version)
abs() 返回指标数据的值
absent() 有值返回空,无值返回1,常用于告警
stddev() 求标准差
stdvar() 求方差
topk() 取最大值
bottomk() 取最小值
rate() 一组数据的平均值计算速率
irate() 两个数据点算速率
by() 结果中只保留哪些标签 sum(rate(node_memory_MemFree_bytes[5m])) by (increase)
without() 结果中移除哪些
6、部署 Prometheus 联邦集群并实现指标数据收集
node1
install -d /apps
tar xzf /usr/local/src/prometheus-2.40.5.linux-amd64.tar.gz  -C /apps/
ln -s /apps/prometheus-2.40.5.linux-amd64 /apps/prometheus

tee /etc/systemd/system/prometheus.service << "EOF"
[Unit]
Description=Prometheus Server
Documentation=https://prometheus.io/docs/introduction/overview/
After=network.target

[Service]
Restart=on-failure
WorkingDirectory=/apps/prometheus/
ExecStart=/apps/prometheus/prometheus   --config.file=/apps/prometheus/prometheus.yml --web.enable-lifecycle

[Install]
WantedBy=multi-user.target
EOF


tee -a /apps/prometheus/prometheus.yml << "EOF"
  - job_name: "prometheus-federate-132"
    scrape_interval: 10s
    honor_labels: true
    metrics_path: '/federate'
    params:
      'match[]':
      - '{job="prometheus"}'
      - '{__name__=~"job:.*"}'
      - '{__name__=~"node.*"}'
    static_configs:
      - targets:
        - "192.168.56.132:9090"

  - job_name: "prometheus-federate-133"
    scrape_interval: 10s
    honor_labels: true
    metrics_path: '/federate'
    params:
      'match[]':
      - '{job="prometheus"}'
      - '{__name__=~"job:.*"}'
      - '{__name__=~"node.*"}'
    static_configs:
      - targets:
        - "192.168.56.133:9090"
EOF
systemctl restart prometheus.service
node2
install -d /apps
tar xzf /usr/local/src/prometheus-2.40.5.linux-amd64.tar.gz  -C /apps/
ln -s /apps/prometheus-2.40.5.linux-amd64 /apps/prometheus

tee /etc/systemd/system/prometheus.service << "EOF"
[Unit]
Description=Prometheus Server
Documentation=https://prometheus.io/docs/introduction/overview/
After=network.target

[Service]
Restart=on-failure
WorkingDirectory=/apps/prometheus/
ExecStart=/apps/prometheus/prometheus   --config.file=/apps/prometheus/prometheus.yml --web.enable-lifecycle

[Install]
WantedBy=multi-user.target


EOF

## 检查配置文件
 /apps/prometheus/promtool check config /apps/prometheus/prometheus.yml

systemctl daemon-reload && systemctl restart prometheus && systemctl enable prometheus

tee -a /apps/prometheus/prometheus.yml << "EOF"
  - job_name: "prometheus-idc1"
    static_configs:
      - targets: ["192.168.56.141:9100"]
EOF
systemctl restart prometheus.service
node3
install -d /apps
tar xzf /usr/local/src/prometheus-2.40.5.linux-amd64.tar.gz  -C /apps/
ln -s /apps/prometheus-2.40.5.linux-amd64 /apps/prometheus

tee /etc/systemd/system/prometheus.service << "EOF"
[Unit]
Description=Prometheus Server
Documentation=https://prometheus.io/docs/introduction/overview/
After=network.target

[Service]
Restart=on-failure
WorkingDirectory=/apps/prometheus/
ExecStart=/apps/prometheus/prometheus   --config.file=/apps/prometheus/prometheus.yml --web.enable-lifecycle

[Install]
WantedBy=multi-user.target
EOF

## 检查配置文件
 /apps/prometheus/promtool check config /apps/prometheus/prometheus.yml

systemctl daemon-reload && systemctl restart prometheus && systemctl enable prometheus


tee -a /apps/prometheus/prometheus.yml << "EOF"
  - job_name: "prometheus-idc2"
    static_configs:
      - targets: ["192.168.56.142:9100", "192.168.56.143:9100"]
EOF
systemctl restart prometheus.service

 浙公网安备 33010602011771号