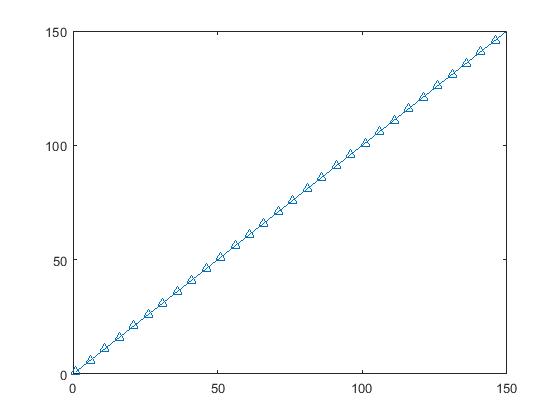
x=1:1:150;y = 1:1:150;maker_idx = 1:5:150;plot(x,y,'-^','MarkerIndices',maker_idx)
posted on 2020-12-01 16:46 文俞九州 阅读(2740) 评论(0) 收藏 举报

 浙公网安备 33010602011771号