R语言实战 - 基本图形(4)- 核密度图
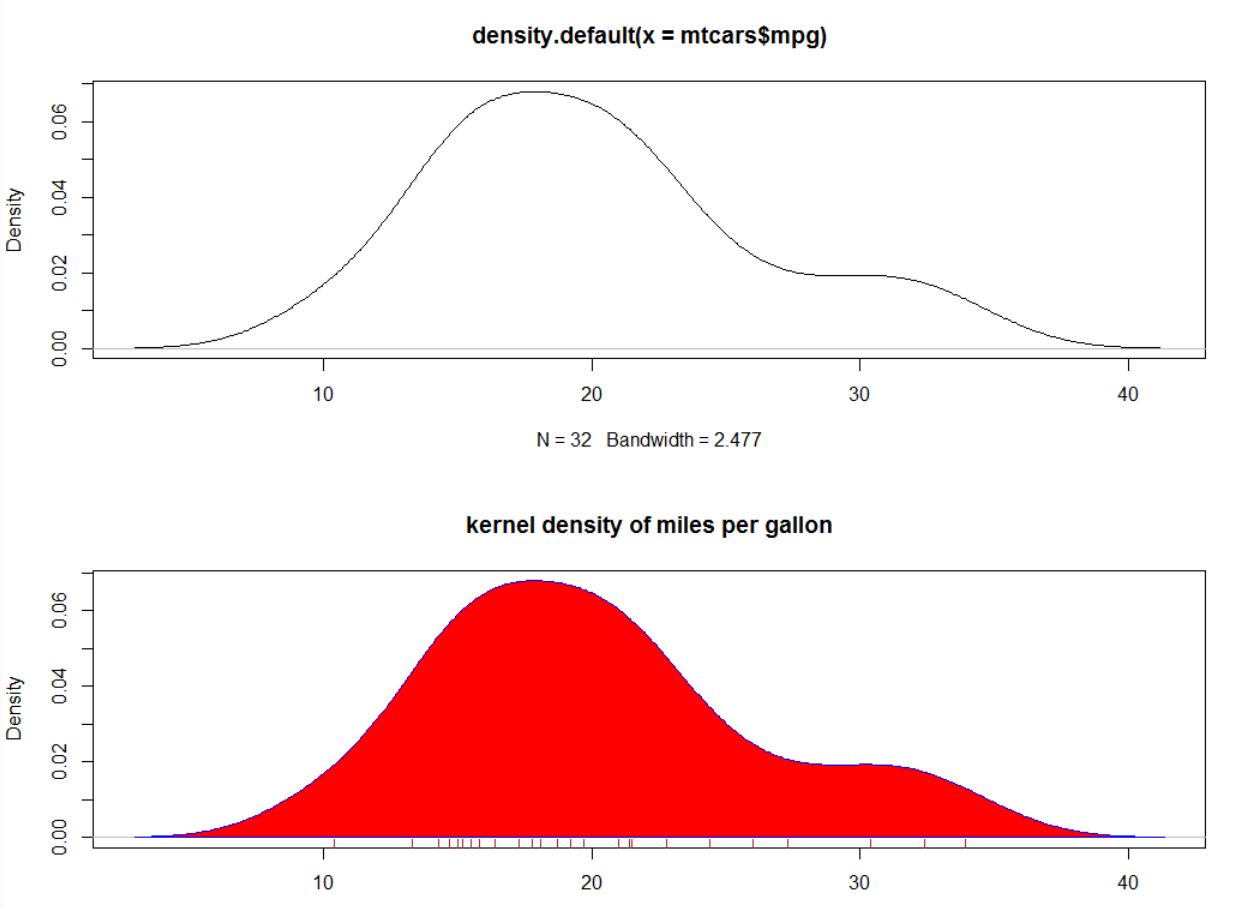
> par(mfrow=c(2, 1))
> d <- density(mtcars$mpg)
>
> plot(d)
>
> d <- density(mtcars$mpg)
> plot(d, main="kernel density of miles per gallon")
> polygon(d, col="red", border="blue")
> rug(mtcars$mpg, col="brown")
>
> par(lwd=2)
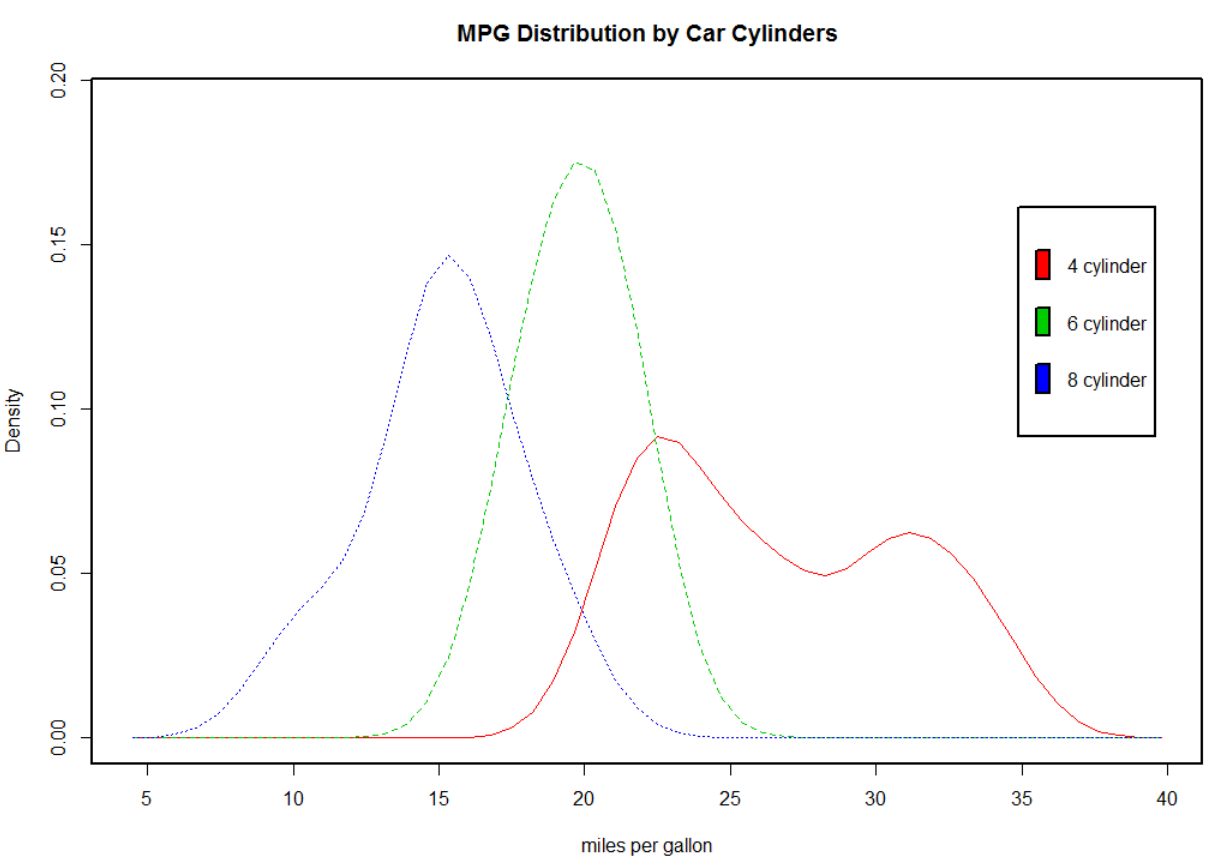
> library(sm)
> attach(mtcars)
>
> cyl.f <- factor(cyl, levels=c(4,6,8),
+ labels=c("4 cylinder", "6 cylinder", "8 cylinder"))
>
> sm.density.compare(mpg, cyl, xlab="miles per gallon")
> title(main="MPG Distribution by Car Cylinders")
>
> colfill <- c(2:(1+length(levels(cyl.f))))
> legend(locator(1), levels(cyl.f), fill=colfill)
>
> detach(mtcars)
>
posted on 2017-09-24 22:52 你的踏板车要滑向哪里 阅读(908) 评论(0) 收藏 举报


 浙公网安备 33010602011771号