vue echart 中国地图 疫情图
vue echarts中国地图 各省疫情确证人数图
首先安装echarts
npm i echarts --save
引入使用
新建一个vue文件,然后引入
import echarts from "echarts";
import "../../node_modules/echarts/map/js/china.js"; // 引入中国地图数据
初始化echarts
如果接口提供数据,则等接口放回数据在执行此方法
  chinaConfigure() {
      const _this = this;
      this.chart = echarts.init(this.$refs.myEchart); //这里是为了获得容器所在位置
      window.onresize = this.chart.resize;
      this.chart.setOption(option)}
option配置
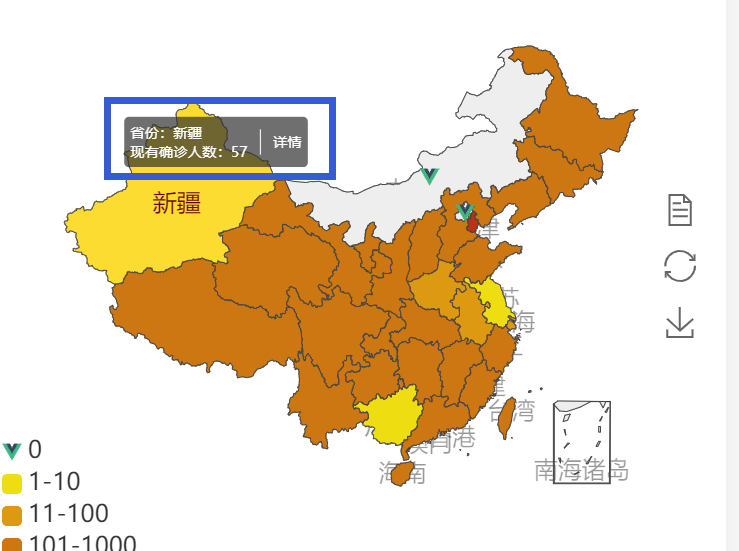
tooltip提示框配置
tooltip: {
          enterable: true,
          trigger: "item",
          triggerOn: "click",
          position: (point, params, dom, rect, size) => {
            let div = getHtmlComponent(params);
            dom.innerHTML = "";
            //新生成的节点(div)挂载到提示框的dom上面
            dom.appendChild(div.$el);
            let w = dom.offsetWidth;
            let clientW = document.documentElement.clientWidth;
            dom.style.transform = "scale(.6)";
            //避免提示框超出页面
            if (clientW / 2 < rect.x) {
              rect.x = rect.x - w / 2;
            }
            //提示框位置
            return [rect.x, rect.y];
          }
getHtmlComponent(params)方法主要是生成div
//生成div节点
function getHtmlComponent(params) {
  const infoContent = `<div style="font-size:12px;text-align:left;display:flex;align-items: center"  @click="myClick">
      <div style='padding-right:10px;'><p style='margin: 0;line-height:16px;'>省份:${params.name}</p>
       <p style='line-height:16px;margin: 0;'>现有确诊人数:${params.data.value}</p></div>
      <div style='border-left:1px solid #eee;padding-left:10px;align-content:conter'>详情</div>
      </div>`;
  const MyComponent = Vue.extend({
    template: infoContent,
    methods: {
      myClick: function() {
        console.log("点击事件监听到");
      }
    }
  });
最终提示框效果

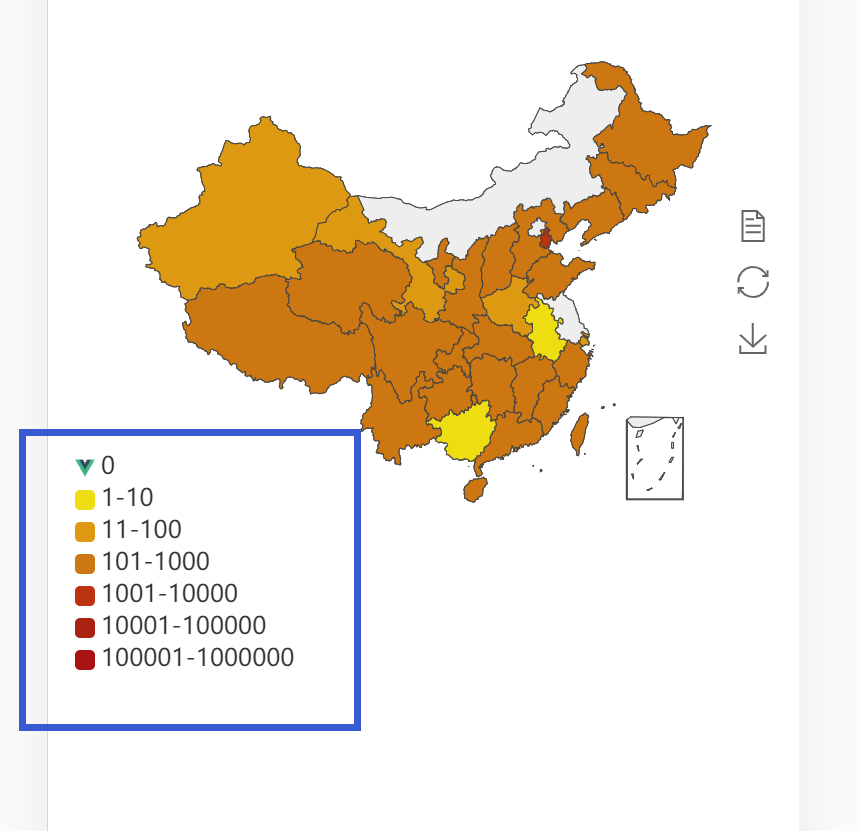
visualMap 各省份疫情数据不同来展示不同颜色配置
*配置visualMap 以后,将覆盖series数组的对象类型为'map'的颜色
visualMap: {
          type: "piecewise",
          calculable: true,
          itemHeight: 10,
          itemWidth: 10,
          textGap: 3,
          itemGap: 4,
          inverse: true,
          pieces: [

            {
              min: 100001,
              max: 10000000,
              color: "#a11",
              symbol: "roundRect",
              label: "100001-1000000"
            },
            {
              min: 10001,
              max: 100000,
              color: "#a21",
              symbol: "roundRect",
              label: "10001-100000"
            },
            {
              min: 1001,
              max: 10000,
              color: "#b31",
              symbol: "roundRect",
              label: "1001-10000"
            },
            {
              min: 101,
              max: 1000,
              color: "#c71",
              symbol: "roundRect",
              label: "101-1000"
            },
            {
              min: 11,
              max: 100,
              color: "#d91",
              symbol: "roundRect",
              label: "11-100"
            },
            {
              min: 1,
              max: 10,
              color: "#ed1",
              symbol: "roundRect",
              label: "1-10"
            },
            {
              value: 0,
              label: "",
              color: "#eee",
        //imge引入的图片
              symbol: `image://${imge}`,
              symbolSize: "50"
            }
          ],
          left: "left",
          top: "bottom"
        },
效果图

根据series数组绘制地图
*如果serise数组下的对象的coordinateSystem: 'geo',那么会option里的geo属性的配置
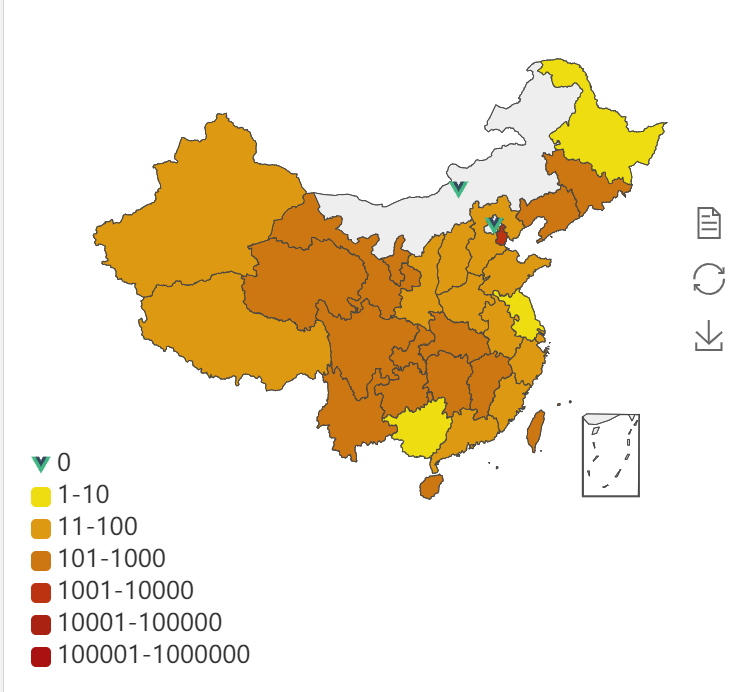
配置了两个对象,一个对象map类型,控制地图各省背景颜色;另一个对象custom类型,自定义地图上展示的图标。
map类型配置如下
{
            // name: '中国新冠病毒各省分布图',
            type: "map",
            mapType: "china",
            roam: false,
            label: {
              show: false,
              normal: {
                show: false
              },
              emphasis: {
                show: false
              }
            },

            emphasis: {
              itemStyle: {
                areaColor: "#ddd",
                borderColor: "blue"
              }
            },

            data: [..._this.mapData]
          },
custom类型配置如下
{
            type: "custom",
            coordinateSystem: "geo",
            z:10,

            data: [
             ..._this.mapData
            ],
            renderItem: function(params, api) {
              let image='';
              if(_this.mapData[params.dataIndex].value===0){
                  image=imge;
              }
              return {
                type: "image",
                style: {
                  image: image,
                  x: api.coord([
                    _this.mapData[params.dataIndex].c[0],
                    _this.mapData[params.dataIndex].c[1]
                  ])[0],
                  y: api.coord([
                    _this.mapData[params.dataIndex].c[0],
                   _this.mapData[params.dataIndex].c[1]
                  ])[1],
                  width: "10",
                  height: "10"
                }
              };
            }
          }
果是当某省份确证人数为0时背景是白色,并且插上胜利的小图标

下面是所有代码
<template>
<div class="echarts">
<div :style="{height:'400px',width:'100%'}" ref="myEchart"></div>
</div>
</template>
<script>
import Vue from "vue";
import echarts from "echarts";
import "../../node_modules/echarts/map/js/china.js"; // 引入中国地图数据
import imge from "../assets/logo.png";
//生成div节点
function getHtmlComponent(params) {
const infoContent = `<div style="font-size:12px;text-align:left;display:flex;align-items: center" @click="myClick">
<div style='padding-right:10px;'><p style='margin: 0;line-height:16px;'>省份:${params.name}</p>
<p style='line-height:16px;margin: 0;'>现有确诊人数:${params.data.value}</p></div>
<div style='border-left:1px solid #eee;padding-left:10px;align-content:conter'>详情</div>
</div>`;
const MyComponent = Vue.extend({
template: infoContent,
methods: {
myClick: function() {
console.log("点击事件监听到");
}
}
});
var component = new MyComponent().$mount();
return component;
}
export default {
name: "echarts",
props: ["userJson"],
data() {
return {
chart: null,
mapData: []
};
},
mounted() {
setTimeout(() => {
this.mapData = [
{ c: [115.46, 40.92, 12], name: "北京", value: 0 },
{ c: [117.2, 39.13, 72], name: "天津", value: 1122 },
{
c: [121.48, 31.22, 88],
name: "上海",
value: Math.round(Math.random() * 100)
},
{
c: [106.54, 29.59],
name: "重庆",
value: Math.round(Math.random() * 1000)
},
{
c: [114.48, 38.03],
name: "河北",
value: Math.round(Math.random() * 1000)
},
{
c: [113.65, 34.76],
name: "河南",
value: Math.round(Math.random() * 100)
},
{
c: [102.73, 25.04, 22],
name: "云南",
value: Math.round(Math.random() * 1000)
},
{
c: [123.38, 41.8],
name: "辽宁",
value: Math.round(Math.random() * 1000)
},
{
c: [126.63, 45.75],
name: "黑龙江",
value: Math.round(Math.random() * 1000)
},
{
c: [113, 28.21],
name: "湖南",
value: Math.round(Math.random() * 1000)
},
{
c: [117.27, 31.86],
name: "安徽",
value: Math.round(Math.random() * 100)
},
{
c: [117, 36.65],
name: "山东",
value: Math.round(Math.random() * 1000)
},
{
c: [87.68, 43.77],
name: "新疆",
value: Math.round(Math.random() * 100)
},
{
c: [118.78, 32.04],
name: "江苏",
value: Math.round(Math.random() * 10)
},
{
c: [120.19, 30.26],
name: "浙江",
value: Math.round(Math.random() * 1000)
},
{
c: [115.89, 28.68],
name: "江西",
value: Math.round(Math.random() * 1000)
},
{
c: [114.31, 30.52],
name: "湖北",
value: Math.round(Math.random() * 1000)
},
{
c: [108.33, 22.84],
name: "广西",
value: Math.round(Math.random() * 10)
},
{
c: [103.73, 36.03],
name: "甘肃",
value: Math.round(Math.random() * 1000)
},
{
c: [112.53, 40.87],
name: "山西",
value: Math.round(Math.random() * 1000)
},
{
c: [111.65, 43.82],
name: "内蒙古",
value: Math.round(Math.random() * 0)
},
{
c: [108.95, 34.27],
name: "陕西",
value: Math.round(Math.random() * 1000)
},
{
c: [125.35, 43.88],
name: "吉林",
value: Math.round(Math.random() * 1000)
},
{
c: [119.3, 26.08],
name: "福建",
value: Math.round(Math.random() * 1000)
},
{
c: [106.71, 26.57],
name: "贵州",
value: Math.round(Math.random() * 1000)
},
{
c: [113.23, 23.16],
name: "广东",
value: Math.round(Math.random() * 1000)
},
{
c: [101.74, 36.56],
name: "青海",
value: Math.round(Math.random() * 1000)
},
{
c: [91.11, 29.97],
name: "西藏",
value: Math.round(Math.random() * 1000)
},
{
c: [104.06, 30.67],
name: "四川",
value: Math.round(Math.random() * 1000)
},
{
c: [104.06, 30.67],
name: "宁夏",
value: Math.round(Math.random() * 1000)
},
{
c: [110.35, 20.02],
name: "海南",
value: Math.round(Math.random() * 1000)
},
{
c: [104.06, 30.67],
name: "台湾",
value: Math.round(Math.random() * 1000)
},
{
c: [104.06, 30.67],
name: "香港",
value: Math.round(Math.random() * 1000)
},
{
c: [104.06, 30.67],
name: "澳门",
value: Math.round(Math.random() * 1000)
}
];
this.chinaConfigure();
});
},
beforeDestroy() {
if (!this.chart) {
return;
}
this.chart.dispose();
this.chart = null;
},
methods: {
chinaConfigure() {
const _this = this;
this.chart = echarts.init(this.$refs.myEchart); //这里是为了获得容器所在位置
window.onresize = this.chart.resize;
this.chart.setOption({
title: {
text: "疫情图",
subtext: "数据为虚构",
left: "center"
},
tooltip: {
enterable: true,
trigger: "item",
triggerOn: "click",
position: (point, params, dom, rect, size) => {
let div = getHtmlComponent(params);
dom.innerHTML = "";
//新生成的节点(div)挂载到提示框的dom上面
dom.appendChild(div.$el);
let w = dom.offsetWidth;
let clientW = document.documentElement.clientWidth;
dom.style.transform = "scale(.6)";
//避免提示框超出页面
if (clientW / 2 < rect.x) {
rect.x = rect.x - w / 2;
}
//提示框位置
return [rect.x, rect.y];
}
},
visualMap: {
type: "piecewise",
calculable: true,
itemHeight: 10,
itemWidth: 10,
textGap: 3,
itemGap: 4,
inverse: true,
pieces: [
{
value: 0,
label: "",
color: "#eee",
symbol: `image://${imge}`,
symbolSize: "50"
},
{
min: 100001,
max: 10000000,
color: "#a11",
symbol: "roundRect",
label: "100001-1000000"
},
{
min: 10001,
max: 100000,
color: "#a21",
symbol: "roundRect",
label: "10001-100000"
}, // 不指定 max,表示 max 为无限大(Infinity)。
{
min: 1001,
max: 10000,
color: "#b31",
symbol: "roundRect",
label: "1001-10000"
},
{
min: 101,
max: 1000,
color: "#c71",
symbol: "roundRect",
label: "101-1000"
},
{
min: 11,
max: 100,
color: "#d91",
symbol: "roundRect",
label: "11-100"
},
{
min: 1,
max: 10,
color: "#ed1",
symbol: "roundRect",
label: "1-10"
},
{
value: 0,
label: "",
color: "#eee",
symbol: `image://${imge}`,
symbolSize: "50"
}
],
left: "left",
top: "bottom"
},
toolbox: {
show: true,
orient: "vertical",
left: "right",
top: "center",
feature: {
mark: { show: true },
dataView: { show: true, readOnly: false },
restore: { show: true },
saveAsImage: { show: true }
}
},
geo: {
map: "china",
roam: true
},
series: [
{
// name: '中国新冠病毒各省分布图',
type: "map",
mapType: "china",
roam: false,
label: {
show: false,
normal: {
show: false
},
emphasis: {
show: false
}
},
emphasis: {
itemStyle: {
areaColor: "#ddd",
borderColor: "blue"
}
},
data: [..._this.mapData]
},
{
type: "custom",
coordinateSystem: "geo",
z:10,
data: [
..._this.mapData
],
renderItem: function(params, api) {
let image='';
if(_this.mapData[params.dataIndex].value===0){
image=imge;
}
return {
type: "image",
style: {
image: image,
x: api.coord([
_this.mapData[params.dataIndex].c[0],
_this.mapData[params.dataIndex].c[1]
])[0],
y: api.coord([
_this.mapData[params.dataIndex].c[0],
_this.mapData[params.dataIndex].c[1]
])[1],
width: "10",
height: "10"
}
};
}
}
]
});
}
}
};
</script>
<!-- Add "scoped" attribute to limit CSS to this component only -->
<style scoped>
</style>


