Arthas线上问题排查
Arthas 使用场景
- 是否有一个全局视角来查看系统的运行状况?
- 为什么 CPU 又升高了,到底是哪里占用了 CPU ?
- 运行的多线程有死锁吗?有阻塞吗?
- 程序运行耗时很长,是哪里耗时比较长呢?如何监测呢?
- 这个类从哪个 jar 包加载的?为什么会报各种类相关的 Exception?
- 我改的代码为什么没有执行到?难道是我没 commit?分支搞错了?
- 遇到问题无法在线上 debug,难道只能通过加日志再重新发布吗?
- 有什么办法可以监控到 JVM 的实时运行状态?
下载安装
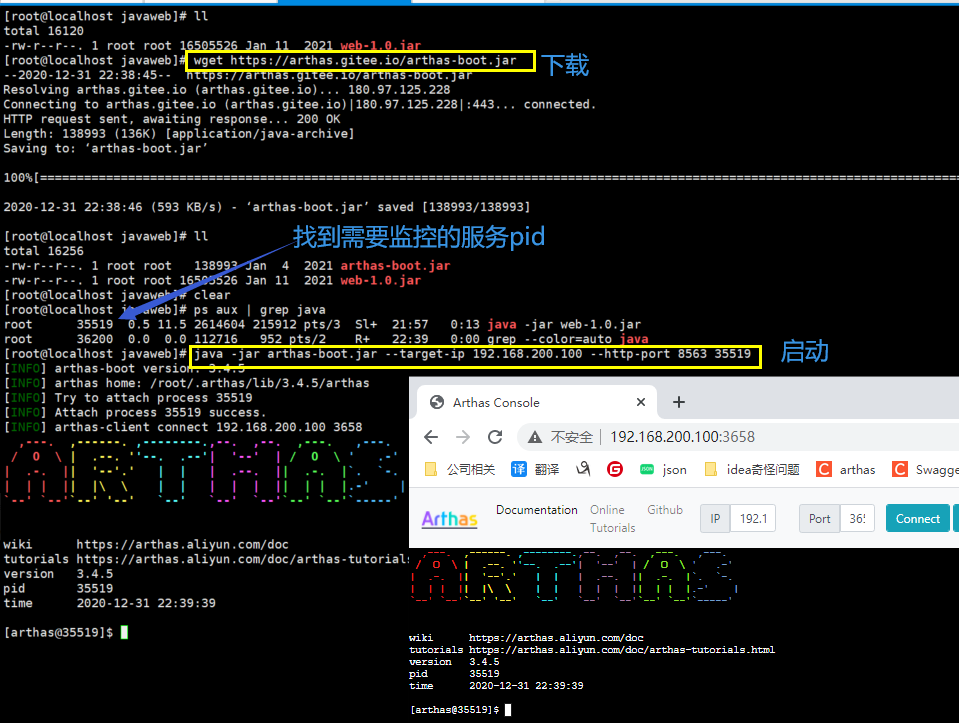
1. 下载 wget https://arthas.gitee.io/arthas-boot.jar
2. 启动 java -jar arthas-boot.jar --target-ip 192.168.200.100 --http-port 8563 PID
如果启动报错下载完整包,解压zip文件,直接启动文件夹的 arthas-boot.jar
[ERROR] Can not read arthas version from: https://arthas.aliyun.com/api/latest_version
[ERROR] Can not find Arthas under local: /root/.arthas/lib and remote repo mirror: aliyun
[ERROR] Unable to download arthas from remote server, please download the full package according to wiki: https://github.com/alibaba/arthas
默认arthas只能本地访问,上面通过指定ip 和 端口就能远程监控了。
常用指令 cls 清空面板 ;exit 退出当前会话 ;stop 关闭arthas
常用命令
后续再补吧
实战演示
定位调用链路
比如现在有一个请求过来,我要查看它的调用链路,每个方法请求时长,以及每个方法的请求参数和返回值来分析问题。


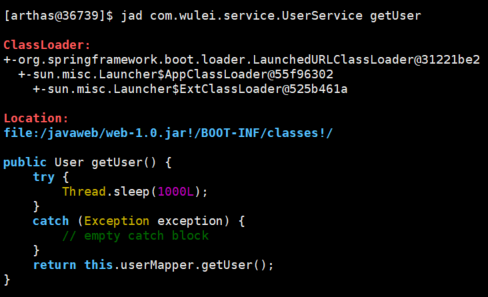
@RestController
public class UserController {
    @Autowired
    private UserService userService;
    @GetMapping("/test")
    public Map test(){
        Map map = new HashMap();
        map.put("code",1);
        map.put("data",userService.getUser());
        map.put("msg","执行成功");
        return map;
    }
}


@Service
public class UserService {
    @Autowired
    private UserMapper userMapper;
    public User getUser(){
        try {
            Thread.sleep(1000);
        }catch (Exception e){
        }
        return userMapper.getUser();
    }
}


@Service
public class UserMapper {
    public User getUser(){
        return new User();
    }
}
import com.wulei.entity.JsonResult;
import org.springframework.web.bind.annotation.GetMapping;
import org.springframework.web.bind.annotation.RestController;
import java.util.HashSet;
import java.util.concurrent.ExecutorService;
import java.util.concurrent.Executors;
@RestController
public class ArthasController {

    private static HashSet hashSet = new HashSet();
    // 线程池,大小1
    private static ExecutorService executorService = Executors.newFixedThreadPool(1);

    /**
     * 模拟 CPU 过高
     */
    @GetMapping("/cpu")
    public JsonResult cpu() {
        // 极度消耗CPU的线程
        Thread thread = new Thread(() -> {
            while (true) {
                System.out.println("cpu start 100");
            }
        });
        // 添加到线程
        executorService.submit(thread);

        // 普通消耗CPU的线程
        for (int i = 0; i < 10; i++) {
            new Thread(() -> {
                while (true) {
                    System.out.println("cpu start");
                    try {
                        Thread.sleep(3000);
                    } catch (InterruptedException e) {
                        e.printStackTrace();
                    }
                }
            }).start();
        }
        return new JsonResult();
    }

    /**
     * 不断的向 hashSet 集合添加数据
     */
    @GetMapping("/add")
    public JsonResult addHashSetThread() {
        // 初始化常量
        new Thread(() -> {
            int count = 0;
            while (true) {
                try {
                    hashSet.add("count" + count);
                    Thread.sleep(10000);
                    count++;
                } catch (InterruptedException e) {
                    e.printStackTrace();
                }
            }
        }).start();
        return new JsonResult();
    }

    /**
     * 模拟线程阻塞,向已经满了的线程池提交线程
     */
    @GetMapping("/thread")
    private JsonResult thread() {
        Thread thread = new Thread(() -> {
            while (true) {
                System.out.println("thread start");
                try {
                    Thread.sleep(3000);
                } catch (InterruptedException e) {
                    e.printStackTrace();
                }
            }
        });
        // 添加到线程
        executorService.submit(thread);
        return new JsonResult();
    }

    /**
     * 死锁
     */
    @GetMapping("/dead")
    private JsonResult deadThread() {
        /** 创建资源 */
        Object resourceA = new Object();
        Object resourceB = new Object();
        // 创建线程
        Thread threadA = new Thread(() -> {
            synchronized (resourceA) {
                System.out.println(Thread.currentThread() + " get ResourceA");
                try {
                    Thread.sleep(1000);
                } catch (InterruptedException e) {
                    e.printStackTrace();
                }
                System.out.println(Thread.currentThread() + "waiting get resourceB");
                synchronized (resourceB) {
                    System.out.println(Thread.currentThread() + " get resourceB");
                }
            }
        });

        Thread threadB = new Thread(() -> {
            synchronized (resourceB) {
                System.out.println(Thread.currentThread() + " get ResourceB");
                try {
                    Thread.sleep(1000);
                } catch (InterruptedException e) {
                    e.printStackTrace();
                }
                System.out.println(Thread.currentThread() + "waiting get resourceA");
                synchronized (resourceA) {
                    System.out.println(Thread.currentThread() + " get resourceA");
                }
            }
        });
        threadA.start();
        threadB.start();
        return new JsonResult();
    }
}
1. trace命令 追踪调用链路,以及每个方法所用的时长。可以写完整的路径名称,也可以使用通配符。

2. jad命令 反编译代码
3. watch命令 观察方法的入参出参及异常

CPU占用过高
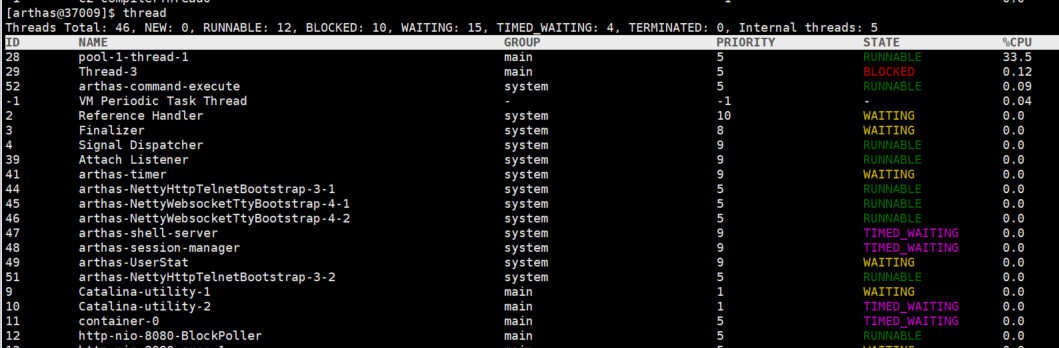
比如线上环境有的线程非常的消耗 CPU性能,那么怎么找出来呢?
1. thread命令 查看cpu的占用率比
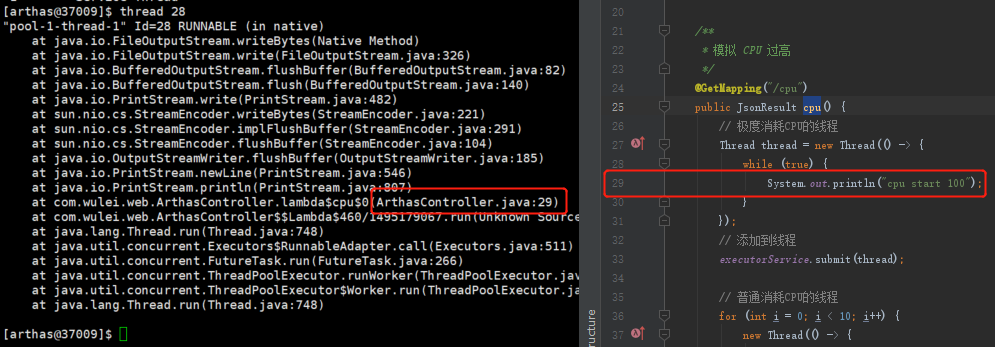
2 thread 线程id 看到线程的详细信息
死锁
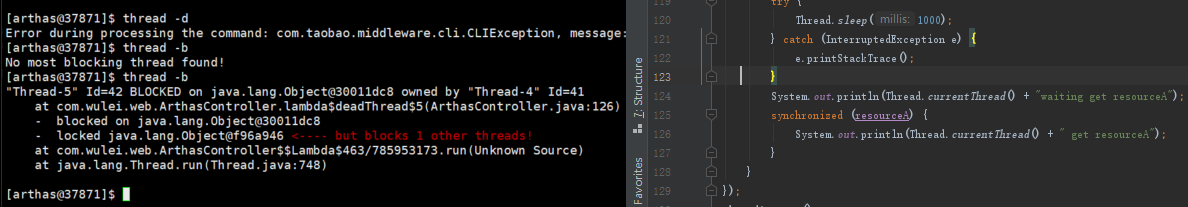
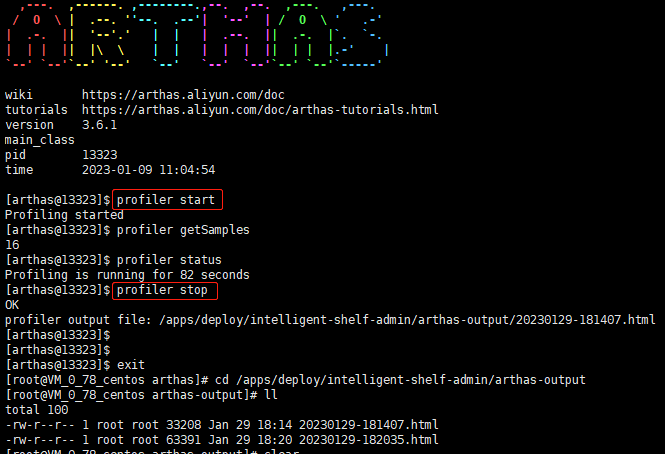
火焰图
1.profiler start 启动采集(默认是CPU)
2.profiler getSamples 查看采样的数量
3.profiler status  查看采样的状态(是否在运行,运行了多久)
4.profiler stop 停止并生成火焰图
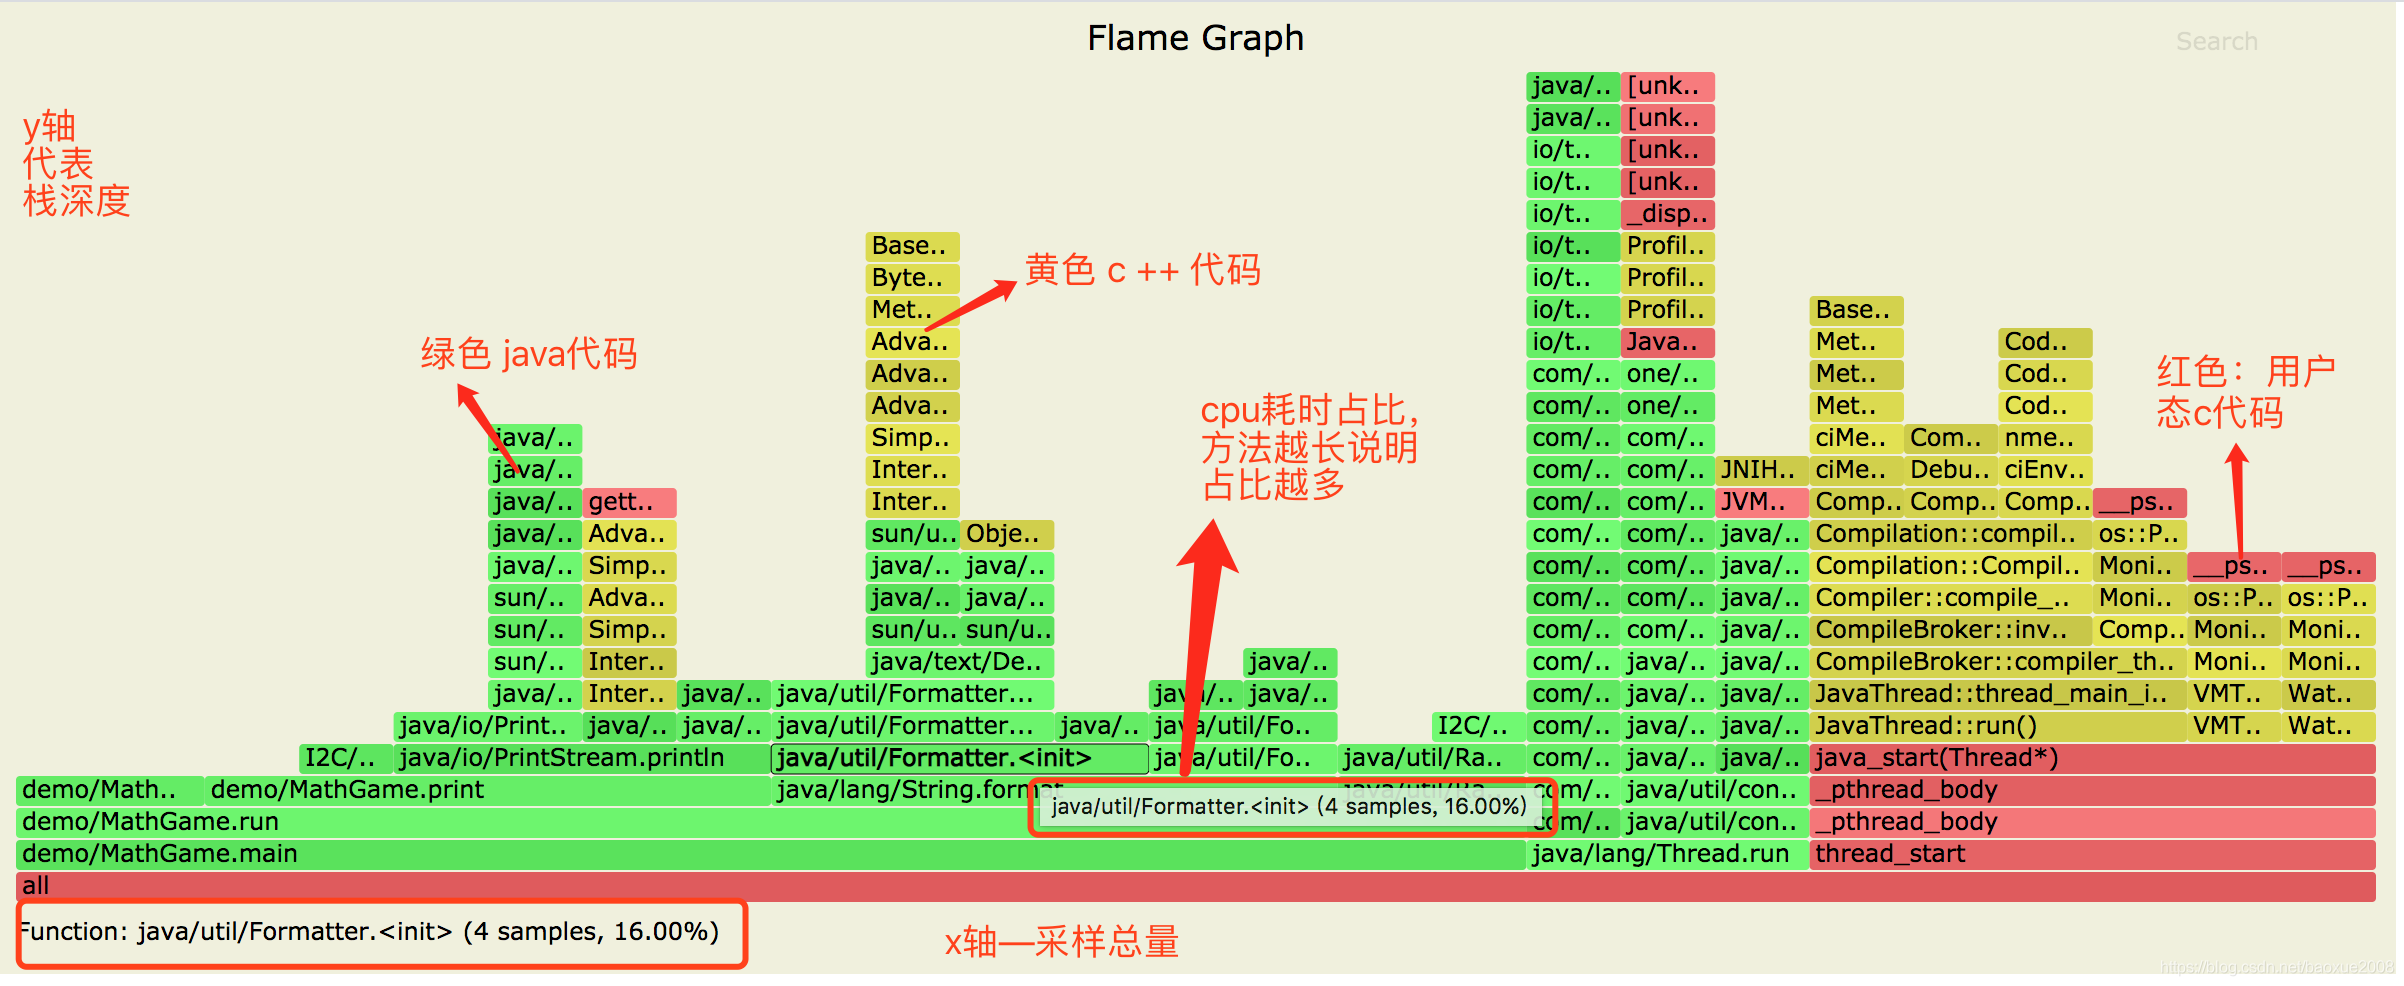
1.这里的x轴代表采样总量(也就是此刻所有执行的耗时cpu的方法)。
这是注意的是x 轴并不代表时间,而是所有的调用方法合并后,按字母顺序排列。
2.Y轴代表方法的调用栈深度,每一层都是一个方法。顶部是正在执行的方法。当然调用栈越深,火焰就越高。
3.鼠标可以点击的选中的每个框就代表了一个栈里的函数,其宽度可以直接理解为CPU时间占比(其实是采样的数量以及与采样总量的占比)。
那么,也就是说占比比较宽的框就表示:
a.该函数运行时间较长(单次时间长)
b.被调用次数较多.(调用频率高)
进而被采样的次数比较多,占用的CPU时间多。
4.另外火焰图:
绿色部分代表Java代码
黄色部分代表JVM C++代码
橙色部分代表内核态C语言代码
红色代表用户态C语言代码
由此可知,火焰图可以直观的帮我们分析CPU占用情况。

 浙公网安备 33010602011771号