python画图学习笔记
之前没少用python画过图,很方便,这里边画边整理一下。
开坑中。
import matplotlib.pyplot as plt
import numpy as np
#显示中文字体
plt.rcParams['font.family'] = 'AR PL UMing CN'
plt.rcParams['axes.unicode_minus'] =False
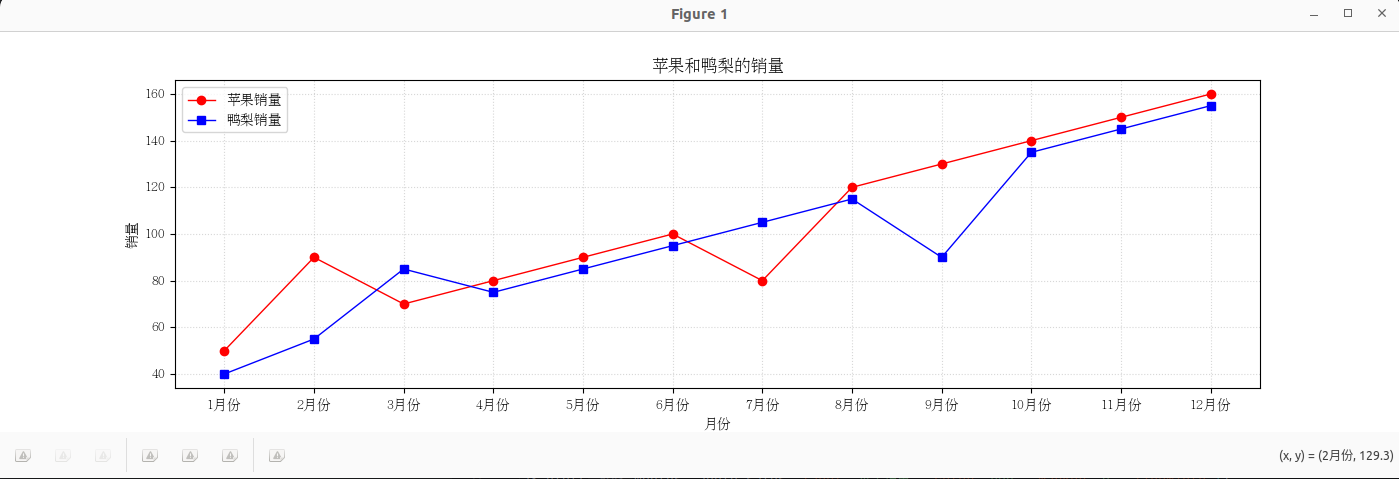
# 月份数据
months = ["{}月份".format(i) for i in range(1,13)]
# 苹果销量数据
apple_sales = [50, 90, 70, 80, 90, 100, 80, 120, 130, 140, 150, 160]
# 鸭梨销量数据
pear_sales = [40, 55, 85, 75, 85, 95, 105, 115, 90, 135, 145, 155]
# 创建图形和轴,figsize表示大小
fig, ax = plt.subplots(figsize=(14,4))
# 绘制苹果销量数据,,label写明哪条线表示什么,color设置线条颜色,marker表示用哪种样式,linewidth设置线条粗细
ax.plot(months, apple_sales, label='苹果销量', color='red', marker='o' ,linewidth=1)
# 绘制鸭梨销量数据
ax.plot(months, pear_sales, label='鸭梨销量', color='blue', marker='s' ,linewidth=1)
# 添加标题和标签
ax.set_title('苹果和鸭梨的销量')
ax.set_xlabel('月份')
ax.set_ylabel('销量')
# 添加图例
ax.legend()
# 显示网格,alpha设置网格透明度
ax.grid(alpha=0.5,linestyle=':')
# 显示图形
plt.show()
自己写的debug小工具,可以参考一下效果学一下语法
tu_debug3.py
#单帧多轮数据绘图 优化一次/两次 更多功能
import os
import json
import tu_acc_xy_v #画acc的文件
timestamp_ns=1732160072601851648
lastCnt=0
cishu=2 #优化一次/两次
cntStepLength=5 #读取的cnt步长
topk=15 #取f排名topk的部分来画图
# 文件夹的路径
folder_path = '/home/mi/record/log/0000_2025-01-15_09-04-07'
nowIndex = -1
data_other='';in_other=0
reading = 0 ;data_xy = [''] * 300;data_acc = [''] * 300;data_phi = [''] * 300;data_f = [''] * 300;data_ind = [''] * 300;data_rank = [''] * 300;
in_imu_xy=0;in_acc=0;in_phi=0;in_f=0;in_ind=0;in_rank=0;
filenames = sorted(os.listdir(folder_path)) # 使用os.listdir()读取文件夹中的所有文件和文件夹名,并按照名称排序
for filename in filenames: # 打印所有文件名
if filename.find('l3pnc_process-stdlog') != -1: #查找名字含有l3pnc_process-stdlog的日志文件
file_path = folder_path + '/' + filename
print('当前处理文件名为'+filename)
#print('文件名路径为' + file_path)
try:
with open(file_path, 'r', encoding='utf-8') as file: # 使用 open() 函数打开文件,指定文件路径和打开模式为读取模式 'r'
for line in iter(file.readline, ''): # 使用 for 循环逐行读取文件内容
if line.strip() == 'now_in_EvaluateNew,timestamp_ns is ' + str(timestamp_ns) + ',cnt_is ' + str(cishu-2): # 选择读 优化一次/优化两次 的数据
lastCnt = 0 # 读取数据的下标
nowIndex = -1 # 存储数据的下标
reading = 0;
data_xy = [''] * 300;
data_acc = [''] * 300;
data_phi = [''] * 300;
data_f = [''] * 300;
data_ind = [''] * 300;
data_rank = [''] * 300;
in_imu_xy=0;
in_acc = 0;
in_phi = 0;
in_f = 0;
in_ind = 0;
in_rank = 0;
if line.strip()== '现在进入了ConvertPrincipledCostEvaluator,timestamp_ns is ' + str(timestamp_ns) : #开始读其他车数据
in_other = 1
continue
if line.strip()== '现在结束了ConvertPrincipledCostEvaluator,timestamp_ns is ' + str(timestamp_ns) : #结束读其他车数据
in_other = 0
continue
if in_other== 1: #其他车数据
data_other = line.strip()
continue
if line.strip()== 'now_in_EvaluateNew,timestamp_ns is ' + str(timestamp_ns) + ',cnt_is ' + str(lastCnt): #开始读数据
reading = 1
nowIndex = nowIndex + 1
continue
if line.strip()== 'EvaluateNew_end,timestamp_ns is ' + str(timestamp_ns) + ',cnt_is ' + str(lastCnt): #结束读数据
reading = 0
lastCnt = lastCnt + cntStepLength
if lastCnt==300: #这里是特殊处理,cnt只到299,要想看最后一个cnt就需要这么做
lastCnt=299
in_imu_xy=in_acc = in_phi = in_f = in_ind = in_rank = 0
continue
if reading == 1:
if line.strip().startswith('现在进入了imu_xy'):
in_imu_xy = 1
continue
if line.strip().startswith('现在结束了imu_xy'):
in_imu_xy = 0
continue
if line.strip().startswith('现在进入了VarAcc_pre'):
in_acc=1
continue
if line.strip().startswith('现在结束了VarAcc_pre'):
in_acc=0
continue
if line.strip().startswith('现在进入了VarPhi_pre'):
in_phi=1
continue
if line.strip().startswith('现在结束了VarPhi_pre'):
in_phi=0
continue
if line.strip().startswith('所有的f值为'):
in_f=1
continue
if line.strip().startswith('现在结束了f'):
in_f=0
continue
if line.strip().startswith('f从小到大所在位置为'):
in_ind=1
continue
if line.strip().startswith('现在结束了ind'):
in_ind=0
continue
if line.strip().startswith('f相应的rank'):
in_rank=1
continue
if line.strip().startswith('现在结束了rank_'):
in_rank=0
continue
if in_imu_xy == 1:
data_xy[nowIndex] = line.strip()
continue
if in_acc==1:
data_acc[nowIndex]=data_acc[nowIndex] + line.strip()
continue
if in_phi==1:
data_phi[nowIndex]=data_phi[nowIndex] + line.strip()
continue
if in_f==1:
data_f[nowIndex]=line.strip()
continue
if in_ind==1:
data_ind[nowIndex]=line.strip()
continue
if in_rank==1:
data_rank[nowIndex]=line.strip()
continue
except FileNotFoundError:
print("文件不存在")
#下面开始处理数据
data_other=data_other[:-2]+data_other[-1:]
data_other=json.loads(data_other)
for i in range (nowIndex+1): #nowIndex是最后一个的index,所以这里要+1
data_xy[i]=data_xy[i][:-2]+data_xy[i][-1:] #删去字符串最后一个不必要的逗号,这个是输出有问题在这里解决的
data_acc[i]=data_acc[i][:-2]+data_acc[i][-1:]
data_phi[i]=data_phi[i][:-2]+data_phi[i][-1:]
data_xy[i]=json.loads(data_xy[i]) #由字符串转为数字list
data_acc[i]=json.loads(data_acc[i])
data_phi[i]=json.loads(data_phi[i])
data_f[i]=[float(x) for x in data_f[i].split()] #先转化为字符串列表,再变成数字列表
data_ind[i] = [int(x) for x in data_ind[i].split()]
data_rank[i]=[float(x) for x in data_rank[i].split()]
tu_acc_xy_v.work(timestamp_ns,cntStepLength,topk,data_xy,data_acc,data_ind,data_other,nowIndex)
tu_acc_xy_v.py
import matplotlib.pyplot as plt
import numpy as np
def Drawing(fig, ax,ax_3d,timestamp_ns,cnt,topk,data_xy,data_acc,data_ind,data_other):
# 横坐标数据
x = ["控制点{}".format(i) for i in range(1, 17)]
# 取前topk绘图,imu_xy的处理在下面
data_acc = [data_acc[i - 1] for i in data_ind[:topk]]
#colors = plt.cm.viridis(np.linspace(0, 1, len(data_acc))) #设置颜色,渐变
colors = ['red'] * 5 + ['lightblue'] * 10 #设置颜色,前5个红色其余蓝色
# 下面画acc
for i in range(len(data_acc)):
ax[0, 0].plot(x, data_acc[i], label='样本' + i.__str__(), color=colors[i], linewidth=1)
ax[0, 0].set_title('时间戳'+timestamp_ns.__str__()+' cnt='+cnt.__str__()+' VarAcc_pre可视化')
ax[0, 0].set_xlabel('控制点')
ax[0, 0].set_ylabel('acc')
ax[0, 0].legend(loc='upper left', fontsize=7, frameon=True)
ax[0, 0].grid(alpha=0.5, linestyle=':')
#处理imu_xy数据,并取前topk绘图
nowX = [];nowY = [];x2=[];y2=[]
for i in range(len(data_xy)):
nowX.append(data_xy[i][0])
nowY.append(data_xy[i][1])
if (i + 1) % 32 == 0:
x2.append(nowX)
y2.append(nowY)
nowX = []
nowY = []
x2 = [x2[i - 1] for i in data_ind[:topk]]
y2 = [y2[i - 1] for i in data_ind[:topk]]
#print(x2[0])
#print(y2[0])
# 处理其他车数据
nowX = [];
nowY = [];
x3 = [];
y3 = []
for i in range(len(data_other)):
nowX.append(data_other[i][0])
nowY.append(data_other[i][1])
if (i + 1) % 32 == 0:
x3.append(nowX)
y3.append(nowY)
nowX = []
nowY = []
print(x3)
print(y3)
# 下面画imu_xy 2d
for i in range(len(y2)):
ax[1, 0].plot(x2[i], y2[i], label='样本' + i.__str__(), color=colors[i], linewidth=1)
for i in range(len(y3)): #其他车
my_circle = plt.Circle((x3[i][0], y3[i][0]), 1, label='其他车' + i.__str__(),color='grey', alpha=1.0) # 圆心,半径,颜色,不透明度
ax[1, 0].add_patch(my_circle) # 画圆
#ax[1, 0].plot(x3[i], y3[i], label='其他车' + i.__str__(), color='grey', linewidth=1,linestyle='--') # 画线
ax[1, 0].set_title('时间戳'+timestamp_ns.__str__()+' cnt='+cnt.__str__()+' imu_xy可视化')
ax[1, 0].set_xlabel('x')
ax[1, 0].set_ylabel('y')
ax[1, 0].legend(loc='upper left', fontsize=7, frameon=True)
ax[1, 0].grid(alpha=0.5, linestyle=':')
# 下面画imu_xy 3d
for i in range(len(y2)):
ax_3d.plot3D(x2[i], y2[i], np.array([i * 0.2 for i in range(17)]+[3.6 + j * 0.4 for j in range(15)]),color=colors[i])
for i in range(len(y3)): # 其他车
ax_3d.plot3D(x3[i], y3[i], np.array([i * 0.2 for i in range(17)]+[3.6 + j * 0.4 for j in range(15)]),color='grey',linestyle='--') #linestyle设置为虚线
ax_3d.set_title('x-y-t')
ax_3d.set_xlabel('x')
ax_3d.set_ylabel('y')
ax_3d.set_zlabel('t')
ax_3d.legend(loc='upper left', fontsize=7, frameon=True)
ax_3d.grid(alpha=0.5, linestyle=':')
def work(timestamp_ns,cntStepLength,topk,data_xy,data_acc,data_ind,data_other,nowIndex):
# 显示中文字体
plt.rcParams['font.family'] = 'AR PL UMing CN'
plt.rcParams['axes.unicode_minus'] = False
# 创建图形和轴,figsize表示大小
fig, ax = plt.subplots(nrows=2, ncols=2, figsize=(18, 10))
ax_3d = fig.add_subplot(1, 1, 1, projection='3d') # 这三个参数分别是子图行数、列数、位置
ax_3d.set_position([0.30, 0.0, 0.9, 0.9]) #四个参数是[left, bottom, width, height]
ax_3d.view_init(elev=35, azim=-154) #设置初始视角角度,(elev=35, azim=-154)较为好,(elev=90, azim=-90)则就变成了和2d一样
plt.ion() # 打开交互模式
for i in range(nowIndex+1):
ax[0, 0].cla() # 清空当前轴对象
ax[0, 1].cla()
ax[1, 0].cla()
ax[1, 1].cla()
ax_3d.cla()
Drawing(fig, ax,ax_3d,timestamp_ns, cntStepLength*i, topk, data_xy[i], data_acc[i], data_ind[i],data_other)
plt.pause(0.5) # 控制动画绘制间隔
plt.ioff() # 关闭交互模式
plt.savefig('output.WEBP')
plt.show()
有读取log、数据处理、动画效果折线图&3d图,效果还挺不错
需要注意一个易错点(上面没用到,别的地方遇到了)
x = [] * 4 # 这个是错误写法
x = [[] for _ in range(4)] # 这个是正确写法


【推荐】国内首个AI IDE,深度理解中文开发场景,立即下载体验Trae
【推荐】编程新体验,更懂你的AI,立即体验豆包MarsCode编程助手
【推荐】抖音旗下AI助手豆包,你的智能百科全书,全免费不限次数
【推荐】轻量又高性能的 SSH 工具 IShell:AI 加持,快人一步
· 阿里最新开源QwQ-32B,效果媲美deepseek-r1满血版,部署成本又又又降低了!
· 开源Multi-agent AI智能体框架aevatar.ai,欢迎大家贡献代码
· Manus重磅发布:全球首款通用AI代理技术深度解析与实战指南
· 被坑几百块钱后,我竟然真的恢复了删除的微信聊天记录!
· AI技术革命,工作效率10个最佳AI工具
2021-12-20 第四届“传智杯”全国大学生IT技能大赛(初赛同步) 小卡与质数2 数论