
ggplot2 theme相关设置—矩形设置(rect)
在主题设置中,rect设置主要用于设置图例和面板
element_rect(fill = NULL, colour = NULL, size = NULL, linetype = NULL, color = NULL)
参数也相对简单,基本上是常用的参数,从设置来看,灵活性还是很高的。
下面看些例子:
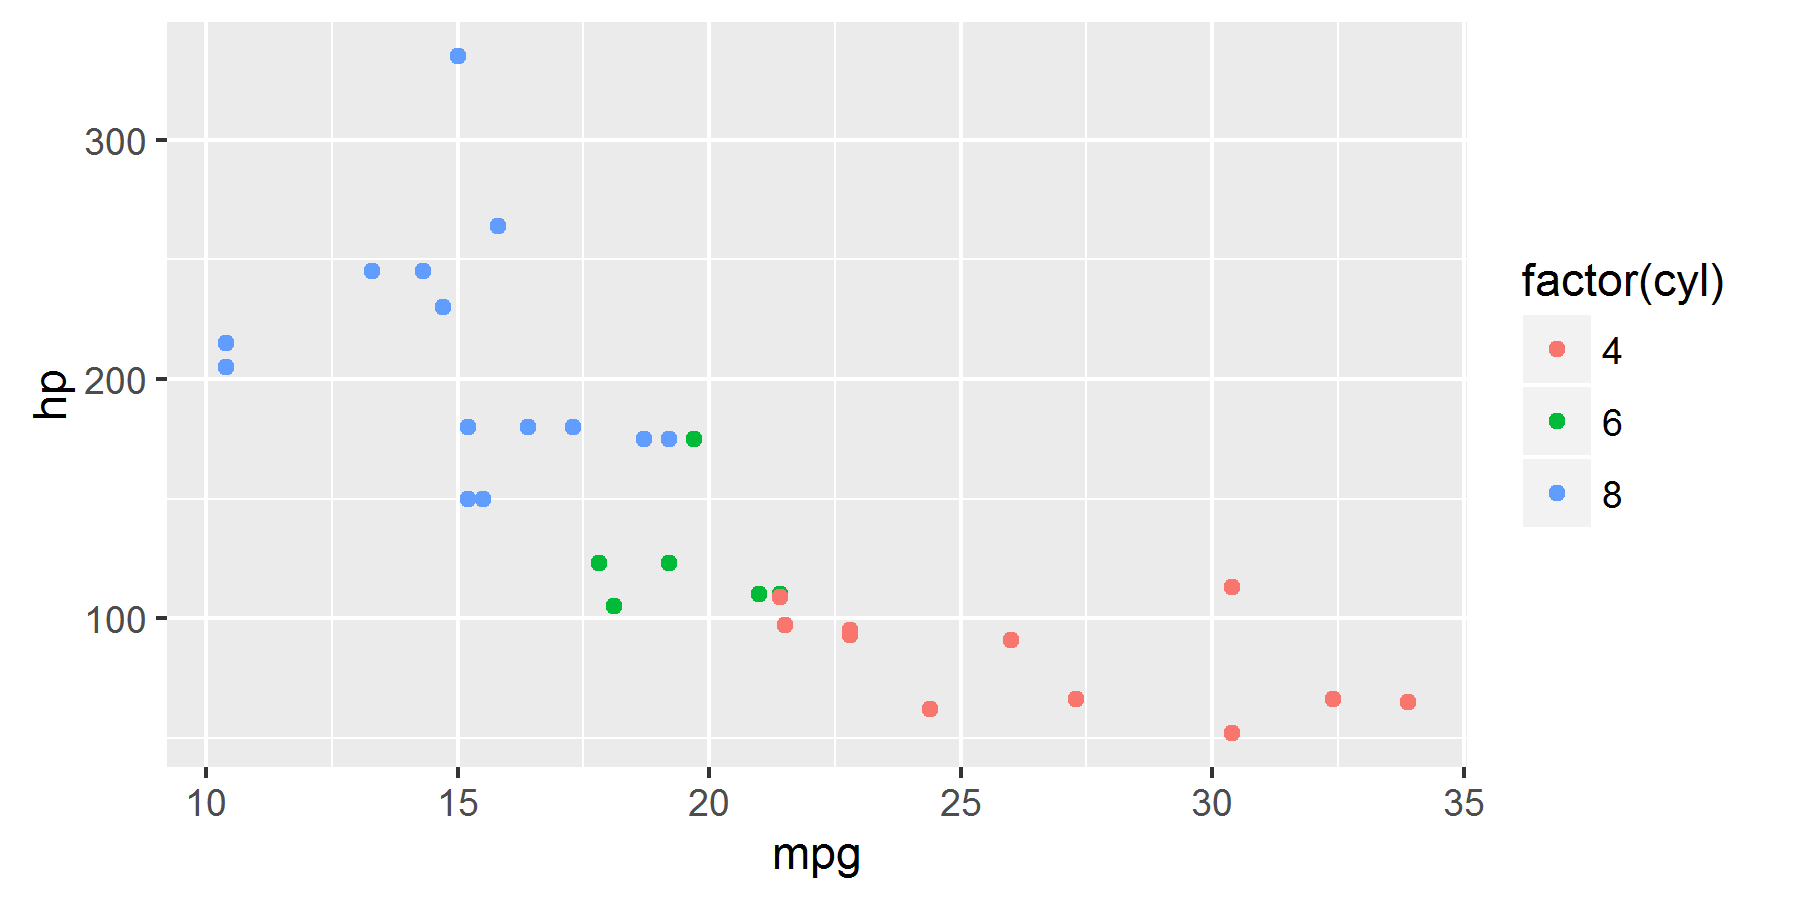
library(ggplot2)
p<-ggplot(mtcars,aes(mpg,hp,colour=factor(cyl)))+geom_point()
p
p+theme(legend.margin=unit(0.3,"inches"),
        legend.key=element_rect(fill="white",color="blue",size=2),
        legend.key.width=unit(0.5,"inches"),
        legend.key.height=unit(0.5,"inches"),
        legend.direction="horizontal",
        legend.position="top")
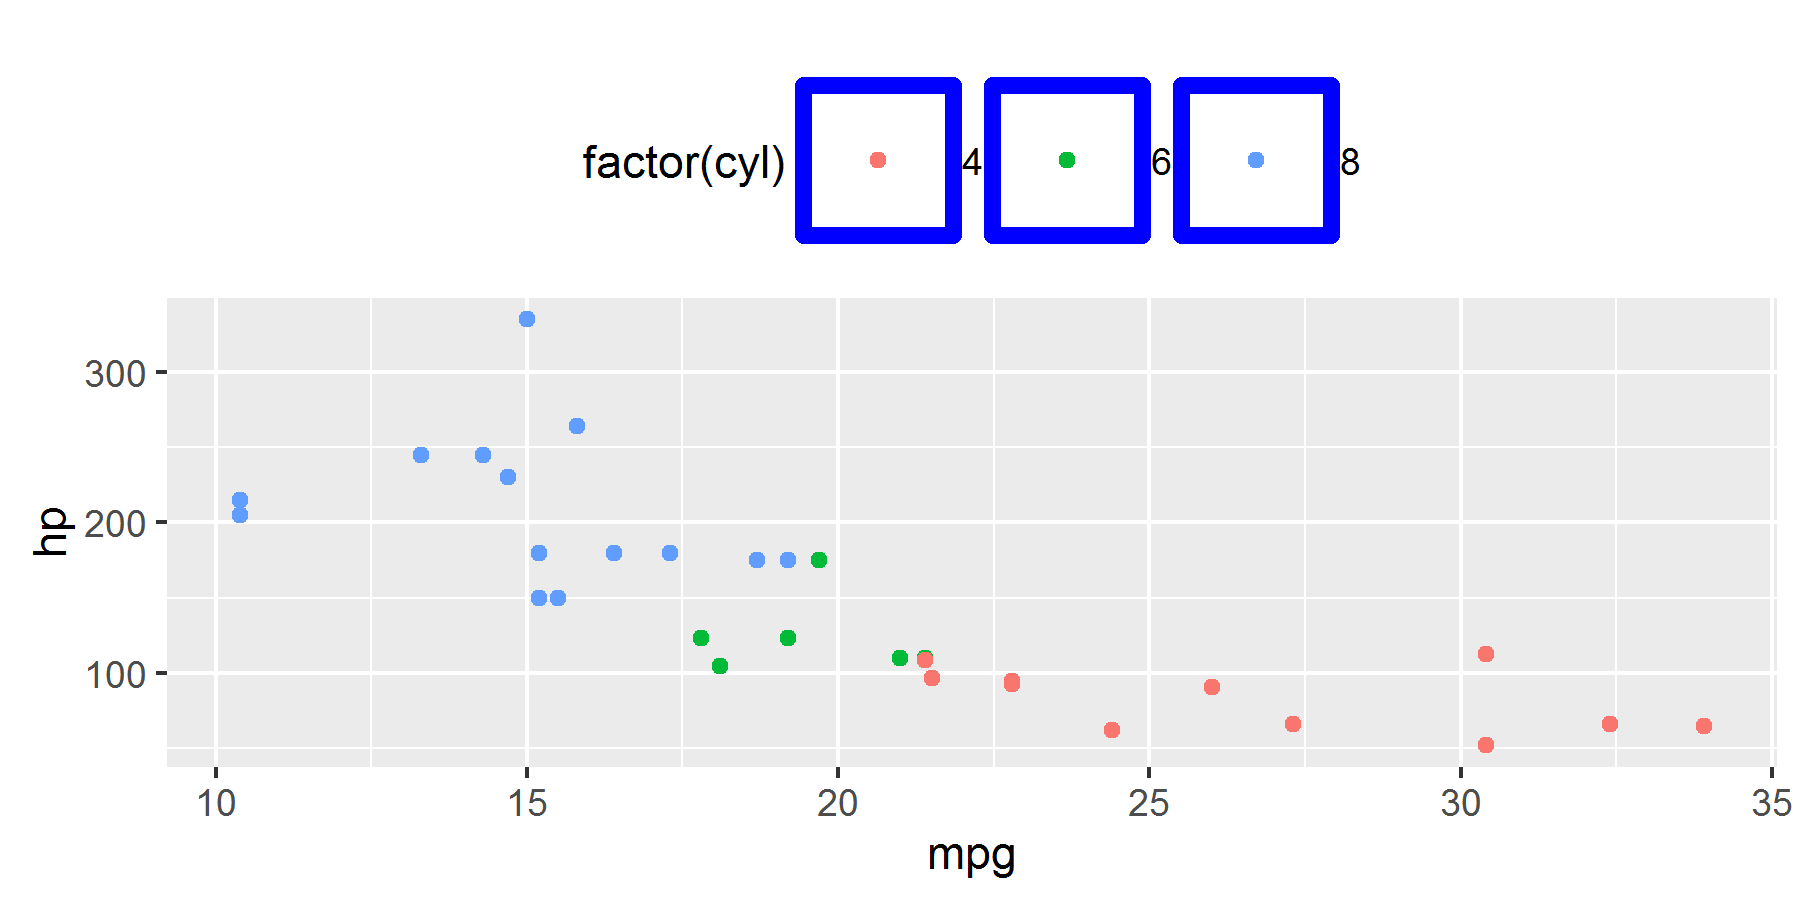
虽然上图画得不美观,但我们可以很清楚的了解每个参数的作用
除了element_rect调整的图例外观以外,
这里通过legend.margin调整图例与图形的间的距离
通过legend.key.width和legend.key.height来调整图例的宽度和高度
通过legend.direction来调整图例是水平还是垂直的,参数值为"horizontal" 或 "vertical"
通过legend.position来调整图例所在的位置,参数值为"left", "right", "bottom", "top"
p+theme(panel.background=element_rect(fill="white",color="grey50"),
        panel.grid=element_line(color="grey50",size=2),
        panel.grid.major=element_line(size=1,linetype =3,color="grey70"),
        panel.grid.minor=element_line(size=1,linetype =3,color="grey70"))
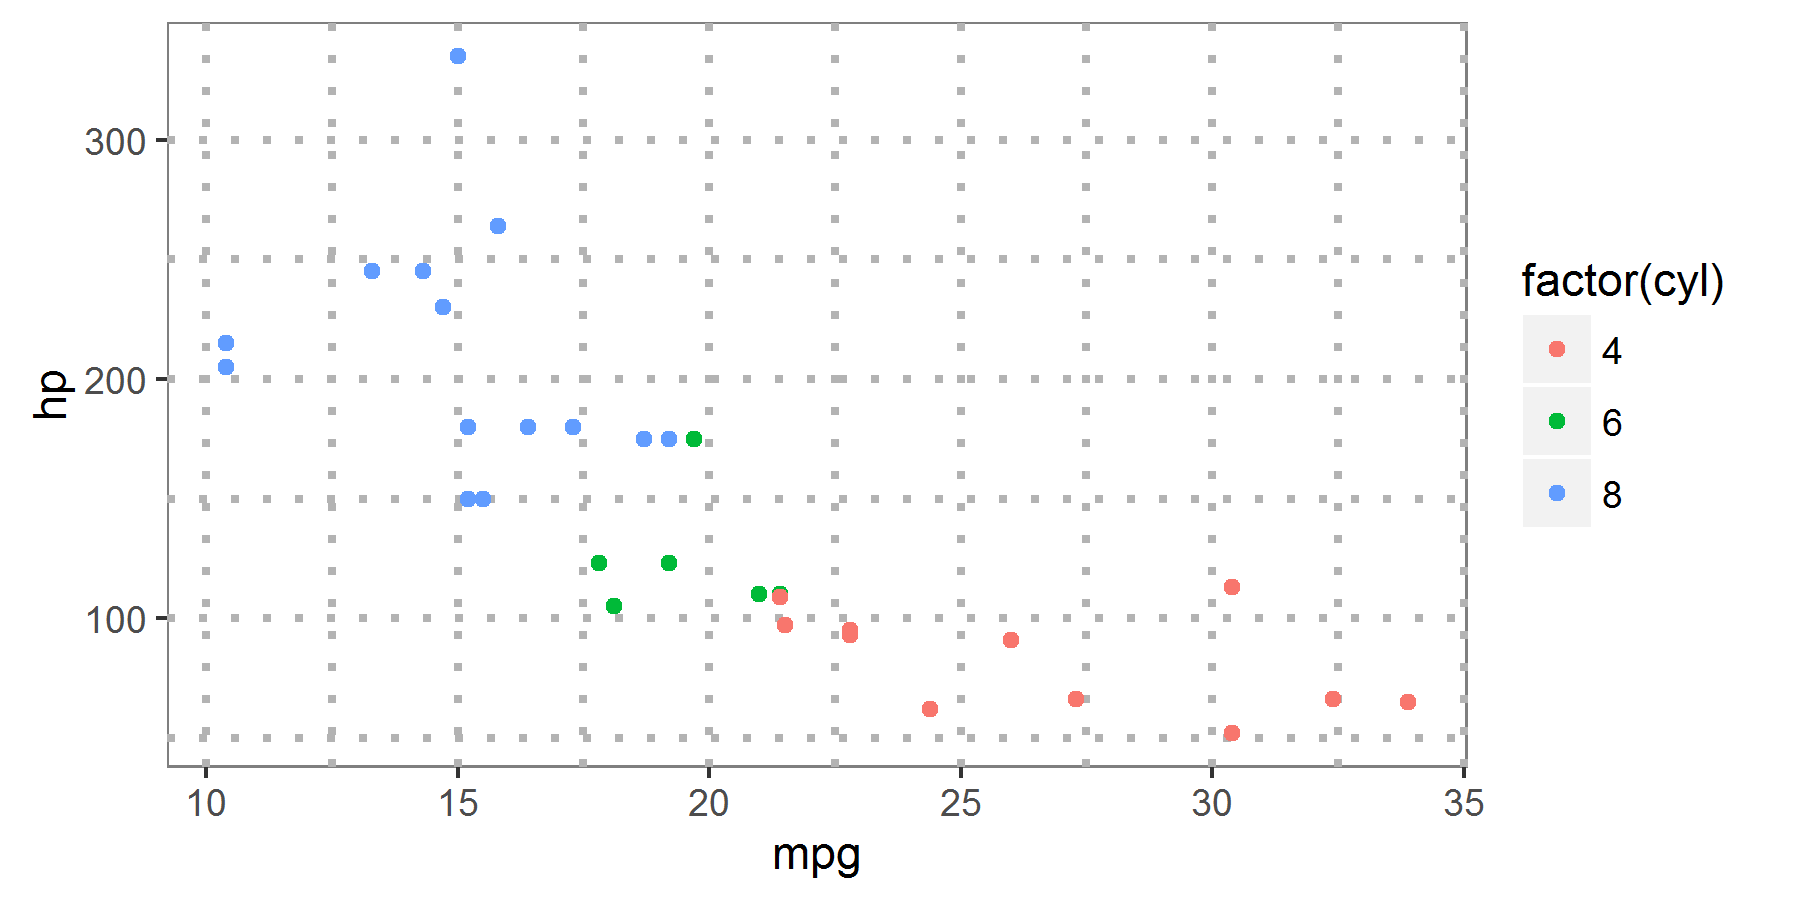
可以看到整个面板的颜色变成白色了,这里是通过panel.background进行调整,面板颜色是用参数fill的颜色进行调整,边框变成灰色通过color调整
p+theme(plot.background=element_rect(color="blue",fill="grey60"))

最后我们还可以对整个外部的面板进行调整。
从以上的调整可以看出,element_rect 主要用于图例和面板的调整。

 浙公网安备 33010602011771号