ggplot2 theme相关设置—文本调整
在geom设置和scale设置之后,要想把图画的漂亮,theme设置是比不可少的
在theme 设置中element_text()是一项很重要的内容
element_text(family = NULL, face = NULL, colour = NULL, size = NULL, hjust = NULL, vjust = NULL, angle = NULL, lineheight = NULL)
参数family 表示字体样式
参数face 表示字体格式,可取值("plain", "italic", "bold", "bold.italic")
参数colour 表示字体颜色
参数size 表示字体大小
参数hjust 用于调整水平距离,可调整范围0到1之间
参数vjust 用于调整垂直距离,可调整范围0到1之间
参数angle 用于调整字体的倾斜度,调整范围0到360
参数lineheight 表示线条高度
下面来看一个具体的例子:
library(ggplot2)
p<-ggplot(economics,aes(pop,unemploy))+geom_point()
p+labs(x="人口",y="失业率",title="经济调查报告")

接下来我们利用element_text()对文字进行调整
windowsFonts(myFont = windowsFont("微软雅黑"))

p+labs(x="人口",y="失业率",title="经济调查报告")+
  theme(title=element_text(family="myFont",size=12,color="red",
                           face="italic",hjust=0.2,lineheight=0.2))

经历一番调整后,标题上的字体跟原来相比变了很多。
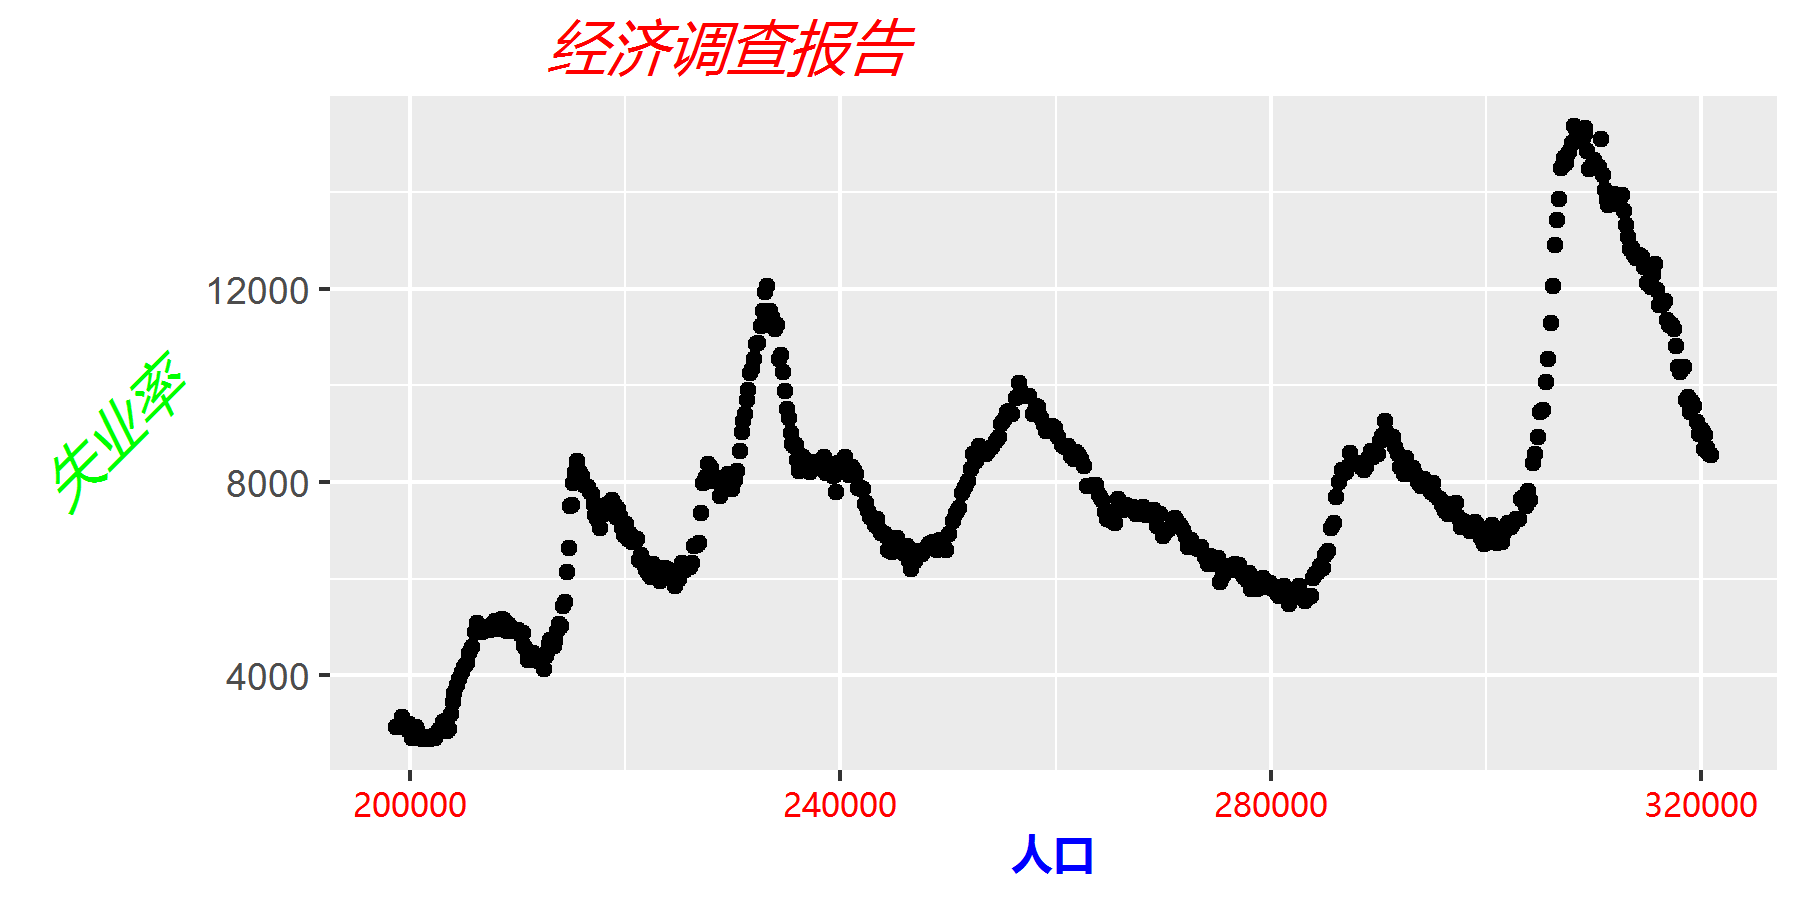
另外,上面直接使用title设置,它会改变包括图表标题,x轴,y轴以及图例的文本样式。如果只是更改某个样式,可以使用单独设置。比如
p+labs(x="人口",y="失业率",title="经济调查报告")+
  theme(title=element_text(family="myFont",size=12,color="red",
                           face="italic",hjust=0.2,lineheight=0.2),
        axis.title.x=element_text(size=10,face="bold",color="blue",hjust=0.5),
        axis.title.y=element_text(size=14,color="green",hjust=0.5,angle=45),
        axis.text.x=element_text(family="myFont",size=8,color="red") )

可以很明显的看到文字又出现了较大的变化,其中axis.title.x代表x轴标题,而axis.text.x则表示x轴刻度标签。


 浙公网安备 33010602011771号