《机器学习实战》线性回归
一.最小平方差进行线性回归
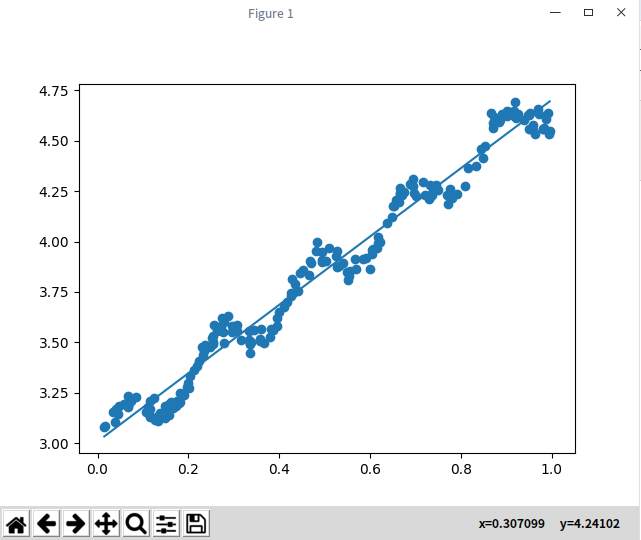
比较简单,就是进行残差平方和最小来进行,其中这里的差为全局最优,相当于全局梯度下降法。
也可以参考之前写的博文:http://www.cnblogs.com/wjy-lulu/p/7759515.html
 1 import numpy as np
 2
 3 def loadData(filename):
 4     numFeat = len(open(filename).readline().split('\t')) - 1
 5     dataMat = []
 6     labelMat = []
 7     fr = open(filename)
 8
 9     for line in fr.readlines():
10         linArr = []
11         curline = line.strip().split('\t')
12         for i in range(numFeat):
13             linArr.append(float(curline[i]))
14         dataMat.append(linArr)
15         labelMat.append(float(curline[-1]))
16     return dataMat, labelMat
17 def standRegres(xArr,yArr):
18     xMat = np.mat(xArr)
19     yMat = np.mat(yArr).T
20     xTx = xMat.T * xMat
21     if (np.linalg.det(xTx)==0.0):#det求解的值|A|
22         print("This matrix is singular: cannot do inverse")
23         return
24     ws = xTx.I * (xMat.T*yMat)#mat.I求解矩阵的逆
25     return ws
26
27
main.py
 1 import logist
 2 import numpy as np
 3 import matplotlib.pyplot as plt
 4
 5 if __name__ == '__main__':
 6     xArr, yArr = logist.loadData("ex0.txt")
 7     ws = logist.standRegres(xArr,yArr)
 8     xMat = np.mat(xArr);yMat = np.mat(yArr)
 9     xCopy = xMat.copy()
10     xCopy = np.sort(xCopy,0)#对X进行排序之后再进行画图,列排序
11     yHat = xCopy*ws
12     fg = plt.figure()
13     ax = fg.add_subplot(111)
14     ax.scatter(xMat[:,1].flatten().tolist()[0],yMat.T[:,0].flatten().tolist()[0])
15     ax.plot(xCopy[:,1],yHat)
16     plt.show()
17
18
19
20     print("hello deepin")
21     print(ws);

二.局部加权线性回归
理论部分请看之前笔记:http://www.cnblogs.com/wjy-lulu/p/7759515.html
作者:影醉阏轩窗
-------------------------------------------
个性签名:衣带渐宽终不悔,为伊消得人憔悴!
如果觉得这篇文章对你有小小的帮助的话,记得关注再下的公众号,同时在右下角点个“推荐”哦,博主在此感谢!


