

D3: D3散点图测试大数据分批渲染
一: 准备工作:
d3.js : /static/js/d3.min.js
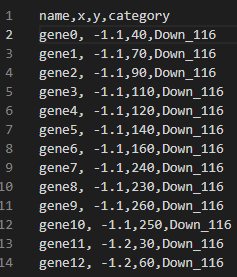
test.csv : /static/data/test.csv
读取测试数据类似下图:
二: 代码如下
<!DOCTYPE html>
<html lang="en">
<head>
    <meta charset="UTF-8">
    <meta http-equiv="X-UA-Compatible" content="IE=edge">
    <meta name="viewport" content="width=device-width, initial-scale=1.0">
    <title>D3散点图</title>
    <script src="./static/js/d3.min.js"></script>
</head>
<body>
    <svg width="800" height="400" id="mainSvg" class="svg"></svg>

    <script>
        const svg = d3.select('#mainSvg');
        const width = +svg.attr('width');
        const height = +svg.attr('height');
        const margin = { top: 60, right: 30, bottom: 60, left: 80 };
        const innerWidth = width - margin.left - margin.right;
        const innerHeight = height - margin.top - margin.bottom;

        let xScale, yScale;
        let sequential;
        // x轴y轴标题
        const xAxisLabel = 'log2';
        const yAxisLabel = '-log10';

        let xValue = d => d['x'];
        let yValue = d => d['y'];
        let duration = 500;
        // 根据类型设定颜色
        var color = {
            "Down_116": "#1E90FF",
            "no-DEGS_139": "#A9A9A9",
            "Up_139": "#FF0000",
        }

        const renderInit = function (data) {
            // 设置x坐标
            xScale = d3.scaleLinear()
                .domain(d3.extent(data, xValue))
                .range([0, innerWidth]);

            // 设置y坐标
            yScale = d3.scaleLinear()
                .domain(d3.extent(data, yValue).reverse())
                .range([0, innerHeight]);

            const g = svg.append('g')
                .attr('transform', `translate(${margin.left}, ${margin.top})`)
                .attr('id', 'mainGroup');

            // Adding axes;
            const yAxis = d3.axisLeft(yScale);
            const xAxis = d3.axisBottom(xScale);

            // 加入y轴
            let yAxisGroup = g.append('g').call(yAxis)
                .attr('id', 'yaxis');
            yAxisGroup.append('text')
                .attr('font-size', '2em')
                .attr('transform', `rotate(-90)`)
                .attr('x', -innerHeight / 2)
                .attr('y', -60)
                .attr('fill', '#333333')
                .text(yAxisLabel)
                .attr('text-anchor', 'middle') // Make label at the middle of axis.
            // yAxisGroup.selectAll('.domain').remove(); // we can select multiple tags using comma to seperate them and we can use space to signify nesting;

            // 加入x轴
            let xAxisGroup = g.append('g').call(xAxis)
                .attr('transform', `translate(${0}, ${innerHeight})`)
                .attr('id', 'xaxis');
            xAxisGroup.append('text')
                .attr('font-size', '2em')
                .attr('y', 50)
                .attr('x', innerWidth / 2)
                .attr('fill', '#333333')
                .text(xAxisLabel);
            // xAxisGroup.selectAll('.domain').remove();
        };

        const renderUpdate = function(data){
            const g = d3.select('#mainGroup');
            let circleUpdates = g.selectAll('circle').data(data,d=>d['name']);
            // console.log(data)
            let circleEnter = circleUpdates.enter().append('circle')
                .attr('cx', d => xScale(xValue(d)))
                .attr('cy', d => yScale(yValue(d)))
                .attr('r', 3)
                .attr('fill', d => color[d['category']])
                .attr('opacity', 0.8)
            // console.log(circleEnter)
            circleUpdates.merge(circleEnter)
                .transition().ease(d3.easeLinear).duration(duration)
                .attr('cx', d => xScale(xValue(d)))
                .attr('cy', d => yScale(yValue(d)));
        }
        // 拆分数组
        const splitArray = function (arr, len){
            var a_len = arr.length;
            var result = [];
            for(var i=0;i<a_len;i+=len){
                result.push(arr.slice(i,i+len));
            }
            return result;}

        d3.csv('/static/data/test.csv').then(data=>{
            // 数据处理
            data.forEach(d => {
                d['x'] = +(d['x']);
                d['y'] = +(d['y']);
            });

            sequential = splitArray(data,5000);

            // 初始化
            renderInit(data);

            // 直接加载
            // renderUpdate(data);
            console.log('开始:')
            console.log(new Date());
            // 循环加载
            let c = 0;
            let intervalId = setInterval(() => {
                if (c >= sequential.length) {
                    console.log('结束了')
                    console.log(new Date());
                    clearInterval(intervalId);
                } else {
                    // console.log(data[c]);
                    // renderUpdate([data[c]]);
                    renderUpdate(sequential[c]);
                    c = c + 1;
                }
            }, duration)
        });
    </script>
</body>
</html>

