echars相关
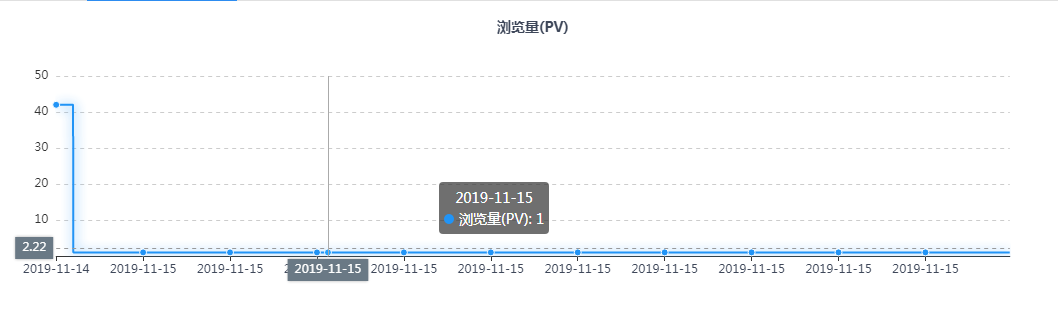
普通echart:
option初始化:
eventEchart: null,
eventEchartOption: {
        title: {
          text: '浏览量(PV)',
          textStyle: {
            color: '#3E4759',
            textAlign: 'center',
            fontSize: 14
          },
          x: 'center'
        },
        tooltip: {
          trigger: 'axis',
          axisPointer: {
            type: 'cross',
            label: {
              backgroundColor: '#6a7985'
            }
          }
        },
        xAxis: [
          {
            type: 'category',
            boundaryGap: false,
            axisLabel: {
              show: true,
              textStyle: {
                fontSize: 12,
                color: '#3E4759'
              }
            },
            data: []
          }
        ],
        yAxis: [
          {
            type: 'value',
            splitLine: { // 网格线
              lineStyle: {
                type: 'dashed' // 设置网格线类型 dotted:虚线   solid:实线
              },
              show: true // 隐藏或显示
            },
            axisLine: { show: false },
            axisTick: { show: false }
          }
        ],
        series: [
          {
            name: '浏览量(PV)',
            type: 'line',
            data: [],
            itemStyle: {
              color: 'rgb(33,148,246)',
              borderWidth: 1,
              borderColor: '#FFF'
            },
            symbol: 'circle',
            symbolSize: 7,
            lineStyle: {
              color: 'rgb(33,148,246)',
              shadowBlur: 12,
              shadowColor: 'rgb(33,148,246,0.9)',
              shadowOffsetX: 1,
              shadowOffsetY: 1
            }
          }
        ]
      },
初始化echart:
 handleEchart () {
      if (this.eventEchart) {
        // 赋值
        this.eventEchart.setOption(this.eventEchartOption)
      } else {
        // 初始化
        this.$nextTick(() => {
          this.eventEchart = this.$echarts.init(this.$refs.eventEchart)
          this.eventEchart.setOption(this.eventEchartOption)
          window.addEventListener('resize', this.eventEchart.resize)
        })
      }
参数变化:
      this.eventEchartOption.xAxis[0].data = [...data]this.eventEchartOption.series[0].data = [...data]this.eventEchartOption.title.text = '浏览量(PV)'
          this.eventEchartOption.series[0].name = '浏览量(PV)'
          this.eventEchart && this.eventEchart.setOption(this.eventEchartOption)
效果:
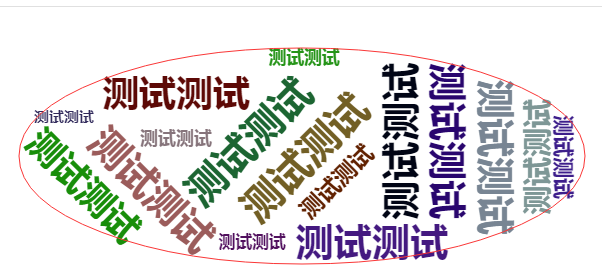
词云图:
option 初始化:
wcEchart: null,
      wcEchartOption: {
        series: [{
          type: 'wordCloud',
          // The shape of the "cloud" to draw. Can be any polar equation represented as a
          // callback function, or a keyword present. Available presents are circle (default),
          // cardioid (apple or heart shape curve, the most known polar equation), diamond (
          // alias of square), triangle-forward, triangle, (alias of triangle-upright, pentagon, and star.
          shape: 'star',
          // A silhouette image which the white area will be excluded from drawing texts.
          // The shape option will continue to apply as the shape of the cloud to grow.
          // Folllowing left/top/width/height/right/bottom are used for positioning the word cloud
          // Default to be put in the center and has 75% x 80% size.
          left: 'center',
          top: 'center',
          width: '70%',
          height: '80%',
          right: null,
          bottom: null,
          // Text size range which the value in data will be mapped to.
          // Default to have minimum 12px and maximum 60px size.
          sizeRange: [15, 40],
          // Text rotation range and step in degree. Text will be rotated randomly in range [-90, 90] by rotationStep 45
          rotationRange: [-90, 90],
          rotationStep: 45,
          // size of the grid in pixels for marking the availability of the canvas
          // the larger the grid size, the bigger the gap between words.
          gridSize: 8,
          // set to true to allow word being draw partly outside of the canvas.
          // Allow word bigger than the size of the canvas to be drawn
          drawOutOfBound: false,
          // Global text style
          textStyle: {
            normal: {
              fontFamily: 'sans-serif',
              fontWeight: 'bold',
              // Color can be a callback function or a color string
              color: function () {
                // Random color
                return 'rgb(' + [
                  Math.round(Math.random() * 160),
                  Math.round(Math.random() * 160),
                  Math.round(Math.random() * 160)
                ].join(',') + ')'
              }
            },
            emphasis: {
              shadowBlur: 10,
              shadowColor: '#333'
            }
          },
词云图初始化:
handleEchart () {
      if (this.wcEchart) {
        // 赋值
        this.wcEchart.setOption(this.wcEchartOption)
      } else {
        // 初始化
        this.$nextTick(() => {
          const image = new Image()
          const that = this
          image.src = require('../../assets/images/statistics/icon_data_word_cloud.png') // 轮廓图,html可以直接写路径,vue不行
          this.wcEchartOption.series[0].maskImage = image
          this.wcEchart = this.$echarts.init(this.$refs.wcEchart)
          image.onload = function () {
            that.wcEchart.setOption(that.wcEchartOption)
          }
          window.addEventListener('resize', this.wcEchart.resize)
        })
      }
    },
数据变化:
this.wcEchartOption.series[0].data = this.data.map((item, index) => {
        return {
          name: item.name,
          value: index + 1
        }
      })
      this.$nextTick(() => {
        this.handleEchart()
      })
效果:
椭圆背景图