SpringCloud(Greenwich版)Hystrix Dashboard可视化监控数据
推荐以下稳定版本号:
Spring Boot: 2.1.9.RELEASE
1)build.gradle项目依赖
创建gradle模块hystrix-monitoring并添加eureka客户端与hystrix-dashboard依赖,hystrix与actuator在仪表盘监控项目中不需要引入,能省就省嘛 (code)
dependencies {
    compile group: 'org.springframework.cloud', name: 'spring-cloud-starter-netflix-eureka-client'

    compile group: 'org.springframework.cloud', name: 'spring-cloud-starter-netflix-hystrix-dashboard'
}

server:
  port: 1000
spring:
  application:
    name: hystrix-monitoring
eureka:
  instance:
    hostname: localhost
  client:
    fetch-registry: true
    register-with-eureka: true
    service-url:
      defaultZone: http://localhost:8761/eureka/
在启动类添加@EnableHystrixDashboard注解,标记开启断路器仪表盘功能

package org.wesson.springcloud.hystrix;

import org.springframework.boot.SpringApplication;
import org.springframework.boot.autoconfigure.SpringBootApplication;
import org.springframework.cloud.client.discovery.EnableDiscoveryClient;
import org.springframework.cloud.netflix.hystrix.dashboard.EnableHystrixDashboard;

@EnableHystrixDashboard
@EnableDiscoveryClient
@SpringBootApplication
public class HystrixMonitoringApplication {

    public static void main(String[] args) {
        SpringApplication.run(HystrixMonitoringApplication.class, args);
    }

}
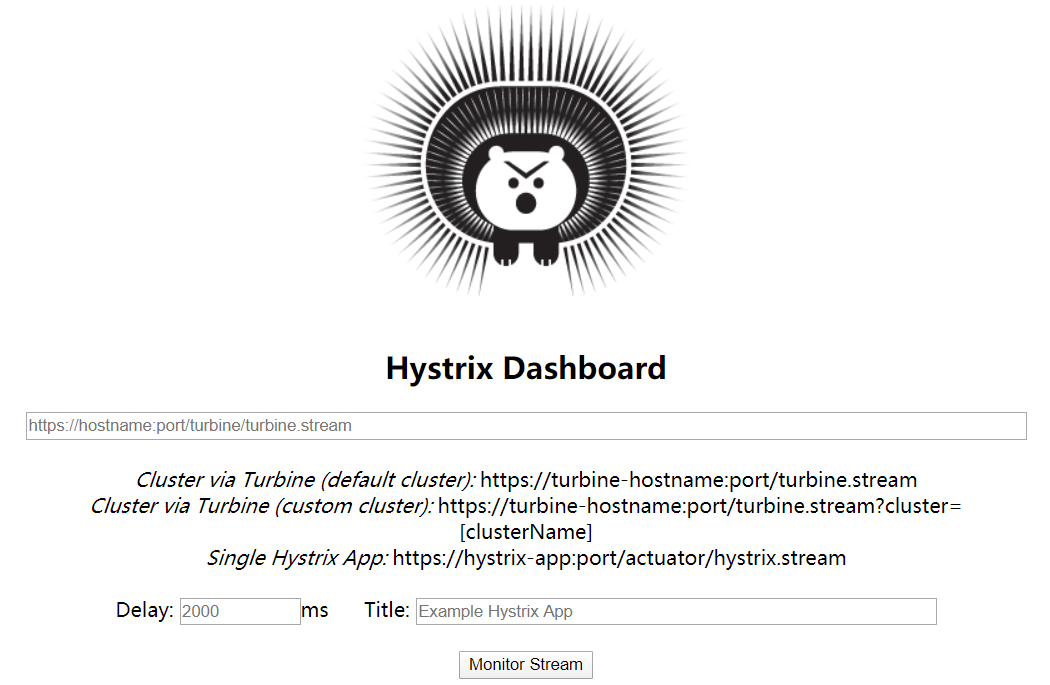
Step1:访问http://localhost:8761/,注册到的服务如下图:

此图是 Hystrix Dashboard 的监控首页,该页面中并没有具体的监控信息。
从页面文字内容中我们可以知道,Hystrix Dashboard 支持三种不同的监控方式,分别是:默认的集群监控、自定义集群监控与单体应用的监控。在这次示例中我们只使用单体应用的监控,通过 URL https://hystrix-app:port/actuator/hystrix.stream 开启,实现对具体某个服务实例的监控。
Hystrix Dashboard 的监控首页还有其他两个参数分别是 Delay 和 Title:
-
Delay:
-
Title:该参数会对应点击 Monitor Stream 之后监控页面头部标题 (Hystrix Stream),默认会使用具体监控实例的 URL,可以通过配置该信息来展示更适合的标题。
三、Fegin整合Hystrix Dashboard
1)补充build.gradle项目依赖
compile group: 'org.springframework.boot', name: 'spring-boot-starter-actuator'
2)补充application.yaml配置文件
management:
  endpoints:
    web:
      exposure:
        include: 'hystrix.stream'
3)补充启动类ApiFeginApplication.java
@EnableCircuitBreaker
Step1:运行 eureka-server 启动类,端口为8761
Step2:运行 provider-service 启动类,端口为8081
Step3:运行 api-fegin 启动类,端口为9090
Step4:运行 hystrix-monitoring 启动类,端口为1000
Step5:先访问http://localhost:8761/,结果如下图:

Step6:多次访问http://localhost:9090/client/info,返回结果如下:
Step7:本章第二节测试访问过Hystrix Dashboard首页,并填写 Input 框信息如下:

-
实心圆:包含两个含义,颜色表示实例的健康程度,健康程度从绿色、黄色、橙色、红色递减;大小则根据请求流量的大小发生变化,流量越大则实心圈越大,反之则越小。
-
曲线:用来记录2分钟内流量的相对变化,可以通过它来观察流量的上升和下降趋势。


