import tensorflow as tf
# Build your graph
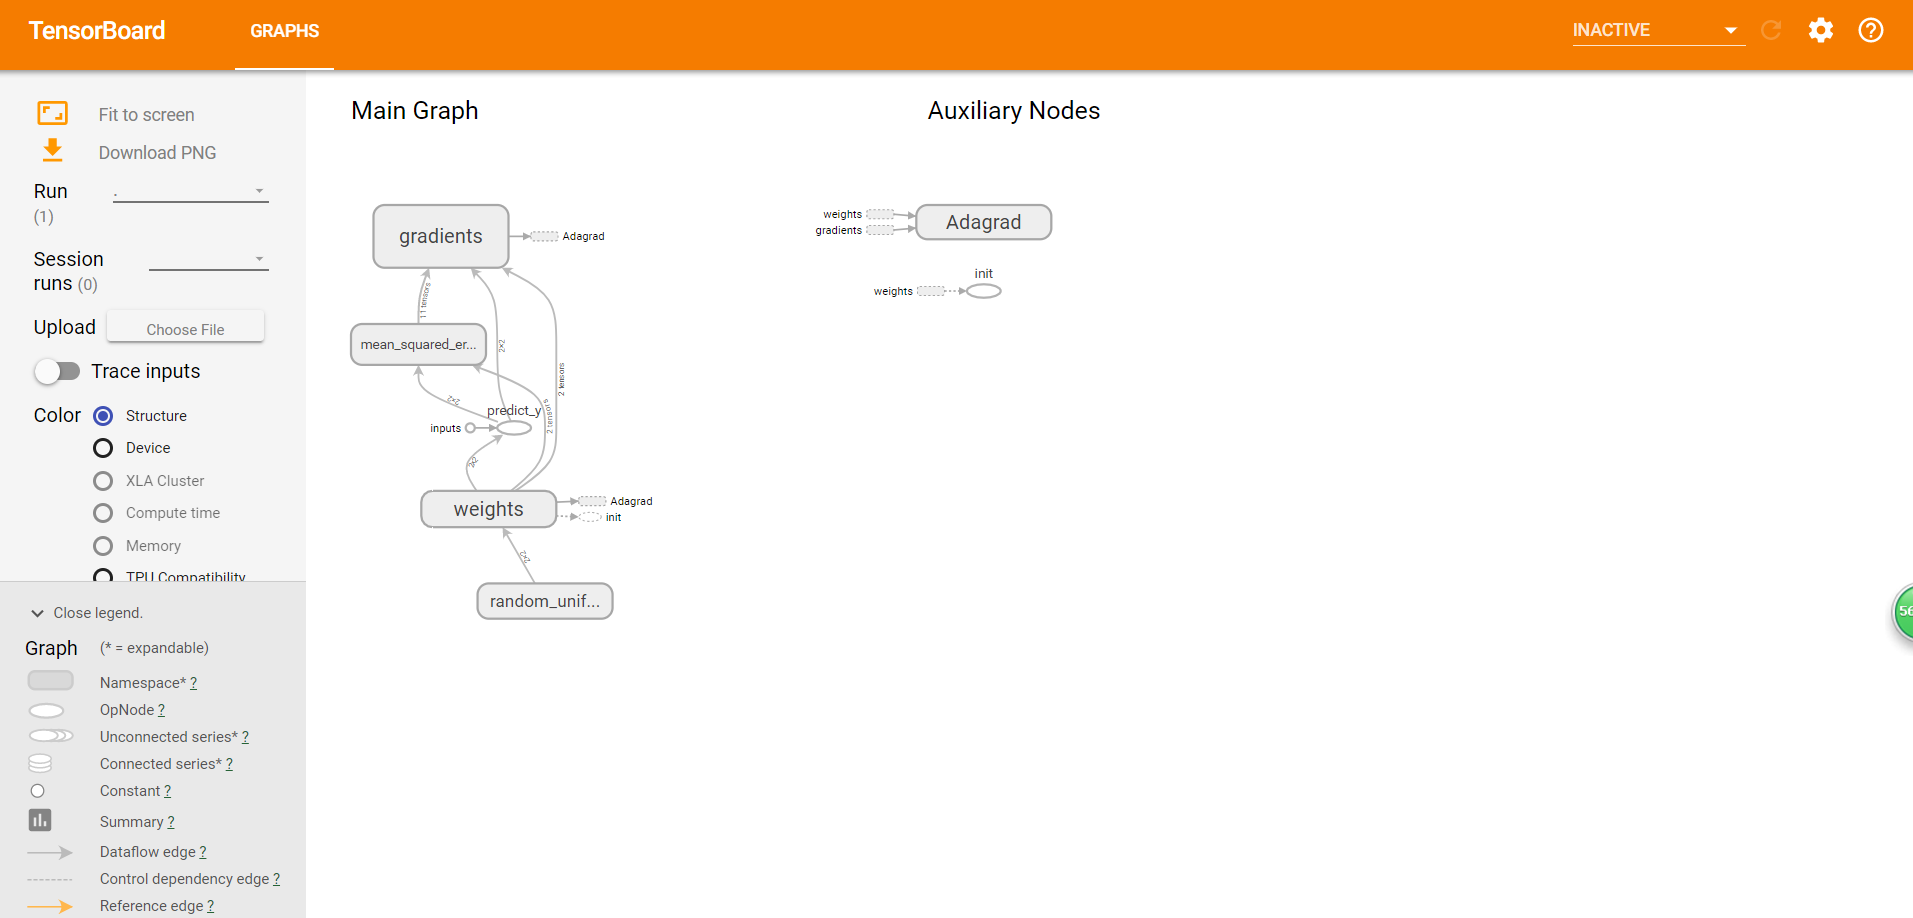
x = tf.constant([[37.0, -23.0], [1.0, 4.0]], name="inputs")
w = tf.Variable(tf.random_uniform([2, 2]), name="weights")
_y = tf.matmul(x, w, name="predict_y")
y = tf.constant([[74.0, -46.0], [2.0, 8.0]], name="target_y")
loss = tf.losses.mean_squared_error(y, _y, w)
train_op = tf.train.AdagradOptimizer(0.01).minimize(loss)
init = tf.global_variables_initializer()
with tf.Session() as sess:
sess.run(init)
# 'sess.graph' provides access to the graph used in a 'tf.Session'
writer = tf.summary.FileWriter("tmp/log/", sess.graph)
# Perform your computation...
for i in range(10000):
_, loss_op = sess.run([train_op, loss])
print("The loss on step " + str(i) + " is " + str(loss_op))
if(loss_op<=0.1):
break;
writer.close()
![]()

 浙公网安备 33010602011771号