BP神经网络及matlab实现
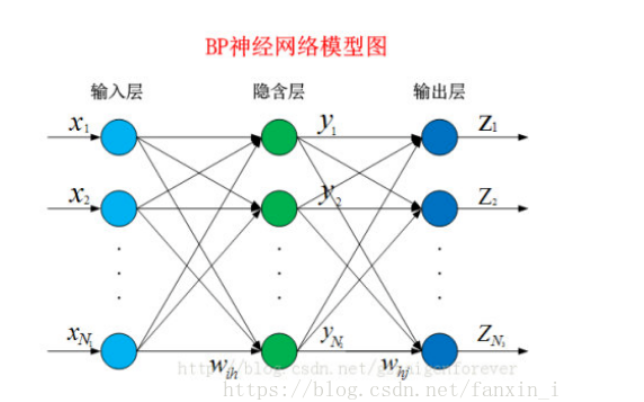
1、BP神经网络简介:其可以称为“万能的模型+误差修正函数”,每次根据训练得到的结果和预想结果进行误差分析,进而修改权值和阈值,一步一步得到能输出和预想结果一致的模型。
其是由输入层、隐藏层和输出层组成,对给懂的训练集进行训练,从而能够依据现有变量对需要的值进行预测。
具体过程可以见博客:https://blog.csdn.net/fanxin_i/article/details/80212906

Matlab实现的代码:
  1 data=[6114    6425    6525    5732    6215    6645
  2 138.69322    142.142486    134.925831    134.490744    126.613224    120.087785
  3 83.540532    76.595546    72.291648    80.135362    79.936302    74.774776
  4 0.924604    0.853992    0.814085    0.904912    0.901754    0.83836
  5 ];
  6 inputdata=data(2:4,:);
  7 outputdata=data(1,:);
  8 [rows,cols]=size(inputdata);
  9 % 取测试样本数量等于输入(训练集)样本数量,因为输入样本(训练集)容量较少
 10 % 否则一般必须用新鲜数据进行测试
 11 numberOfSample = cols; %输入样本数量
 12 numberOfTestSample = cols;
 13 numberOfForcastSample = 3; %预测步数
 14 numberOfHiddenNeure = 10; %网络层数
 15 inputDimension = rows; %输入变量数
 16 outputDimension = 1;%输出变量数
 17 %准备好训练集
 18 output1=outputdata;
 19
 20 %由系统时钟种子产生随机数
 21 rand('state', sum(100*clock));
 22
 23 %输入数据矩阵
 24 input = inputdata;
 25 %目标(输出)数据矩阵
 26 output = output1;
 27
 28 %对训练集中的输入数据矩阵和目标数据矩阵进行归一化处理
 29 [sampleInput, minp, maxp, tmp, mint, maxt] = premnmx(input, output);
 30
 31 %噪声强度
 32 noiseIntensity = 0.01;
 33 %利用正态分布产生噪声
 34 noise = noiseIntensity * randn(outputDimension, numberOfSample);
 35 %给样本输出矩阵tmp添加噪声,防止网络过度拟合
 36 sampleOutput = tmp + noise;
 37
 38 % 取测试样本输入(输出)与输入样本相同,因为输入样本(训练集)容量较少,
 39 % 否则一般必须用新鲜数据进行测试
 40 testSampleInput = sampleInput;
 41 testSampleOutput = sampleOutput;
 42
 43 %最大训练次数
 44 maxEpochs = 50000;
 45
 46 %网络的学习速率
 47 learningRate = 0.035;
 48
 49 %训练网络所要达到的目标误差
 50 error0 = 0.65*10^(-3);
 51
 52 %初始化输入层与隐含层之间的权值
 53 W1 = 0.5 * rand(numberOfHiddenNeure, inputDimension) - 0.1;
 54 %初始化输入层与隐含层之间的阈值
 55 B1 = 0.5 * rand(numberOfHiddenNeure, 1) - 0.1;
 56 %初始化输出层与隐含层之间的权值
 57 W2 = 0.5 * rand(outputDimension, numberOfHiddenNeure) - 0.1;
 58 %初始化输出层与隐含层之间的阈值
 59 B2 = 0.5 * rand(outputDimension, 1) - 0.1;
 60
 61 %保存能量函数(误差平方和)的历史记录
 62 errorHistory = [];
 63
 64 for i = 1:maxEpochs
 65     %隐含层输出
 66     hiddenOutput = logsig(W1 * sampleInput + repmat(B1, 1, numberOfSample));
 67     %输出层输出
 68     networkOutput = W2 * hiddenOutput + repmat(B2, 1, numberOfSample);
 69     %实际输出与网络输出之差
 70     error = sampleOutput - networkOutput;
 71     %计算能量函数(误差平方和)
 72     E = sumsqr(error);
 73     errorHistory = [errorHistory E];
 74
 75     if E < error0
 76         break;
 77     end
 78
 79     %以下依据能量函数的负梯度下降原理对权值和阈值进行调整
 80     delta2 = error;
 81     delta1 = W2' * delta2.*hiddenOutput.*(1 - hiddenOutput);
 82     dW2 = delta2 * hiddenOutput';
 83     dB2 = delta2 * ones(numberOfSample, 1);
 84
 85     dW1 = delta1 * sampleInput';
 86     dB1 = delta1 * ones(numberOfSample, 1);
 87     W2 = W2 + learningRate * dW2;
 88     B2 = B2 + learningRate * dB2;
 89     W1 = W1 + learningRate * dW1;
 90     B1 = B1 + learningRate * dB1;
 91 end
 92 %下面对已经训练好的网络进行(仿真)测试
 93 %对测试样本进行处理
 94 testHiddenOutput = logsig(W1 * testSampleInput + repmat(B1, 1, numberOfTestSample));
 95 testNetworkOutput =  W2 * testHiddenOutput + repmat(B2, 1, numberOfTestSample);
 96 %还原网络输出层的结果(反归一化)
 97 a = postmnmx(testNetworkOutput, mint, maxt);
 98
 99 %绘制测试样本神经网络输出和实际样本输出的对比图(figure(bp1))
100 t = 1:cols; %预测的图
101 %测试样本网络输出客运量
102 a1 = a(1,:);
103 %测试样本网络输出货运量
104 % a2 = a(2,:);
105 figure(1);
106 plot(t, a1, 'ro', t, output, 'b+');
107 legend('网络销售量', '实际销售量');
108 xlabel('周'); ylabel('销售量/件');
109 title('神经网络销售量学习与测试对比图');
110 grid on;
111
112 % 新的数据输入
113 newInput = [93.987    111.684    143.331; 62.846    71.317    77.109;0.705    0.792    0.839];
114 %利用原始输入数据(训练集的输入数据)的归一化参数对新输入数据进行归一化
115 newInput = tramnmx(newInput, minp, maxp);
116 newHiddenOutput = logsig(W1 * newInput + repmat(B1, 1, numberOfForcastSample));
117 newOutput = W2 * newHiddenOutput + repmat(B2, 1, numberOfForcastSample);
118 newOutput = postmnmx(newOutput, mint, maxt);
119 disp('预测10月份之后12周的销售量分别为(单位:件):');
120 newOutput(1,:);%输出 or 不输出
121
122 [m,n]=size(newInput);
123 % 在figure(bp1)的基础上绘制预测情况bp2
124 figure(2);
125 t1 = 1:cols+n;%输入周横坐标
126 y=[7154,5756,7110];
127 facoutputss=[a1,newOutput(1,:)];
128 orioutput=[outputdata,y];
129 plot(t1, facoutputss, 'ro', t1,orioutput, 'b+');
130 % legend('网络输出销售量', '销售量');
131 % xlabel('周'); ylabel('销售量/件');
132 % title('神经网络销售量学习与测试对比图(添加了预测数据)');
133 grid on;
134
135 % 绘制能量函数值的变化情况bp3
136 figure(3);
137 [m,n]= size(errorHistory);
138 t3 = 1:n;
139 plot(t3, errorHistory, 'r-');
140 %为了更加清楚地观察出能量函数值的变化情况,这里我只绘制前100次的训练情况
141 xlim([1 100]);
142 xlabel('训练过程');
143 ylabel('能量函数值');
144 title('能量函数(误差平方和)在训练神经网络过程中的变化图');
145 grid on;
146
147 result=newOutput(1,:);


