Mathematica——绘制3D图形
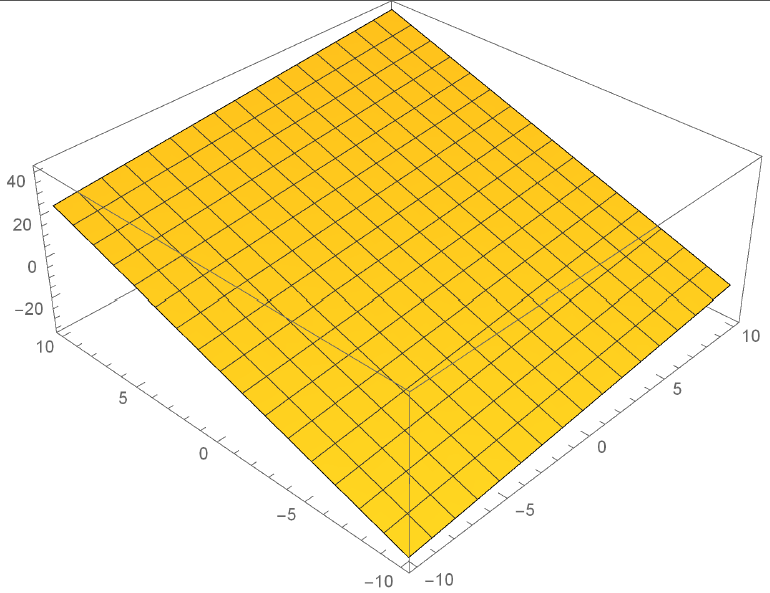
Plot3D
Plot3D[3 + 0.85 x + 3 y, {x, -10, 10}, {y, -10, 10}]

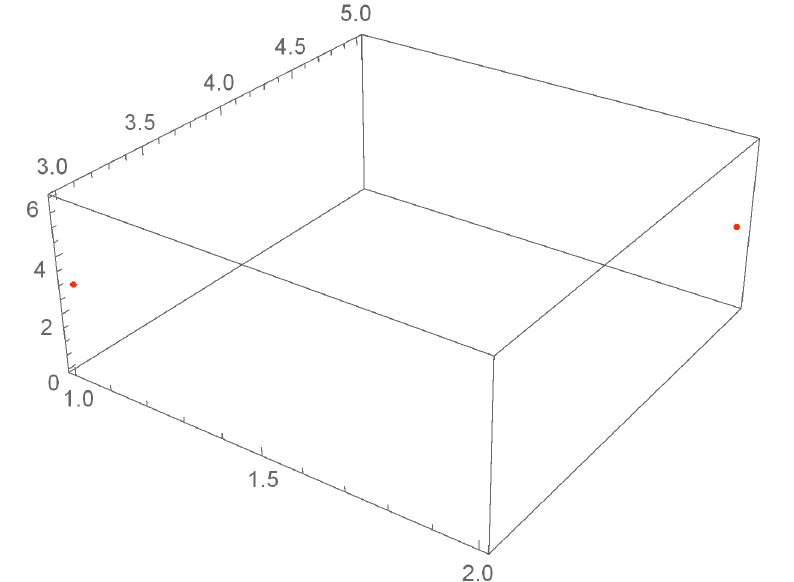
ListPointPlot3D
绘制点集
ListPointPlot3D[{{1, 3, 3}, {2, 5, 3}}, ColorFunction -> Function[{x, y, z}, Hue[0.03, 1, 1]]]
其中使用ColorFunction设置点的颜色为红色:

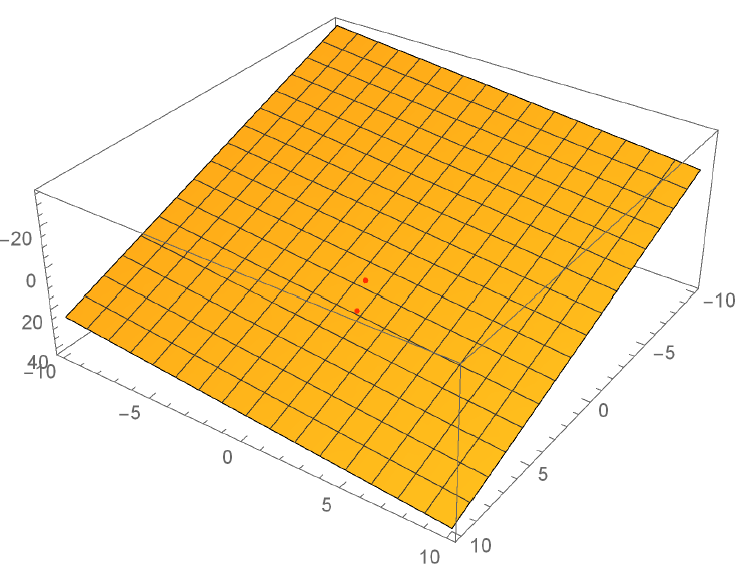
使用组合的形式将两个图合二为一
使用show函数
Show[
  Plot3D[3 + 0.85 x + 3 y, {x, -10, 10}, {y, -10, 10}],
  ListPointPlot3D[{{1, 3, 3}, {2, 5, 3}}, ColorFunction -> Function[{x, y, z}, Hue[0.03, 1, 1]]]
]

可以看到两个图显示在一个坐标系内了,不过合并之后的图没有办法通过面板设置样式,只能通过代码设置样式,因此先单个图形设置好样式之后再合并。
Show[
  Plot3D[3 + 0.85 x + 3 y, {x, -10, 10}, {y, -10, 10},
      MeshStyle -> Directive[GrayLevel[0], Dotted], Mesh -> Automatic,
      MeshFunctions -> Automatic, PlotStyle -> Directive[GrayLevel[0], Opacity[0.264`]]],
  ListPointPlot3D[{{1, 3, 3}, {2, 5, 3}}, ColorFunction -> Function[{x, y, z}, Hue[0.03, 1, 1]]]
]
效果:


【推荐】编程新体验,更懂你的AI,立即体验豆包MarsCode编程助手
【推荐】凌霞软件回馈社区,博客园 & 1Panel & Halo 联合会员上线
【推荐】抖音旗下AI助手豆包,你的智能百科全书,全免费不限次数
【推荐】轻量又高性能的 SSH 工具 IShell:AI 加持,快人一步