Visualizing the Git data model
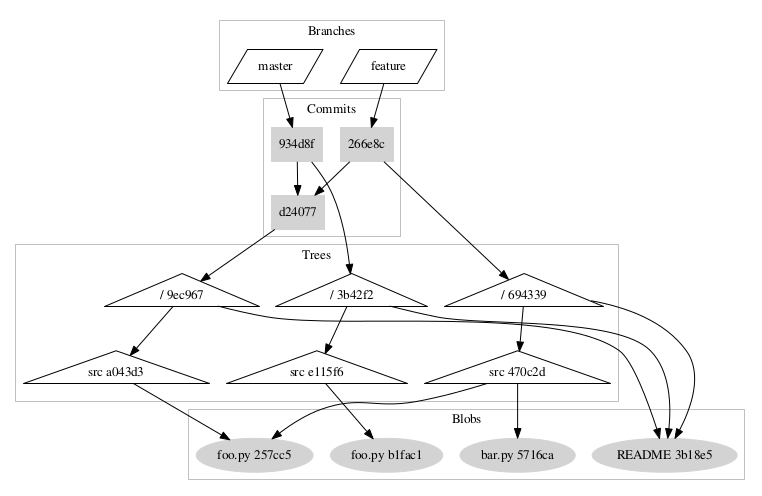
I wrote a small tool git-graph.py over the weekend which can be used to generate the object graph of a Git repository. The primary purpose is to help Git learners better understand the Git data model through visualization. You can experiment with various git operations (e.g., add/delete/edit files or directories, merge branches, etc), commit, then run this tool to see what happened to the data in the .git directory under the hood.
References on Git internals:
Pro Git- Git Internals - Git Objects
Understanding Git — Data Model
Learning Git Internals by Example
OSCON 2016: Dissecting Git's Guts - Git Internals - Emily Xie.

 浙公网安备 33010602011771号