
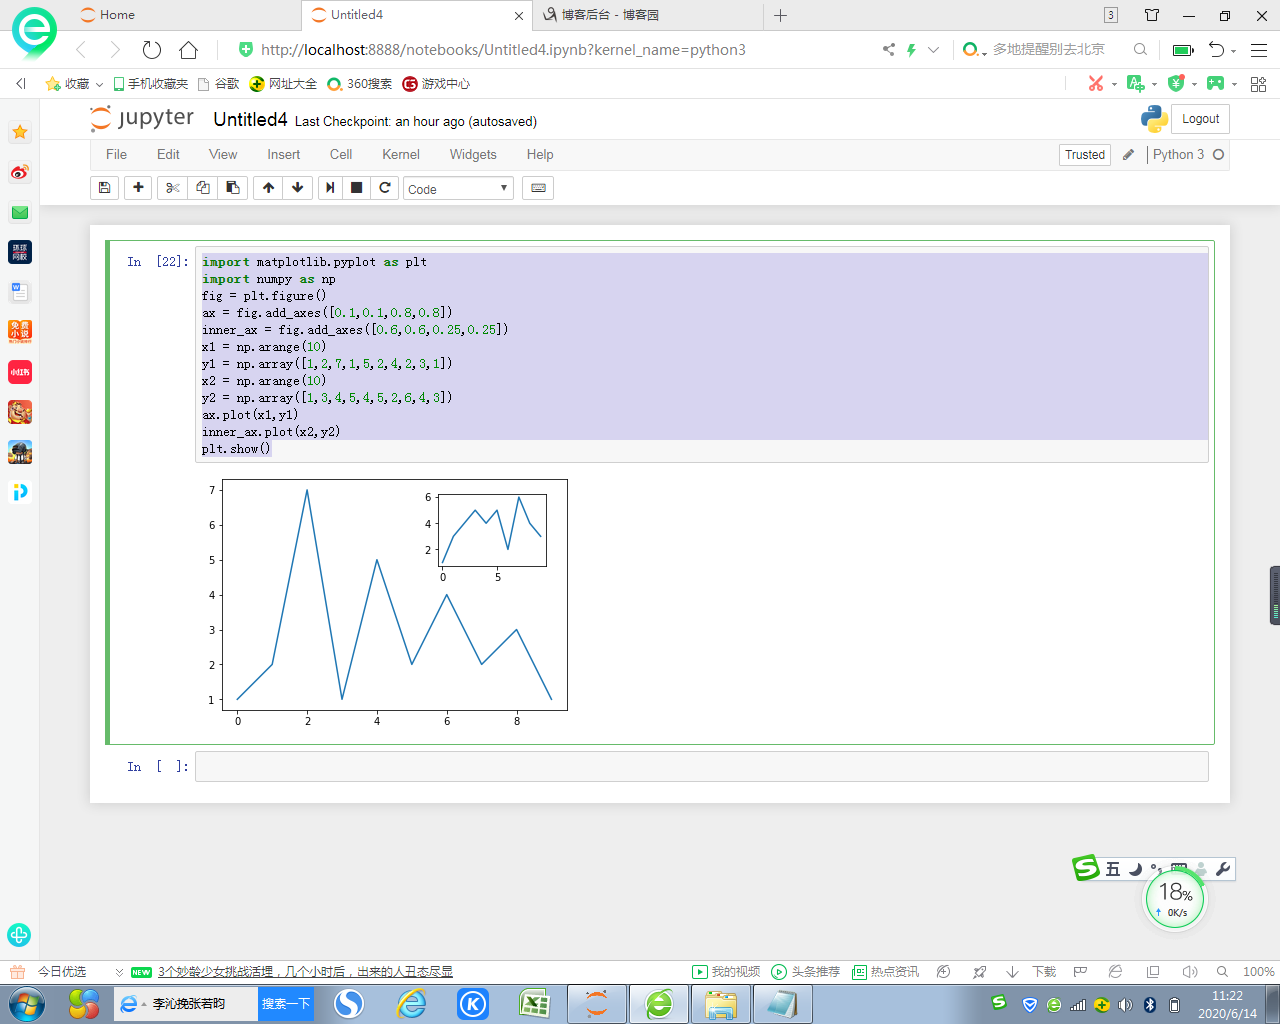
多面板图形
import matplotlib.pyplot as plt
import numpy as np
fig = plt.figure()
ax = fig.add_axes([0.1,0.1,0.8,0.8])
inner_ax = fig.add_axes([0.6,0.6,0.25,0.25])
x1 = np.arange(10)
y1 = np.array([1,2,7,1,5,2,4,2,3,1])
x2 = np.arange(10)
y2 = np.array([1,3,4,5,4,5,2,6,4,3])
ax.plot(x1,y1)
inner_ax.plot(x2,y2)
plt.show()

 浙公网安备 33010602011771号