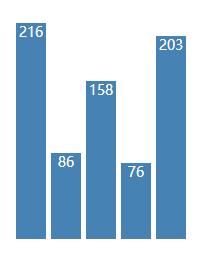
    <script>
        var width = 400;
        var height = 400;
        //创建画布
        var svg = d3.select('body')
        .append('svg')
        .attr('width',width)
        .attr('height',height)

        var padding = {top:20,left:20,right:20,bottom:20}
        var rectstep = 35; //矩形的宽带偏白
        var rectwidth = 30;//矩形的宽

        var dataset = [216,86,158,76,203]
        // 根据数据填充矩形
        var rect = svg.selectAll('rect')
                      .data(dataset)
                      .enter()
                      .append('rect')
                      .attr('fill','steelblue')
                      .attr('x',function(d,i){
                        return padding.left + i * rectstep;
                      })
                      .attr('y',function(d,i){
                          return height - padding.bottom - d;
                      })
                      .attr('width',rectwidth)
                      .attr('height',function(d,i){
                          return d;
                      })
        // 根据数据填充文本内容
        var text = svg.selectAll('text')
                      .data(dataset)
                      .enter()
                      .append('text')
                      .attr('fill','white')
                      .attr('x',function(d,i){
                        return padding.left + i * rectstep;
                      })
                      .attr('y',function(d,i){
                          return height - padding.bottom - d;
                      })
                      .attr('text-anchor','middle')
                      .attr('font-size','14px')
                      .attr('dx',rectwidth/2)
                      .attr('dy','1em')
                      .text(function(d,i){
                          return d;
                      })
    </script>
![]()


 浙公网安备 33010602011771号