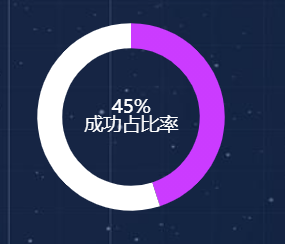
使用echarts实现环图,环图中间动态数据(代码案例)
话不多说,直接上代码(可以直接复制即可使用):
图例:

//环图
function showPie2() {
/* $.ajax({
url: ''+ctx+'/lastJob/find',
type: "POST",

dataType:'json',
async: false,
success: function(data){
for(var i=0;i<data.length;i++){
    var array = data[i]
}
 e=array.YCLBT;
}
}); */
var e=45;  //可以ajax传入e的值

var option = {
    title:{
    show:true,
    text:e+'%' +"\n"+"成功占比率" ,   //图中间的值
    x:'center',          //居中
    y:'center',
    textStyle: {
        fontSize: '15',
        color:'white',
        fontWeight: 'normal'
      }
   },
tooltip: {
    trigger: 'item',
    formatter: "{d}%",
    show:false
},
legend: {
    orient: 'vertical',
    x: 'left',
    show:false
},
series:
{
    name:'',
    type:'pie',
    radius: ['55%', '75%'],
    avoidLabelOverlap: true,
    hoverAnimation:false,
    label: {
        normal: {
            show: false,
            position: 'center'
        },
        emphasis: {
            show: false
        }
    },
    labelLine: {
        normal: {
            show: false
        }
    },
    data:[
        {value:e, name:''},   //紫色环的值
        {value:100-e, name:''}   //白色环的值
    ]
},
 color:[
        new echarts.graphic.LinearGradient(120, 120, 120, 1, [{offset: 1, color: 'transparent'}, {offset: 1, color: '#cb3bff'}])
        ,'white'] //设置环的颜色 ,坐标控制渐变方向

}
var chart = echarts.init(document.getElementById("showPie2"));
chart.setOption(option,true);
//图形自适应
window.addEventListener("resize",function(){
     chart.resize();
});
chart.off('click');
chart.on('click', function (params) {

});
}


【推荐】国内首个AI IDE,深度理解中文开发场景,立即下载体验Trae
【推荐】编程新体验,更懂你的AI,立即体验豆包MarsCode编程助手
【推荐】抖音旗下AI助手豆包,你的智能百科全书,全免费不限次数
【推荐】轻量又高性能的 SSH 工具 IShell:AI 加持,快人一步
· AI与.NET技术实操系列:基于图像分类模型对图像进行分类
· go语言实现终端里的倒计时
· 如何编写易于单元测试的代码
· 10年+ .NET Coder 心语,封装的思维:从隐藏、稳定开始理解其本质意义
· .NET Core 中如何实现缓存的预热?
· 25岁的心里话
· 闲置电脑爆改个人服务器(超详细) #公网映射 #Vmware虚拟网络编辑器
· 基于 Docker 搭建 FRP 内网穿透开源项目(很简单哒)
· 零经验选手,Compose 一天开发一款小游戏!
· 一起来玩mcp_server_sqlite,让AI帮你做增删改查!!