python代码实现回归分析--线性回归

python代码实现回归分析--线性回归
#概念篇:
#一下是我自己结合课件理解的,如果理解的有问题,期望看到的人能够好心告诉我一下,我将感激不尽~
#1.什么数据建模? 通过原有数据找到其中的规律,并总结成模型.
#2.什么是模型概念? 通过规律总结的模型,来预测自变量的结果(因变量).
#3.什么是回归分析? 是用来解释自变量和因变量之间关系的一种方法.
#4.什么是线性回归? 回归分析的一种,评估自变量和因变量是一种线性关系的的一种方法.
#5. 什么是一元线性回归? 就是自变量只有一个的线性回归(影响元素只有一种).
#6. 什么是多元线性回归? 就是自变量是多个的线性回归(影响元素不止一种).
#7. 什么是拟合? 回归分析的具体实现方式(构建出最能串联现实实际情况的算法公式)
#8. 什么是模型参数? 就是能够解释自变量和因变量关系的参数.
#代码表示篇:
#一元线性回归程序:
#1.基本工具导入.
import numpy as np
#调科学计算包中线性模块里的线性回归函数
from sklearn.linear_model import LinearRegression
#条用科学计算包中的方法选择模块里的用于切分测试集和训练集的函数.
from sklearn.model_selection import train_test_split
#2.建造数据
#随机数种子,事先设置之后,就能固定值随机数.
#PS:0可以理解成这组随机数的编号,只要在下边填写同样编号得到的数值是同一组随机数数值.
np.random.seed(0)
#从-10到10之间的100个等差数列(属于连续性数组)
x = np.linspace(-10,10,100)
#设置一个线性回归公式
y = 0.85*x - 0.72
#创建一组数量为100,均值为0,标准差为0.5的随机数组.
e = np.random.normal(loc = 0,scale = 0.5,size = x.shape)
#将变量y加上这个变量e
y += e
#将x转换为二维数组,因为fit方法要求x为二维结构.
x= x.reshape(-1,1)
lr = LinearRegression()
#x:被划分的特征集,y:被划分的标签,test_size:样本的占比(如果是整数表示样本的数量),random_state:随机数种子编号
X_train,X_test,y_train,y_test = train_test_split(x,y,test_size = 0.25,random_state=0)
#拟合数据函数:
lr.fit(X_train,y_train)
#拟合后可利用lr.coef和lr.intercept取出(w))权重和(b))截距.
print('权重',lr.coef_)
print('截距',lr.intercept_)
#从训练集学习到了模型的参数(w与b),确定方程,就可以进行预测了.
#定义一个预测函数
y_hat = lr.predict(X_test)
#比对一下预测的y值与实际y值
print("实际值:",y_test.ravel()[:10])
print("预测值:",y_hat[:10])

import matplotlib as mpl
import matplotlib.pyplot as plt
#画布初始设定:
mpl.rcParams["font.family"] = "SimHei"
mpl.rcParams["axes.unicode_minus"] =False
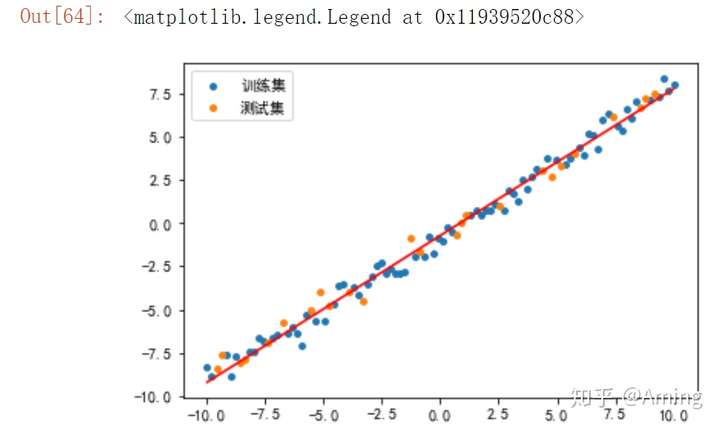
#将训练集和测试集用散点形式表现
plt.scatter(X_train,y_train,s = 15,label = '训练集')
plt.scatter(X_test,y_test,s = 15,label = '测试集')
#将预测结果用直线画出
plt.plot(x,lr.predict(x),"r-")
#显示说明
plt.legend()

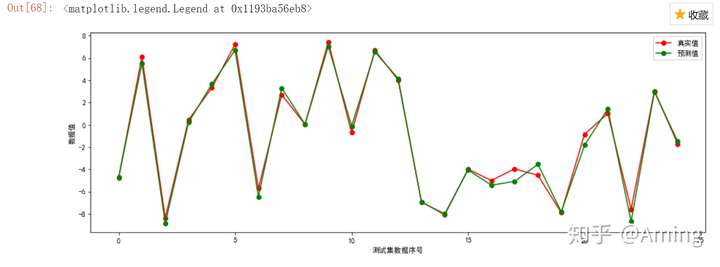
#用图标表示出真实值与预测值
plt.figure(figsize = (15,5))
plt.plot(y_test,label = "真实值",color = "r",marker = "o")
plt.plot(y_hat,label = "预测值",color = "g",marker = "o")
plt.xlabel("测试集数据序号")
plt.ylabel("数据值")
plt.legend()

#线性回归模型评估
from sklearn.metrics import mean_squared_error,mean_absolute_error,r2_score
print("平均方误差(MSE):",mean_squared_error(y_test,y_hat))
print("根均方误差( RMSE):",mean_absolute_error(y_test,y_hat))
print("平均绝对值误差(MAE):",r2_score(y_test,y_hat))

from sklearn.linear_model import LinearRegression
from sklearn.metrics import mean_absolute_error
from sklearn.model_selection import train_test_split
#make_regression 用来生成样本数据,用于回归模型
from sklearn.datasets import make_regression
# n_sampless:生成样本个体的数量
#n_features: 特征数量(x的数量)
#bias:偏置值.
#random_state :随机种子
#noise:噪音
#生成线性回归的样本数据
# n_sampless:生成样本个体的数量
#n_features: 特征数量(x的数量)
#coef: 是否返回权重.ture 返回,false不返回
#bias:偏置值.
#random_state :随机种子
X,y,coef = make_regression(n_samples=1000,n_features=2,coef=True,bias=5.5,random_state=0)
X_train,X_test,y_train,y_test = train_test_split(X,y,test_size = 0.25,random_state=0)
print("实际权重:",coef)
lr = LinearRegression()
lr.fit(X_train,y_train)
print("模型权重:",lr.coef_)
print("截距:",lr.intercept_)
y_hat = lr.predict(X_test)
print("均方误差:",mean_absolute_error(y_test,y_hat))
print("训练集R~2:",lr.score(X_train,y_train))
print("训练集R~2:",lr.score(X_test,y_test))


【推荐】国内首个AI IDE,深度理解中文开发场景,立即下载体验Trae
【推荐】编程新体验,更懂你的AI,立即体验豆包MarsCode编程助手
【推荐】抖音旗下AI助手豆包,你的智能百科全书,全免费不限次数
【推荐】轻量又高性能的 SSH 工具 IShell:AI 加持,快人一步
· 开发者必知的日志记录最佳实践
· SQL Server 2025 AI相关能力初探
· Linux系列:如何用 C#调用 C方法造成内存泄露
· AI与.NET技术实操系列(二):开始使用ML.NET
· 记一次.NET内存居高不下排查解决与启示
· 开源Multi-agent AI智能体框架aevatar.ai,欢迎大家贡献代码
· Manus重磅发布:全球首款通用AI代理技术深度解析与实战指南
· 被坑几百块钱后,我竟然真的恢复了删除的微信聊天记录!
· 没有Manus邀请码?试试免邀请码的MGX或者开源的OpenManus吧
· 园子的第一款AI主题卫衣上架——"HELLO! HOW CAN I ASSIST YOU TODAY