
搭建前端监控系统(四)接口请求监控篇
怎样定位前端线上问题,一直以来,都是很头疼的问题,因为它发生于用户的一系列操作之后。错误的原因可能源于机型,网络环境,接口请求,复杂的操作行为等等,在我们想要去解决的时候很难复现出来,自然也就无法解决。 当然,这些问题并非不能克服,让我们来一起看看如何去监控并定位线上的问题吧。
背景:市面上的前端监控系统有很多,功能齐全,种类繁多,不管你用或是不用,它都在那里,密密麻麻。往往我需要的功能都在别人家的监控系统里,手动无奈,罢了,怎么才能拥有一个私人定制的前端监控系统呢?做一个自带前端监控系统的前端工程狮是一种怎样的体验呢?
这是搭建前端监控系统的第四章,主要是介绍如何统计静态资源加载报错,跟着我一步步做,你也能搭建出一个属于自己的前端监控系统。
推广(官网:www.webfunny.cn 、Git:webfunny_monitor 解决前端开发痛点,为前端开发量身订做):

上一章介绍了如何统计静态资源加载报错,今天要说的是前端接口请求监控的问题。
可能有人会认为接口的报错应该由后台来关注,统计,并修复。 确实如此,而且后台服务有了很多成熟完善的统计工具,完全能够应对大部分的异常情况, 那么为什么还需要前端对接口请求进行监控呢。原因很简单,因为前端是bug的第一发现位置,在你帮后台背锅之前怎么快速把过甩出去呢,这时候,我们就需要有一个接口的监控系统,哈哈 :)那么,我们需要哪些监控数据才能够把锅甩出去呢?
1. 我们要监控所有的接口请求
2. 我们要监控并记录所有接口请求的返回状态和返回结果
3. 我们要监控接口的报错情况,及时定位线上问题产生的原因
4. 我们要分析接口的性能,以辅助我们对前端应用的优化。
好了, 进入正题吧:
如何监控前端接口请求呢
一般前端请求都是用jquery的ajax请求,也有用fetch请求的,以及前端框架自己封装的请求等等。总之他们封装的方法各不相同,但是万变不离其宗,他们都是对浏览器的这个对象 window.XMLHttpRequest 进行了封装,所以我们只要能够监听到这个对象的一些事件,就能够把请求的信息分离出来。
一、如何监听ajax请求
如果你用的jquery、zepto、或者自己封装的ajax方法,就可以用如下的方法进行监听。我们监听 XMLHttpRequest 对象的两个事件 loadstart, loadend。但是监听的结果并不是像我们想象的那么容易理解,我们先看下ajaxLoadStart,ajaxLoadEnd的回调方法。
/**
   * 页面接口请求监控
   */
  function recordHttpLog() {

    // 监听ajax的状态
    function ajaxEventTrigger(event) {
      var ajaxEvent = new CustomEvent(event, { detail: this });
      window.dispatchEvent(ajaxEvent);
    }
    var oldXHR = window.XMLHttpRequest;
    function newXHR() {
      var realXHR = new oldXHR();
      realXHR.addEventListener('loadstart', function () { ajaxEventTrigger.call(this, 'ajaxLoadStart'); }, false);
      realXHR.addEventListener('loadend', function () { ajaxEventTrigger.call(this, 'ajaxLoadEnd'); }, false);
      // 此处的捕获的异常会连日志接口也一起捕获,如果日志上报接口异常了,就会导致死循环了。
      // realXHR.onerror = function () {
      //   siftAndMakeUpMessage("Uncaught FetchError: Failed to ajax", WEB_LOCATION, 0, 0, {});
      // }
      return realXHR;
    }
    function handleHttpResult(i, tempResponseText) {
      if (!timeRecordArray[i] || timeRecordArray[i].uploadFlag === true) {
        return;
      }
      var responseText = "";
      try {
        responseText = tempResponseText ? JSON.stringify(utils.encryptObj(JSON.parse(tempResponseText))) : "";
      } catch (e) {
        responseText = "";
      }
      var simpleUrl = timeRecordArray[i].simpleUrl;
      var currentTime = new Date().getTime();
      var url = timeRecordArray[i].event.detail.responseURL;
      var status = timeRecordArray[i].event.detail.status;
      var statusText = timeRecordArray[i].event.detail.statusText;
      var loadTime = currentTime - timeRecordArray[i].timeStamp;
      if (!url || url.indexOf(HTTP_UPLOAD_LOG_API) != -1) return;
      var httpLogInfoStart = new HttpLogInfo(HTTP_LOG, simpleUrl, url, status, statusText, "发起请求", "", timeRecordArray[i].timeStamp, 0);
      httpLogInfoStart.handleLogInfo(HTTP_LOG, httpLogInfoStart);
      var httpLogInfoEnd = new HttpLogInfo(HTTP_LOG, simpleUrl, url, status, statusText, "请求返回", responseText, currentTime, loadTime);
      httpLogInfoEnd.handleLogInfo(HTTP_LOG, httpLogInfoEnd);
      // 当前请求成功后就,就将该对象的uploadFlag设置为true, 代表已经上传了
      timeRecordArray[i].uploadFlag = true;
    }

    var timeRecordArray = [];
    window.XMLHttpRequest = newXHR;
    window.addEventListener('ajaxLoadStart', function(e) {
      var tempObj = {
        timeStamp: new Date().getTime(),
        event: e,
        simpleUrl: window.location.href.split('?')[0].replace('#', ''),
        uploadFlag: false,
      }
      timeRecordArray.push(tempObj)
    });

    window.addEventListener('ajaxLoadEnd', function() {
      for (var i = 0; i < timeRecordArray.length; i ++) {
        // uploadFlag == true 代表这个请求已经被上传过了
        if (timeRecordArray[i].uploadFlag === true) continue;
        if (timeRecordArray[i].event.detail.status > 0) {
          var rType = (timeRecordArray[i].event.detail.responseType + "").toLowerCase()
          if (rType === "blob") {
            (function(index) {
              var reader = new FileReader();
              reader.onload = function() {
                var responseText = reader.result;//内容就在这里
                handleHttpResult(index, responseText);
              }
              try {
                reader.readAsText(timeRecordArray[i].event.detail.response, 'utf-8');
              } catch (e) {
                handleHttpResult(index, timeRecordArray[i].event.detail.response + "");
              }
            })(i);
          } else {
            var responseText = timeRecordArray[i].event.detail.responseText;
            handleHttpResult(i, responseText);
          }
        }
      }
    });
  }
一个页面上会有很多个请求,当一个页面发出多个请求的时候,ajaxLoadStart事件被监听到,但是却无法区分出来到底发送的是哪个请求,只返回了一个内容超多的事件对象,而且事件对象的内容几乎完全一样。当ajaxLoadEnd事件被监听到的时候,也会返回一个内容超多的时间对象,这个时候事件对象里包含了接口请求的所有信息。幸运的是,两个对象是同一个引用,也就意味着,ajaxLoadStart和ajaxLoadEnd事件被捕获的时候,他们作用的是用一个对象。那我们就有办法分析出来了。
当ajaxLoadStart事件发生的时候,我们将回调方法中的事件对象全都放进数组timeRecordArray里,当ajaxLoadEnd发生的时候,我们就去遍历这个数据,遇到又返回结果的事件对象,说明接口请求已经完成,记录下来,并从数组中将该事件对象的uploadFlag属性设置为true, 代表请求已经被记录。这样我们就能够逐一分析出接口请求的内容了。
二、如何监听fetch请求
通过第一种方法,已经能够监听到大部分的ajax请求了。然而,使用fetch请求的人越来越多,因为fetch的链式调用可以让我们摆脱ajax的嵌套地狱,被更多的人所青睐。奇怪的是,我用第一种方式,却无法监听到fetch的请求事件,这是为什么呢?
return new Promise(function(resolve, reject) {
      var request = new Request(input, init)
      var xhr = new XMLHttpRequest()

      xhr.onload = function() {
        var options = {
          status: xhr.status,
          statusText: xhr.statusText,
          headers: parseHeaders(xhr.getAllResponseHeaders() || '')
        }
        options.url = 'responseURL' in xhr ? xhr.responseURL : options.headers.get('X-Request-URL')
        var body = 'response' in xhr ? xhr.response : xhr.responseText
        resolve(new Response(body, options))
      }
      // .......
      xhr.send(typeof request._bodyInit === 'undefined' ? null : request._bodyInit)
    })
这个是fetch的一段源码, 可以看到,它创建了一个Promise, 并新建了一个XMLHttpRequest对象 var xhr =newXMLHttpRequest()。由于fetch的代码是内置在浏览器中的,它必然先用监控代码执行,所以,我们在添加监听事件的时候,是无法监听fetch里边的XMLHttpRequest对象的。怎么办呢,我们需要重写一下fetch的代码。只要在监控代码执行之后,我们重写一下fetch,就可以正常监听使用fetch方式发送的请求了。就这么简单 :)
看一下需要监听的字段:
// 设置日志对象类的通用属性
  function setCommonProperty() {
    this.happenTime = new Date().getTime(); // 日志发生时间
    this.webMonitorId = WEB_MONITOR_ID;     // 用于区分应用的唯一标识(一个项目对应一个)
    this.simpleUrl =  window.location.href.split('?')[0].replace('#', ''); // 页面的url
    this.completeUrl =  utils.b64EncodeUnicode(encodeURIComponent(window.location.href)); // 页面的完整url
    this.customerKey = utils.getCustomerKey(); // 用于区分用户,所对应唯一的标识,清理本地数据后失效,
    // 用户自定义信息, 由开发者主动传入, 便于对线上问题进行准确定位
    var wmUserInfo = localStorage.wmUserInfo ? JSON.parse(localStorage.wmUserInfo) : "";
    this.userId = utils.b64EncodeUnicode(wmUserInfo.userId || "");
    this.firstUserParam = utils.b64EncodeUnicode(wmUserInfo.firstUserParam || "");
    this.secondUserParam = utils.b64EncodeUnicode(wmUserInfo.secondUserParam || "");
  }
// 接口请求日志,继承于日志基类MonitorBaseInfo
  function HttpLogInfo(uploadType, url, status, statusText, statusResult, currentTime, loadTime) {
    setCommonProperty.apply(this);
    this.uploadType = uploadType;  // 上传类型
    this.httpUrl = utils.b64EncodeUnicode(encodeURIComponent(url)); // 请求地址
    this.status = status; // 接口状态
    this.statusText = statusText; // 状态描述
    this.statusResult = statusResult; // 区分发起和返回状态
    this.happenTime = currentTime;  // 客户端发送时间
    this.loadTime = loadTime; // 接口请求耗时
  }
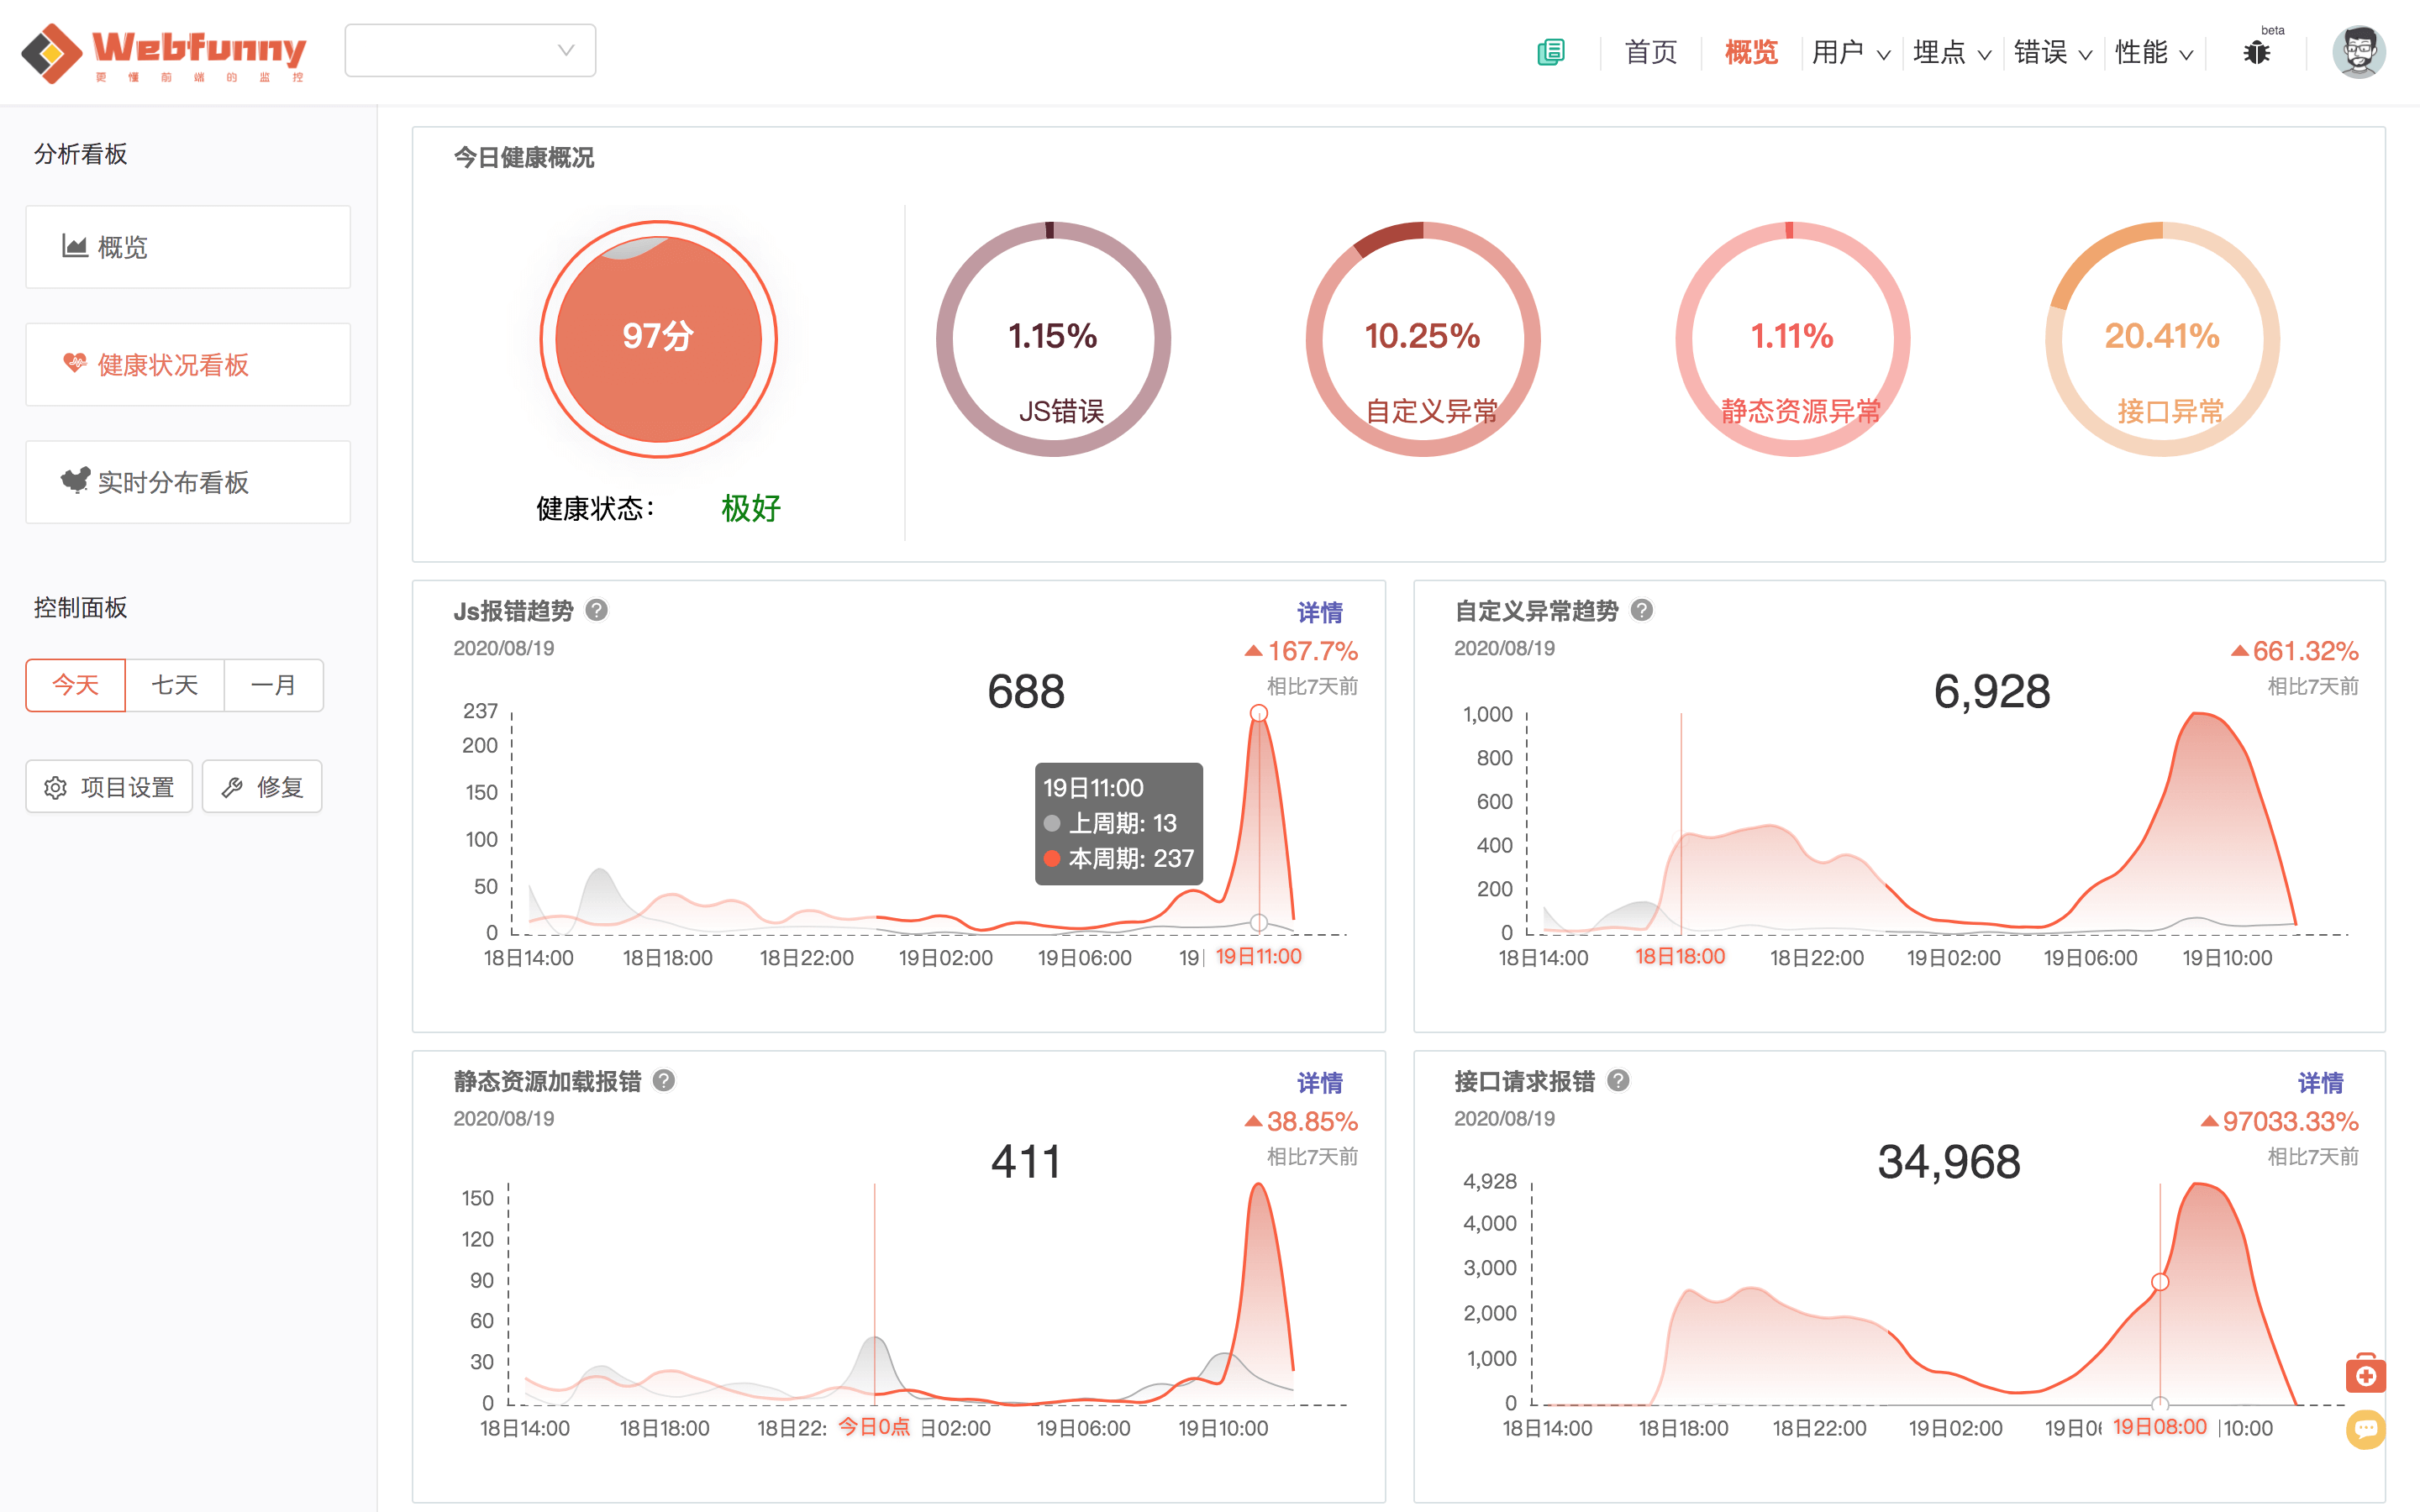
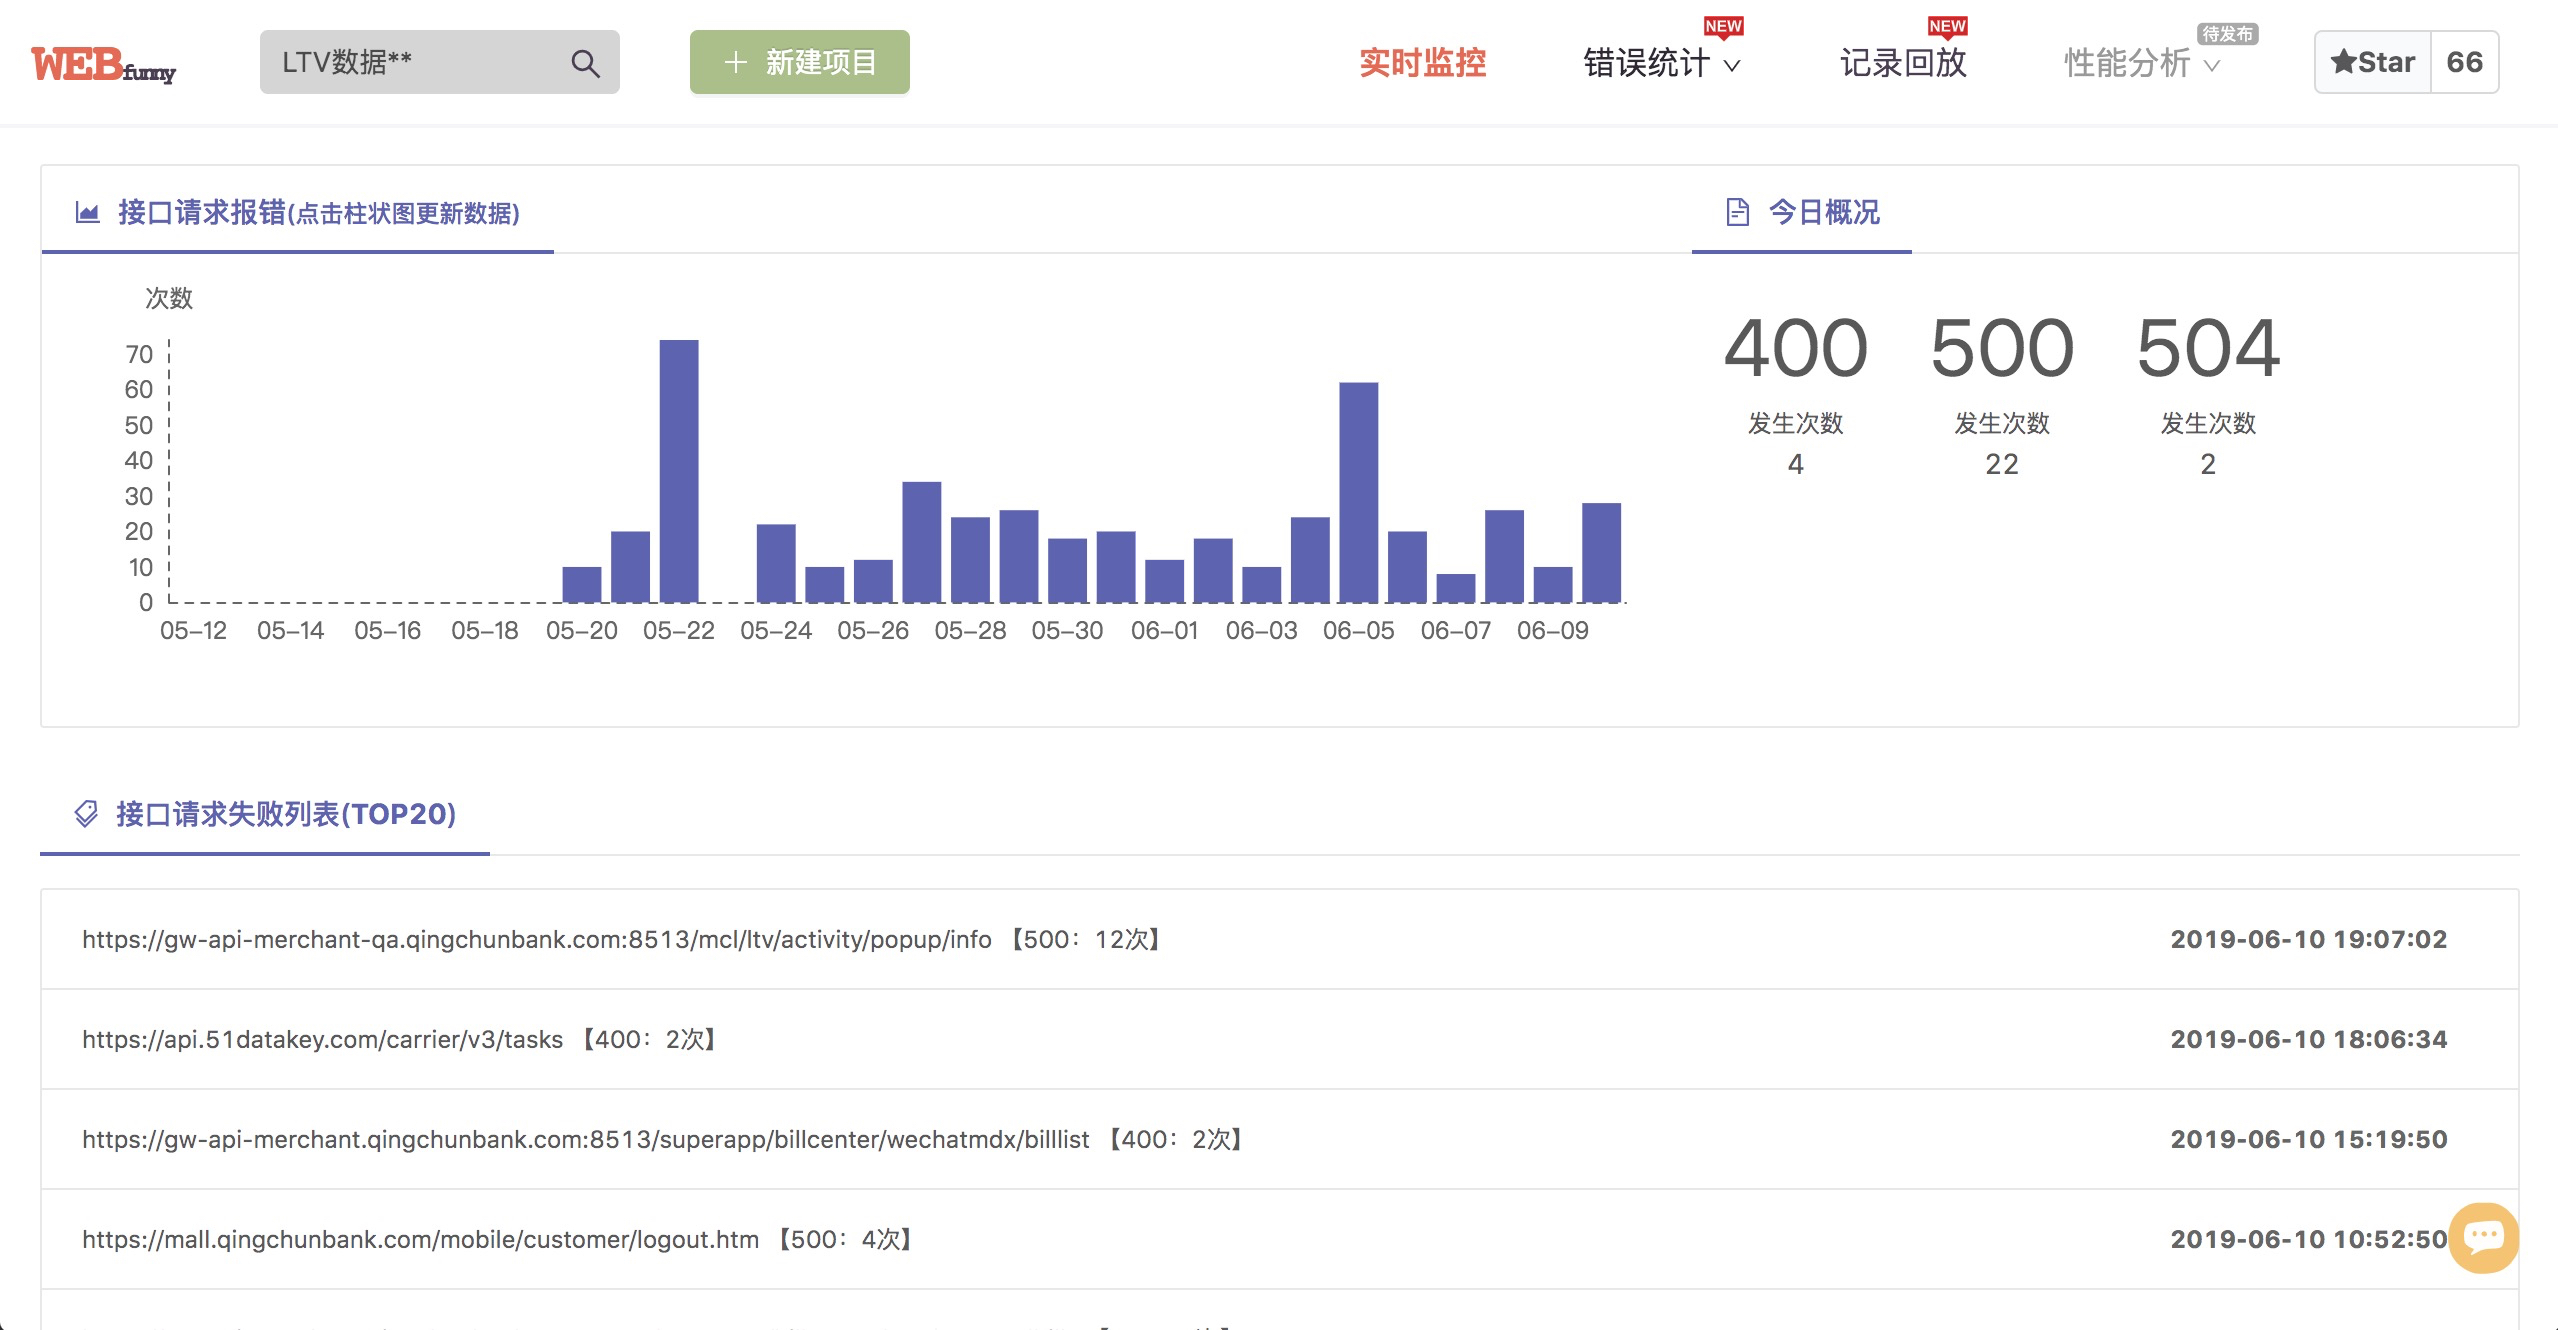
所有工作准备完毕,如果把收集到的日志从不同的维度展现出来,我就不细说了,直接上图了。如此,便能够对前端接口报错的情况有一个清晰的了解,也能够快速的发现线上的问题。

 浙公网安备 33010602011771号