
L六、Prometheus集成企业微信
Prometheus发出告警时分为两部分。
笔记配套视频效果更佳哦,视频地址:https://edu.51cto.com/lecturer/14390454.html
首先,Prometheus按告警规则(rule_ files配置块)向Alertmanager发送告警(即告警规则是在Prometheus上定义的)。然后,由Alertmanager来管理这些告警,包括去重(Deduplicating)、分组(Grouping)、 静音(silencing)、 抑制(inhibition)、聚合(aggregation), 最终将面要发出的告警通过电子邮件、webhook等方式将告警通知路由(route)给对应的联系人。
分组:就是将具有相同性质的告警先分类,然后当作单个通知发送出来。比如A和B两台主机的磁盘(CPU/内存)使用率都在告警,则磁盘的告警就可以合并在一个通知中发送出来。可以想像某个服务部署了100个节点,在一次升版后因为bug,日志中均报同样一类错误, 如果不合并这类通知,那就是告警风暴。
抑制:就是某些告警触发后,则抑制(禁止)另-些告警。比如收到一条告警提示集群故障无法访问,那么在该集群上的所有其他警告应该被抑制。静音(默):将某些在预期内的告警设置为静默(即不发送告警)。静默是基于配置匹配规则。Alertmanager会检查从Prometheus推送过来的告警事件,看这些告警事件是否与配置的静默规则能匹配上,如果匹配则不发送任何通知。配置静默方法是在Alertmanager的Web界面中,也可以使用amtool工具。
总之: Alertmanager制定这一系列规则目的只有一个,就是提高告警质量。
配置Alertmanager来做告警通知主要分三个步骤:
[root@prometheus ~]#
wget https://github.com/prometheus/alertmanager/releases/download/v0.23.0/alertmanager-0.23.0.linux-amd64.tar.gz
[root@prometheus ~]# tar xf alertmanager-0.23.0.linux-amd64.tar.gz
[root@prometheus ~]# mv alertmanager-0.23.0.linux-amd64 /usr/local/
[root@prometheus ~]# cd /usr/local/
[root@prometheus local]# ln -s alertmanager-0.23.0.linux-amd64/ alertmanager
[root@prometheus local]# cd alertmanager
[root@prometheus alertmanager]# alternatives --version
alternatives version 1.7.4

#Alermanager会将数据保存到本地中,默认的存储路径为data/因此,在启动Alertmanager之前需要创建相应的目录:
[root@prometheus alertmanager]# mkdir /usr/local/alertmanager/data
#下面使用systemd来管理alertmanager
[root@prometheus alertmanager]# cat /lib/systemd/system/alertmanager.service
[Unit]
Description=alertmanager
After=network.target
[Service]
Type=simple
User=root
ExecStart=/usr/local/alertmanager/alertmanager --config.file=/usr/local/alertmanager/alertmanager.yml
Restart=on-failure
[Install]
WantedBy=multi-user.target
[root@prometheus alertmanager]# systemctl start alertmanager
[root@prometheus alertmanager]# systemctl enable alertmanager
Created symlink from /etc/systemd/system/multi-user.target.wants/alertmanager.service to /usr/lib/systemd/system/alertmanager.service.
[root@prometheus alertmanager]# systemctl status alertmanager

#浏览器访问192.168.1.120:9093 即可访问到告警页面
- 企业微信告警
下载安装并注册企业微信
一、设置企业微信
笔记配套视频效果更佳哦,视频地址:https://edu.51cto.com/lecturer/14390454.html
1.1、企业微信注册(已有企业微信账号请跳过)
企业微信注册地址:https://work.weixin.qq.com/

按照要求填写相应信息,注册企业微信
笔记配套视频效果更佳哦,视频地址:https://edu.51cto.com/lecturer/14390454.html
1.2 、创建自建应用
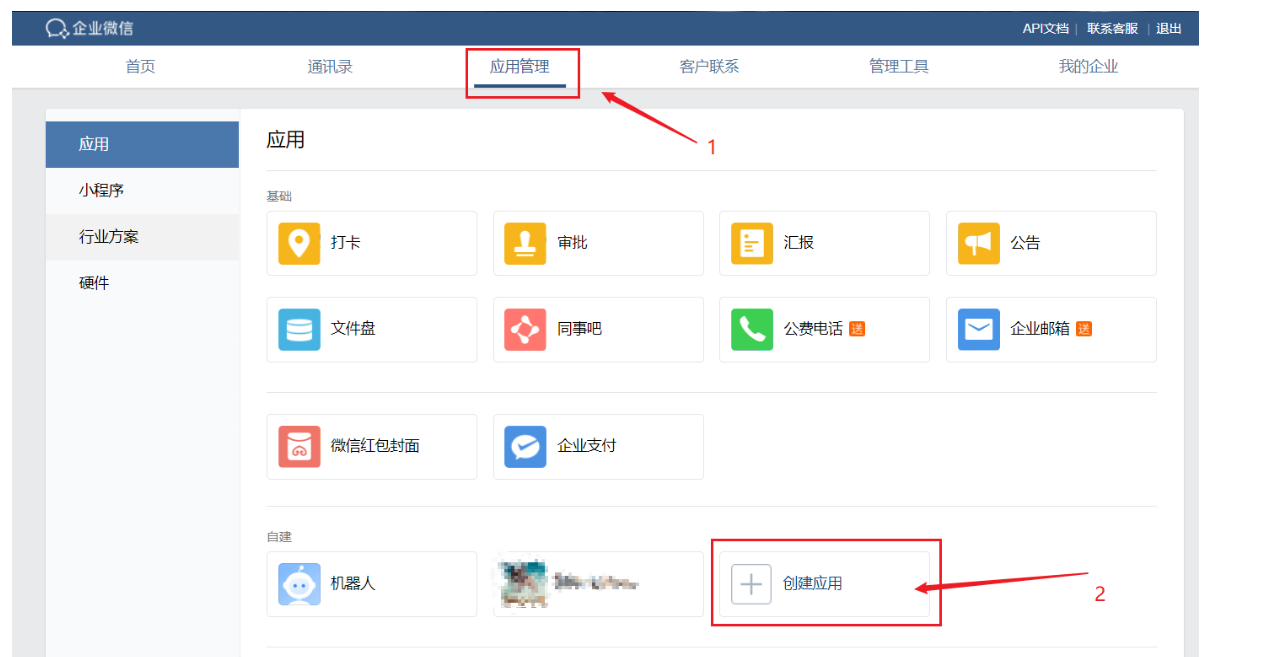
企业微信注册完成后,登录进去,点击上方导航条中的【应用管理】按钮,切换到应用管理页面。
然后选择【创建应用】,创建用于接收Alertmanager告警信息的自建应用
填写应用名称等信息,创建应用。创建应用后,记录应用的 AgentId 和 Secret 以备后用
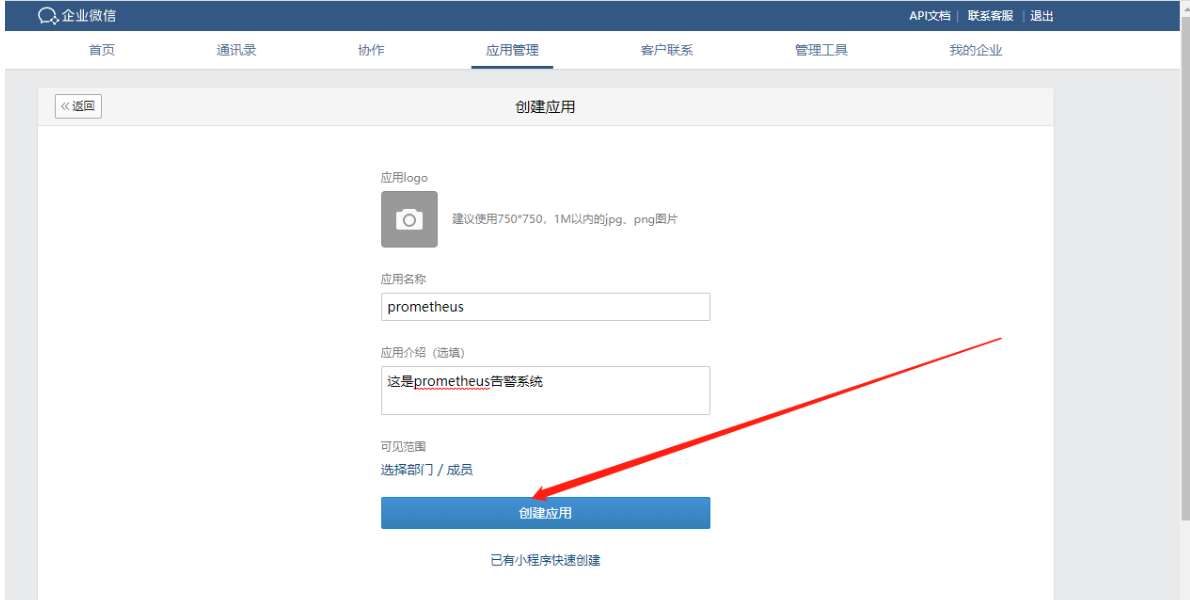

注意注意:上图的可见范围一定要加上你要通知的企业微信成员,不然也收不到通知
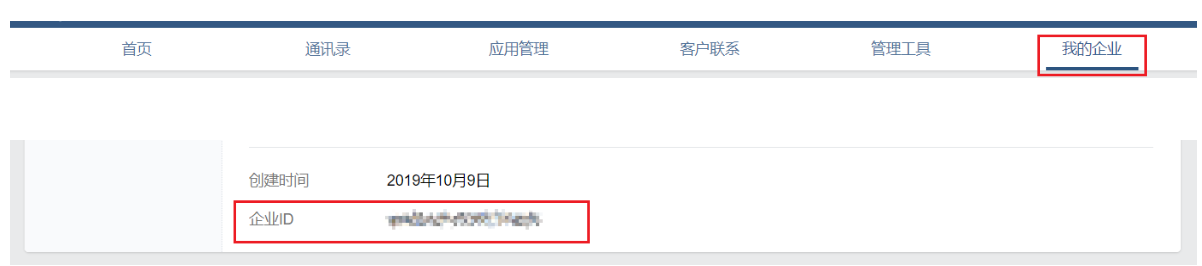
然后点击上方导航条中的【我的企业】按钮,在页面最下方查看企业ID 并记录,以备后用。
二、配置告警
进入解压后的alertmanager文件夹,修改alertmanager.yml文件,配置报警信息,alertmanager.yml 内容如下:
[root@prometheus ~]# cd /usr/local/alertmanager
[root@prometheus alertmanager]# ls
alertmanager  alertmanager.yml  amtool  data  LICENSE  NOTICE
[root@prometheus alertmanager]# cp alertmanager.yml alertmanager.yml_back
[root@prometheus alertmanager]# vi alertmanager.yml
[root@prometheus alertmanager]# cat alertmanager.yml
global:
  resolve_timeout: 5m

templates:     #告警模板
  - './template/test.tmpl'

route:  # 设置报警分发策略
  group_by: ['alertname'] # 分组标签
  group_wait: 10s      # 告警等待时间。告警产生后等待10s,如果有同组告警一起发出
  group_interval: 10s  # 两组告警的间隔时间
  repeat_interval: 1m  # 重复告警的间隔时间,减少相同右键的发送频率 此处为测试设置为1分钟
  receiver: 'wechat'  # 默认接收者

receivers:
- name: 'wechat'
  wechat_configs:
    - send_resolved: true
      agent_id: '1000002'     # 自建应用的agentId
      to_user: 'WangYongQiang'  # 接收告警消息的人员Id
      api_secret: '9sSXFRdHej5n1R1-GiQijchfq-KYR_yC4mQAxAgZ_ec' # 自建应用的secret
      corp_id: 'ww4c896580b063a80f'  # 企业ID

#inhibit_rules:
 # - source_match:
  #    severity: 'critical'
   # target_match:
    #  severity: 'warning'
   # equal: ['alertname', 'dev', 'instance']
- 创建告警模板
进入Alertmanager安装文件夹,创建告警模板文件
[root@prometheus ~]# cd /usr/local/alertmanager
[root@prometheus alertmanager]# mkdir template
[root@prometheus alertmanager]# cd template/
[root@prometheus template]# vi test.tmpl

# 将以下内容写入文件当中
[root@prometheus template]# cat test.tmpl
{{ define "wechat.default.message" }}
{{ range .Alerts }}
========监控报警==========
告警状态:{{   .Status }}
告警级别:{{ .Labels.severity }}
告警类型:{{ .Labels.alertname }}
告警应用:{{ .Annotations.summary }}
告警主机:{{ .Labels.instance }}
告警详情:{{ .Annotations.description }}
触发阀值:{{ .Annotations.value }}
告警时间:{{ .StartsAt.Format "2006-01-02 15:04:05" }}
========end============= {{ end }} {{ end }}
检查alertmanager.yml 配置是否正确
[root@prometheus template]# cd /usr/local/alertmanager
[root@prometheus alertmanager]# ./amtool check-config alertmanager.yml
Checking 'alertmanager.yml'  SUCCESS
Found:
 - global config
 - route
 - 0 inhibit rules
 - 1 receivers
 - 1 templates
  SUCCESS
配置正确,模板文件也已经识别-------》启动alertmanager
[root@prometheus alertmanager]# systemctl restart alertmanager
三、配置Prometheus
#  cd /usr/local/prometheus
#  vim prometheus.yml
修改Prometheus.yml文件中的 alerting 配置项及rule_files配置项
.........
  static_configs:
      - targets: ["localhost:9090"]
  - job_name: "web"  #表示被监控主机的名称
    static_configs:
      - targets: ["192.168.1.100:9100"]
        labels:
          app: web01
          nodename: web01
          role: web01
alerting:
  alertmanagers:
  - static_configs:
    - targets: ['localhost:9093']

rule_files: #配置告警规则
  - "rule.yml"
以下是Prometheus.yml 文件全部内容:
[root@prometheus prometheus]# cat prometheus.yml
# my global config
global:
  scrape_interval: 15s # Set the scrape interval to every 15 seconds. Default is every 1 minute.
  evaluation_interval: 15s # Evaluate rules every 15 seconds. The default is every 1 minute.
  # scrape_timeout is set to the global default (10s).

# Alertmanager configuration
alerting:
  alertmanagers:
    - static_configs:
        - targets: ['localhost:9093']
          # - alertmanager:9093

# Load rules once and periodically evaluate them according to the global 'evaluation_interval'.
rule_files:
  - "rule.yml"
  # - "first_rules.yml"
  # - "second_rules.yml"

# A scrape configuration containing exactly one endpoint to scrape:
# Here it's Prometheus itself.
scrape_configs:
  # The job name is added as a label `job=<job_name>` to any timeseries scraped from this config.
  - job_name: "prometheus"

    # metrics_path defaults to '/metrics'
    # scheme defaults to 'http'.

    static_configs:
      - targets: ["localhost:9090"]
  - job_name: "web"  #表示被监控主机的名称
    static_configs:
      - targets: ["192.168.1.100:9100"]
        labels:
          app: web01
          nodename: web01
          role: web01
创建并编写告警规则文件rule.yml
将以下内容写入文件当中,(此处用于测试,设置为当内存占用高于10%时,就会告警)
[root@prometheus prometheus]# vi rule.yml
[root@prometheus prometheus]# cat rule.yml
groups:
- name: mem-rule
  rules:
  - alert: "内存报警"
    expr: (node_memory_MemTotal_bytes - (node_memory_MemFree_bytes+node_memory_Buffers_bytes+node_memory_Cached_bytes )) / node_memory_MemTotal_bytes * 100 > 10
    for: 30s
    labels:
      severity: warning
    annotations:
      summary: "服务名:{{$labels.alertname}} 内存报警"
      description: "{{ $labels.alertname }} 内存资源利用率大于 10%"
      value: "{{ $value }}"
四、告警检测
重启Prometheus服务,使配置的告警规则生效
[root@prometheus prometheus]# systemctl restart prometheus
[root@prometheus prometheus]# systemctl restart alertmanager

浏览器访问 http://192.168.1.120:9093/#/alerts ,也能看到告警信息
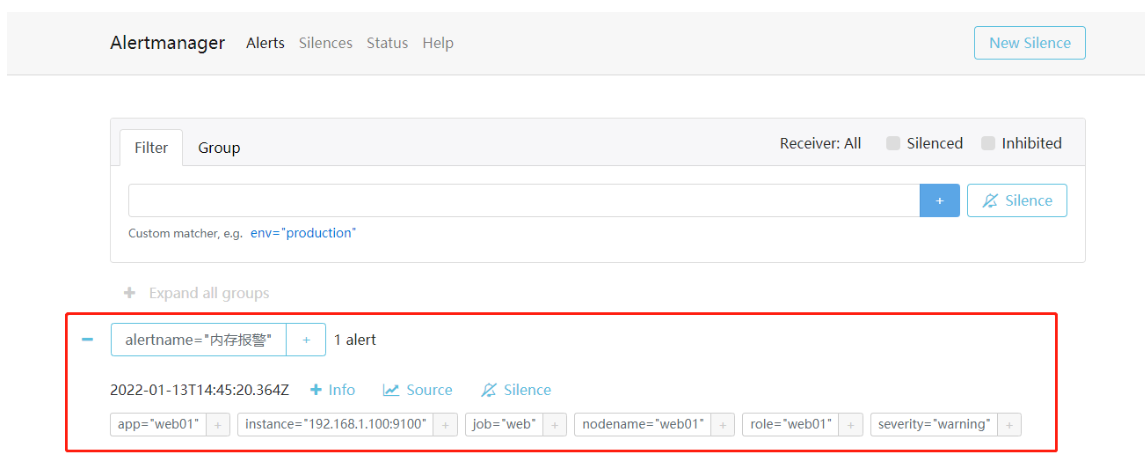
笔记配套视频效果更佳哦,视频地址:https://edu.51cto.com/lecturer/14390454.html


【推荐】国内首个AI IDE,深度理解中文开发场景,立即下载体验Trae
【推荐】编程新体验,更懂你的AI,立即体验豆包MarsCode编程助手
【推荐】抖音旗下AI助手豆包,你的智能百科全书,全免费不限次数
【推荐】轻量又高性能的 SSH 工具 IShell:AI 加持,快人一步
· .NET Core 中如何实现缓存的预热?
· 从 HTTP 原因短语缺失研究 HTTP/2 和 HTTP/3 的设计差异
· AI与.NET技术实操系列:向量存储与相似性搜索在 .NET 中的实现
· 基于Microsoft.Extensions.AI核心库实现RAG应用
· Linux系列:如何用heaptrack跟踪.NET程序的非托管内存泄露
· TypeScript + Deepseek 打造卜卦网站:技术与玄学的结合
· 阿里巴巴 QwQ-32B真的超越了 DeepSeek R-1吗?
· 【译】Visual Studio 中新的强大生产力特性
· 【设计模式】告别冗长if-else语句:使用策略模式优化代码结构
· 10年+ .NET Coder 心语 ── 封装的思维:从隐藏、稳定开始理解其本质意义