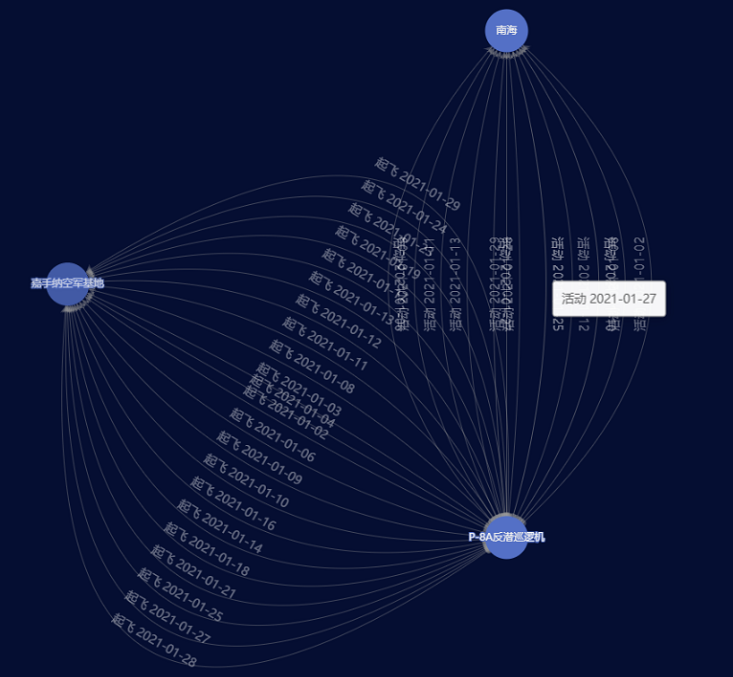
vue中嵌入echarts关系图(两节点间存在多条边)
效果图如下:

代码如下:
<template>
<div class="content">
<!-- 为Echarts准备一个具备大小(宽高)的容器 -->
<div id="myChart" style="height: 850px;margin:50px 0 auto;" ref="myChart"></div>
</div>
</template>
<script>
export default {
name:'echart',
data() {
return {
option:{},
};
},
created(){
this.getInitOption();
},
methods: {
// 配置图表配置项option
getInitOption(){
this.option = {
tooltip: { //提示框的配置
formatter: function (params) {
if(params.dataType == "node"){
return params.name
}else if(params.dataType == "edge"){
return params.value
}
}
},
animationDurationUpdate: 1500, //数据更新动画的时长 ,默认300
animationEasingUpdate: 'quinticInOut', //数据更新动画的缓动效果 , 默认cubicOut
series: [
{
type: 'graph', //系列类型:关系图
layout: 'force', //图的布局 :none(默认不采用任何布局,使用节点中提供的 x,y作为节点位置)
// circular(采用环形布局)
// force(采用力引导布局)
focusNodeAdjacency: true, //鼠标移动到节点上时突出显示节点以及节点的边和邻接节点(高亮效果)
force: { //力引导布局相关配置项
repulsion: 100, //节点之间的斥力因子(关系对象间的距离) ,默认50
edgeLength: 500 //边的两个节点之间的距离(关系对象连接线两端对象的距离) ,默认 30
},
itemStyle:{ //节点样式
normal:{
color:function(params){
if(params.data.id == '0000'){ //隐藏占位点(项目需要)
return 'rgb(5,14,50)'
}else{
return 'rgb(84,112,198)'
}
// return "#"+Math.floor(Math.random()*(256*256*256-1)).toString(16);
},
lineStyle:{
color:'#999'
}
}
},
symbol: 'circle', //标记的图形
symbolSize: 30, //标记的图形大小
roam: true, //是否开启鼠标缩放和平移漫游,默认不开启。如果只想开启缩放或者平移,设置成 'scale' 或 'move' 。设置为 true ,为都开启。
label: { //关系对象上的标签
show: true //是否显示标签
},
edgeSymbol: ['circle', 'arrow'], // 边两端的标记类型,可以是一个数组分别指定两端,也可以是单个统一指定。默认不显示标记,常见的可以设置为箭头
edgeSymbolSize: 8, //边两端的标记大小
edgeLabel: { //连接两个关系对象上的线上的标签
normal: {
show: true, //是否显示两个关系对象上的线上的标签
textStyle: {
fontSize: 14,
color:'#fff',
},
formatter: function(param) { // 标签内容
return param.value;
}
}
},
data: [], // 关系图的节点数据列表 ,注意:节点的
name不能重复 links: [], // 节点间的关系数据
lineStyle: { // 关系边的公共线条样式
opacity: 0.9,
width: 2,
curveness: 0
}
}
]
}
},
// 初始化关系图
drawGraph() {
// 基于准备好的dom,初始化echarts实例
let myChart = this.$echarts.init(this.$refs.myChart);
// 绘制图表
myChart.setOption(this.option,false);
},
//往data以及links里赋值
getEchartsData(oneData,oneLinks,status){
// oneData:节点数据 oneLinks:关系数据 status:状态(项目需要,不重要)
let that = this;
// 如果传入状态为 3 ,layout布局采用环形布局 ,默认为力引导布局( 项目需要 )
if(status == 3){
this.option.series[0].edgeSymbol = ['none','none'];
this.option.series[0].layout = 'circular';
//为四个点的关系且在环形布局,要求关系线如图所示 ,多添加一个点(目的:占位置)(项目需要)
if(status == 4){
let o = {
id: "0000",
name: "",
}
oneData.push(o)
}
}
// 初始化点
oneData.map((item,index) => {
this.option.series[0].data.push({
id:item.id,
name:item.name
})
})
// 初始化线
oneLinks.map((item,index)=>{
//设置关系连接线的曲线弧度
let count = 0;
that.option.series[0].links.map((linksItem)=>{
if((linksItem.source == item.fromId && linksItem.target == item.toId) || (linksItem.target == item.fromId && linksItem.source == item.toId)){
count ++
}
})
//设置线上显示的值( 项目需要 )
item.attributes.map((val,key)=>{
if(val.id == 'date'){
item.name = item.name + " " + val.value;
}
})
that.option.series[0].links.push({
source:item.fromId,
target:item.toId,
value:item.name,
lineStyle: { //设置关系边的线条样式
curveness: (count == 0) ? 0 : (((count%2) != 0) ? (-0.06*count) : (0.06*(count-1))) //设置边的曲度,支持从 0 到 1 的值,值越大曲度越大
// 这样写法在环形布局下,四个点的关系时,虽然设置了弧度,但是对角线两个点之间的关系线还是会重合
// 这个问题我的解决方法:在四个点的时候,多加一个点并且把这个点隐藏(个人认为是我的写法有问题,但是又没找到,希望我的写法不要误导大家)
// 如果没有要求关系线如图所示 弧度可以写成 0.2*count
},
})
})
this.drawGraph();
},
},
mounted() {
},
computed: {},
watch: {},
};
</script>
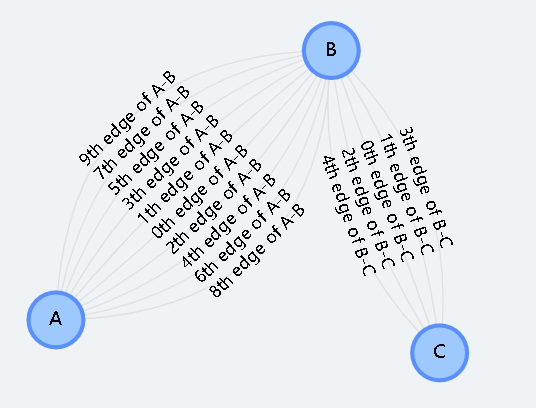
2、使用vantV-G6也可实现上述效果图
1、效果图

代码如下:
<template>
<section>
<div id="myChart" class="Echarts" ref="myChart" style="width: 100%; height: 100%"></div>
</section>
</template>
<script>
import G6 from '@antv/g6';
export default {
data () {
return {
data:{
nodes: [
{
id: 'node1',
x: 50,
y: 350,
label: 'A',
},
{
id: 'node2',
x: 250,
y: 150,
label: 'B',
},
{
id: 'node3',
x: 450,
y: 350,
label: 'C',
},
],
edges: [],
}
};
},
mounted () {
this.initChart();
},
methods: {
initChart(){
let that = this;
for (let i = 0; i < 10; i++) {
that.data.edges.push({
source: 'node1',
target: 'node2',
label: `${i}th edge of A-B`,
});
}
for (let i = 0; i < 5; i++) {
that.data.edges.push({
source: 'node2',
target: 'node3',
label: `${i}th edge of B-C`,
});
}
G6.Util.processParallelEdges(that.data.edges);
let container = document.getElementById('myChart');
let width = container.scrollWidth;
let height = container.scrollHeight || 500;
let graph = new G6.Graph({
container: container,
width,
height,
modes: {
default: ['drag-canvas','zoom-canvas', 'drag-node'],
},
fitCenter: true,
// the edges are linked to the center of source and target ndoes
linkCenter: true,
defaultNode: {
type: 'circle',
size: [40],
color: '#5B8FF9',
style: {
fill: '#9EC9FF',
lineWidth: 3,
},
labelCfg: {
style: {
fill: '#000',
fontSize: 14,
},
},
},
defaultEdge: {
type: 'quadratic',
labelCfg: {
autoRotate: true,
},
},
nodeStateStyles: {
// style configurations for hover state
hover: {
fillOpacity: 0.8,
},
// style configurations for selected state
selected: {
lineWidth: 5,
},
},
});
graph.data(that.data);
graph.render();
}
},
};
</script>
vantV-G6网址:https://g6.antv.antgroup.com/examples


 浙公网安备 33010602011771号