
Prometheus监控k8s(11)-PrometheusOperator自定义监控项-nginx/mysql并发送报警
自定义PrometheusOperator监控项-nginx/mysql
除了 Kubernetes 集群中的一些资源对象、节点以及组件需要监控,有的时候我们可能还需要根据实际的业务需求去添加自定义的监控项,添加一个自定义监控的步骤也是非常简单的。
- 第一步建立一个 ServiceMonitor 对象,用于 Prometheus 添加监控项
- 第二步为 ServiceMonitor 对象关联 metrics 数据接口的一个 Service 对象
- 第三步确保 Service 对象可以正确获取到 metrics 数据
1 自定义监控Nginx
步骤
1.创建采集工具使用deploy部署
2.创建采集工具Service
##clusterIP: None
3.创建ServiceMonitor
1.1 先helm部署Nginx
[root@k8s-master helm]# helm create nginx
Creating nginx

[root@k8s-master helm]# helm install nginx
NAME:   guiding-dachshund
LAST DEPLOYED: Fri Sep 27 11:37:08 2019
NAMESPACE: default
STATUS: DEPLOYED

RESOURCES:
==> v1/Deployment
NAME                     READY  UP-TO-DATE  AVAILABLE  AGE
guiding-dachshund-nginx  0/1    0           0          0s

==> v1/Pod(related)
NAME                                      READY  STATUS             RESTARTS  AGE
guiding-dachshund-nginx-54475b65c8-sl78p  0/1    ContainerCreating  0         0s

==> v1/Service
NAME                     TYPE       CLUSTER-IP      EXTERNAL-IP  PORT(S)  AGE
guiding-dachshund-nginx  ClusterIP  10.101.205.141  <none>       80/TCP   0s


NOTES:
1. Get the application URL by running these commands:
  export POD_NAME=$(kubectl get pods --namespace default -l "app.kubernetes.io/name=nginx,app.kubernetes.io/instance=guiding-dachshund" -o jsonpath="{.items[0].metadata.name}")
  echo "Visit http://127.0.0.1:8080 to use your application"
  kubectl port-forward $POD_NAME 8080:80

[root@k8s-master helm]# kubectl get pod,svc | grep nginx

pod/guiding-dachshund-nginx-54475b65c8-sl78p                1/1     Running   0          15s
service/guiding-dachshund-nginx                ClusterIP   10.101.205.141   <none>        80/TCP     15s
[root@k8s-master helm]#
[root@k8s-master helm]# curl  -I 10.101.205.141
HTTP/1.1 200 OK
Server: nginx/1.16.1
Date: Fri, 27 Sep 2019 03:37:56 GMT
Content-Type: text/html
Content-Length: 612
Last-Modified: Tue, 13 Aug 2019 10:05:00 GMT
Connection: keep-alive
ETag: "5d528b4c-264"
Accept-Ranges: bytes

[root@k8s-master helm]#
1.2 nginx监控
https://blog.51cto.com/billy98/2357919
prometheus对收集的数据格式是有一定的要求的,具体格式如下,只有符合此格式的prometheus才会正常的采集,所以在应用中我们需要能把关键性的监控数据以此格式抛出来。
nginx_http_connections{state="active"} 2
nginx_http_connections{state="reading"} 0
nginx_http_connections{state="waiting"} 1
nginx_http_connections{state="writing"} 1
nginx_http_request_bytes_sent{host="10.46.0.4"} 11055968
nginx_http_request_bytes_sent{host="testservers"} 4640
nginx_http_request_time_bucket{host="10.46.0.4",le="00.005"} 3960
至于怎么把监控指标数据抛出来,可能需要从应用本身动手。Prometheus社区也提供了大量的官方以及第三方Exporters,可以满足Prometheus的采纳者快速实现对关键业务,以及基础设施的监控需求。
官方以及第三方Exporters请参考此链接。
此处我们建议直接使用Prometheus的Client进行注册监控接口。Promehtues的Client目前支持大部分编程语言,支持列表可以参考如下文章。
prometheus client支持的语言列表。
本次是使用nginx demo镜像来演示。
1. 创建deployment和service
apiVersion: apps/v1beta1
kind: Deployment
metadata:
  name: nginx-demo
  labels:
    app: nginx-demo
spec:
  replicas: 1
  selector:
    matchLabels:
      app: nginx-demo
  template:
    metadata:
      labels:
        app: nginx-demo
    spec:
      containers:
      - name: nginx-demo
        image: billy98/nginx-prometheus-metrics:latest
        ports:
        - name: http-metrics
          containerPort: 9527
        - name: web
          containerPort: 80
        - name: test
          containerPort: 1314
        imagePullPolicy: IfNotPresent
---
apiVersion: v1
kind: Service
metadata:
  labels:
    app: nginx-demo
  name: nginx-demo
  namespace: default
spec:
  ports:
  - name: http-metrics
    port: 9527
    protocol: TCP
    targetPort: 9527
  - name: web
    port: 80
    protocol: TCP
    targetPort: 80
  - name: test
    port: 1314
    protocol: TCP
    targetPort: 1314
  selector:
    app: nginx-demo
  type: ClusterIP
2. 创建ServiceMonitor
由于prometheus里指定了serviceMonitor的标签必须release: p才会去抓取数据,所以在我们应用的ServiceMonitor中必须加上此标签。
[root@node-01 ~]# kubectl -n monitoring get prometheus p-prometheus -o yaml

...
  serviceMonitorSelector:
    matchLabels:
      release: p
...(其余内容省略)
apiVersion: monitoring.coreos.com/v1
kind: ServiceMonitor
metadata:
  labels:
    app: nginx-demo
    release: p
  name: nginx-demo
  namespace: monitoring
  #prometheus的namespace
spec:
  endpoints:
  - interval: 15s
    port: http-metrics
  namespaceSelector:
    matchNames:
    - default
    #nginx demo的namespace
  selector:
    matchLabels:
      app: nginx-demo
此处需要特别做些解释,serviceMonitor是Prometheus Operator中抽象的概念,他的作用就是讲配置Prometheus采集Target的配置变化成为动态发现的方式,可以serviceMonitor通过Deployment对应的Service配置进行挂钩,通过label selector选择Service,并自动发现后端容器。其中需要注意的是namespace字段永远为monitoring,而namespaceSelector中则是选择的应用所在的namespace。
创建完成可以看到endpoints
[root@k8s-master mysql]# kubectl get ep| grep nginx
guiding-dachshund-nginx   10.254.2.251:80                                       119m
nginx-demo                10.254.1.189:9527,10.254.1.189:80,10.254.1.189:1314   115m
[root@k8s-master mysql]#
然后我们访问10.254.1.189:1314 生成一些测试指标。
[root@k8s-master mysql]# curl 10.254.1.189:1314
hello world
[root@k8s-master mysql]#
查看监控数据
[root@k8s-master mysql]# curl 10.254.1.189:9527/metrics
# HELP nginx_http_connections Number of HTTP connections
# TYPE nginx_http_connections gauge
nginx_http_connections{state="active"} 3
nginx_http_connections{state="reading"} 0
nginx_http_connections{state="waiting"} 2
nginx_http_connections{state="writing"} 1
# HELP nginx_http_request_bytes_sent Number of HTTP request bytes sent
# TYPE nginx_http_request_bytes_sent counter
nginx_http_request_bytes_sent{host="10.254.1.189"} 1165650
nginx_http_request_bytes_sent{host="testservers"} 160
# HELP nginx_http_request_time HTTP request time
# TYPE nginx_http_request_time histogram
nginx_http_request_time_bucket{host="10.254.1.189",le="00.005"} 417
nginx_http_request_time_bucket{host="10.254.1.189",le="00.010"} 417
nginx_http_request_time_bucket{host="10.254.1.189",le="00.020"} 417
nginx_http_request_time_bucket{host="10.254.1.189",le="00.030"} 417
nginx_http_request_time_bucket{host="10.254.1.189",le="00.050"} 417
nginx_http_request_time_bucket{host="10.254.1.189",le="00.075"} 417
nginx_http_request_time_bucket{host="10.254.1.189",le="00.100"} 417
3. 验证
访问Prometheus,验证数据采集,打开Status下的Service Discovery,active的数目等于Pod数据即表示采集正常
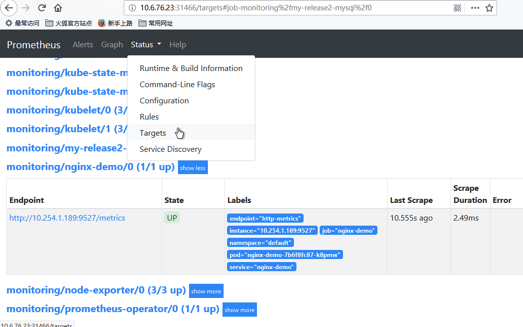
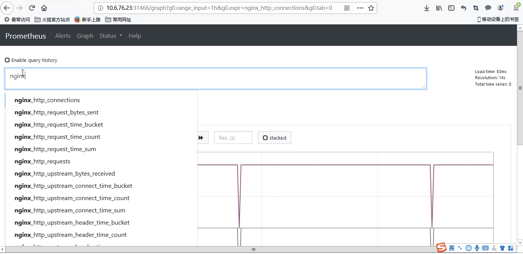
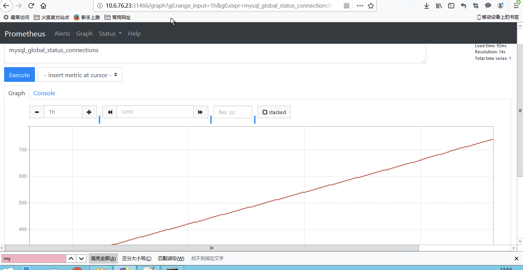
打开Graph页面,选择我们刚才推送的数据指标名称,点击Execute,即可查看到采集上来的数据。prometheus查询语法请参考prometheus查询语句示例。
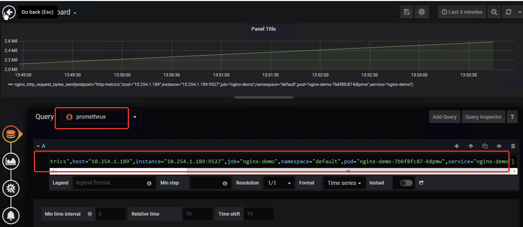
1.3 Nginx添加到grafanan
这个没有特别好的模板,可以自己创建直接选prometheus,把SQL查询语句放上去调整就行了
2 自定义监控MySQL
https://blog.csdn.net/travellersY/article/details/84632679
照旧老三步
步骤
1.创建采集工具使用deploy部署
2.创建采集工具Service
##clusterIP: None
3.创建ServiceMonitor
2.1 部署一个MySQL作为监控样例
最简单的k8s-mysql部署
# cat mysql-deploy.yaml
apiVersion: extensions/v1beta1
kind: Deployment            #副本控制器Deployment
metadata:
  name: mysql                          #Deployment的名称,全局唯一
spec:
  replicas: 1                          #Pod副本的期待数量
  template:                            #根据此模版创建Pod的副本(实例)
    metadata:
       labels:
         app: mysql                    #Pod副本拥有的标签,对应Deployment的selector
    spec:
       containers:                     #Pod内,定义容器
       - name: mysql                   #容器名称
         image: mysql:5.7              #Docker image
         ports:
         - containerPort: 3306         #容器应用监听的端口
         env:                          #注入容器内的环境变量
         - name: MYSQL_ROOT_PASSWORD   #这里设置root初始密码
           value: "123456"
# cat mysql-svc.yaml
apiVersion: v1
kind: Service
metadata:
  name: mysql
spec:
  type: NodePort
  ports:
  - port: 3306
    nodePort: 30001
  selector:
    app: mysql
连接测试
[root@k8s-master ~]# kubectl get pod,svc | grep mysql


pod/mysql-94f6bbcfd-9nl7w                                   1/1     Running   0          116m
service/mysql                                  NodePort    10.106.33.138    <none>        3306:30001/TCP   110m
[root@k8s-master ~]# mysql -uroot -p123456 -h10.106.33.138 -P3306
Welcome to the MariaDB monitor.  Commands end with ; or \g.
Your MySQL connection id is 656
Server version: 5.7.27 MySQL Community Server (GPL)

Copyright (c) 2000, 2018, Oracle, MariaDB Corporation Ab and others.

Type 'help;' or '\h' for help. Type '\c' to clear the current input statement.

MySQL [(none)]> Bye

[root@k8s-master ~]# mysql -uroot -p123456 -h10.6.76.23 -P30001
Welcome to the MariaDB monitor.  Commands end with ; or \g.
Your MySQL connection id is 661
Server version: 5.7.27 MySQL Community Server (GPL)

Copyright (c) 2000, 2018, Oracle, MariaDB Corporation Ab and others.

Type 'help;' or '\h' for help. Type '\c' to clear the current input statement.

MySQL [(none)]>
2.2 下载prometheus-mysql-exporter
[root@k8s-master helm]# mkdir helm_chart
[root@k8s-master helm]# cd helm_chart/
[root@k8s-master helm_chart]# ls
[root@k8s-master helm_chart]# git clone https://github.com/helm/charts.git
正克隆到 'charts'...
remote: Enumerating objects: 7, done.
remote: Counting objects: 100% (7/7), done.
remote: Compressing objects: 100% (7/7), done.
remote: Total 84313 (delta 2), reused 2 (delta 0), pack-reused 84306
接收对象中: 100% (84313/84313), 23.63 MiB | 80.00 KiB/s, done.
处理 delta 中: 100% (61834/61834), done.
[root@k8s-master helm_chart]#

[root@k8s-master helm_chart]# cd charts/stable/prometheus-mysql-exporter/
[root@k8s-master prometheus-mysql-exporter]# ls
a.yaml  Chart.yaml  OWNERS  README.md    templates  values.yaml
[root@k8s-master prometheus-mysql-exporter]#
2.3 创建prometheus-mysql-exporter服务
在kubernetes中添加mysql监控的exporter:prometheus-mysql-exporter 这里采用helm的方式安装prometheus-mysql-exporter,按照github上的步骤进行安装,修改values.yaml中的datasource为安装在kubernetes中mysql的地址
[root@k8s-master prometheus-mysql-exporter]# cat values.yaml
...
mysql:
  db: ""
  host: "10.106.33.138"
  param: ""
  pass: "123456"
  port: 3306
  protocol: ""
  user: "root"
创建
helm install --name my-release -f values.yaml  ../prometheus-mysql-exporter
[root@k8s-master prometheus-mysql-exporter]# kubectl get pod,svc | grep mysql

pod/my-release-prometheus-mysql-exporter-75cb8bffc7-qqckz   1/1     Running   0          107m
pod/mysql-94f6bbcfd-9nl7w                                   1/1     Running   0          120m
service/my-release-prometheus-mysql-exporter   ClusterIP   10.104.90.123    <none>        9104/TCP         107m
service/mysql                                  NodePort    10.106.33.138    <none>        3306:30001/TCP   113m
[root@k8s-master prometheus-mysql-exporter]#
测试与MySQL连接
当指标值为1时表示能够正常获取监控数据,如果不是1请排查MySQL连接设置,权限,日志等
[root@k8s-master prometheus-mysql-exporter]# curl 10.104.90.123:9104/metrics|grep mysql_up
  % Total    % Received % Xferd  Average Speed   Time    Time     Time  Current
                                 Dload  Upload   Total   Spent    Left  Speed
100  177k  100  177k    0     0  3176k      0 --:--:-- --:--:-- --:--:-- 3231k
# HELP mysql_up Whether the MySQL server is up.
# TYPE mysql_up gauge
mysql_up 1
[root@k8s-master prometheus-mysql-exporter]#
2.4 创建ServiceMonitor
apiVersion: monitoring.coreos.com/v1
kind: ServiceMonitor  #资源类型为ServiceMonitor
metadata:
  labels:
    prometheus: kube-prometheus #prometheus默认通过 prometheus: kube-prometheus发现ServiceMonitor,只要写上这个标签prometheus服务就能发现这个ServiceMonitor
  name: prometheus-exporter-mysql
  namespace: monitoring
spec:
  jobLabel: app #jobLabel指定的标签的值将会作为prometheus配置文件中scrape_config下job_name的值,也就是Target,如果不写,默认为service的name
  selector:
    matchLabels: #该ServiceMonitor匹配的Service的labels,如果使用mathLabels,则下面的所有标签都匹配时才会匹配该service,如果使用matchExpressions,则至少匹配一个标签的service都会被选择
      app: prometheus-mysql-exporter # 由于前面查看mysql-exporter的service信息中标签包含了app: prometheus-mysql-exporter这个标签,写上就能匹配到
  namespaceSelector:
    #any: true #表示从所有namespace中去匹配,如果只想选择某一命名空间中的service,可以使用matchNames: []的方式
    matchNames:
    - default
  endpoints:
  - port: mysql-exporter #前面查看mysql-exporter的service信息中,提供mysql监控信息的端口是Port: mysql-exporter  9104/TCP,所以这里填mysql-exporter
    interval: 30s #每30s获取一次信息
  # path: /metrics HTTP path to scrape for metrics,默认值为/metrics
    honorLabels: true
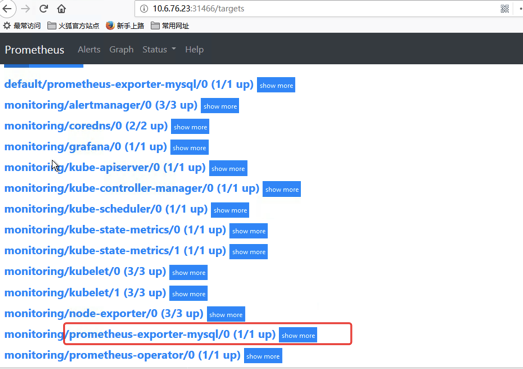
[root@k8s-master prometheus-mysql-exporter]# kubectl get servicemonitors.monitoring.coreos.com  -n monitoring
NAME                        AGE
alertmanager                3d3h
coredns                     3d3h
grafana                     3d3h
kube-apiserver              3d3h
kube-controller-manager     3d3h
kube-scheduler              3d3h
kube-state-metrics          3d3h
kubelet                     3d2h
node-exporter               3d3h
prometheus-exporter-mysql   89m
prometheus-operator         3d3h
[root@k8s-master prometheus-mysql-exporter]#
部分监控指标:
查询速率:
mysql_global_status_questions

写操作速率
sum(rate(mysql_global_status_commands_total{command=~"insert|update|delete"}[2m])) without (command)

MySQL默认的最大链接数为151。临时调整最大连接数,可以通过以下指令进行设置:
SET GLOBAL max_connections = 200;
如果想永久化设置,则需要通过修改MySQL配置文件my.cnf,添加以下内容:
max_connections = 200


剩余连接
mysql_global_variables_max_connections - mysql_global_status_threads_connected
当前拒绝连接:
mysql_global_status_aborted_connects

2分钟内磁盘读取请求次数的增长率的变化情况:
rate(mysql_global_status_innodb_buffer_pool_reads[2m])
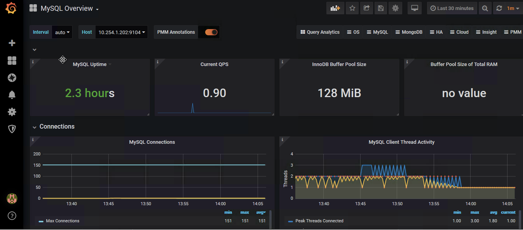
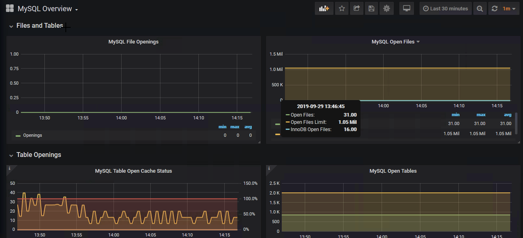
2.5 添加到grafana
我们使用7362模板
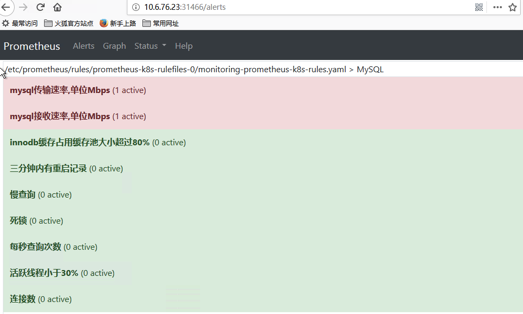
2.6 报警规则
[root@k8s-master manifests]# pwd
/root/prometheus/operator/kube-prometheus/manifests
[root@k8s-master manifests]# tail -78 prometheus-rules.yaml

############
  - name: MySQL
    rules:
    - alert: 三分钟内有重启记录
      expr: mysql_global_status_uptime < 180
      for: 2m
      labels:
        severity: warning
      annotations:
        summary: "{{$labels.instance}}: Mysql_Instance_Reboot detected"
        description: "{{$labels.instance}}: Mysql_Instance_Reboot in 3 minute (up to now is: {{ $value }} seconds"

    - alert: 每秒查询次数
      expr: rate(mysql_global_status_questions[5m]) > 500
      for: 2m
      labels:
        severity: warning
      annotations:
        summary: "{{$labels.instance}}: Mysql_High_QPS detected"
        description: "{{$labels.instance}}: Mysql opreation is more than 500 per second ,(current value is: {{ $value }})"
    - alert: 连接数
      expr: rate(mysql_global_status_connections[5m]) > 100
      for: 2m
      labels:
        severity: warning
      annotations:
        summary: "{{$labels.instance}}: Mysql Too Many Connections detected"
        description: "{{$labels.instance}}: Mysql Connections is more than 100 per second ,(current value is: {{ $value }})"
    - alert: mysql接收速率,单位Mbps
      expr: rate(mysql_global_status_bytes_received[3m]) * 1024 * 8   > 100
      for: 2m
      labels:
        severity: warning
      annotations:
        summary: "{{$labels.instance}}: Mysql_High_Recv_Rate detected"
        description: "{{$labels.instance}}: Mysql_Receive_Rate is more than 100Mbps ,(current value is: {{ $value }})"
    - alert: mysql传输速率,单位Mbps
      expr: rate(mysql_global_status_bytes_sent[3m])  * 1024 * 8   > 100
      for: 2m
      labels:
        severity: warning
      annotations:
        summary: "{{$labels.instance}}: Mysql_High_Send_Rate detected"
        description: "{{$labels.instance}}: Mysql data Send Rate is more than 100Mbps ,(current value is: {{ $value }})"
    - alert: 慢查询
      expr: rate(mysql_global_status_slow_queries[30m]) > 3
      for: 2m
      labels:
        severity: warning
      annotations:
        summary: "{{$labels.instance}}: Mysql_Too_Many_Slow_Query detected"
        description: "{{$labels.instance}}: Mysql current Slow_Query Sql is more than 3 ,(current value is: {{ $value }})"
    - alert: 死锁
      expr: mysql_global_status_innodb_deadlocks > 0
      for: 2m
      labels:
        severity: warning
      annotations:
        summary: "{{$labels.instance}}: Mysql_Deadlock detected"
        description: "{{$labels.instance}}: Mysql Deadlock was found ,(current value is: {{ $value }})"
    - alert: 活跃线程小于30%
      expr: mysql_global_status_threads_running / mysql_global_status_threads_connected * 100 < 30
      for: 2m
      labels:
        severity: warning
      annotations:
        summary: "{{$labels.instance}}: Mysql_Too_Many_sleep_threads detected"
        description: "{{$labels.instance}}: Mysql_sleep_threads percent is more than {{ $value }}, please clean the sleeping threads"
    - alert: innodb缓存占用缓存池大小超过80%
      expr: (mysql_global_status_innodb_page_size * on (instance) mysql_global_status_buffer_pool_pages{state="data"} +  on (instance) mysql_global_variables_innodb_log_buffer_size +  on (instance) mysql_global_variables_innodb_additional_mem_pool_size + on (instance)  mysql_global_status_innodb_mem_dictionary + on (instance)  mysql_global_variables_key_buffer_size + on (instance)  mysql_global_variables_query_cache_size + on (instance) mysql_global_status_innodb_mem_adaptive_hash )  / on (instance) mysql_global_variables_innodb_buffer_pool_size * 100 > 80
      for: 2m
      labels:
        severity: warning
      annotations:
        summary: "{{$labels.instance}}: Mysql_innodb_Cache_insufficient detected"
        description: "{{$labels.instance}}: Mysql innodb_Cache was used more than 80% ,(current value is: {{ $value }})"
3 配置发送报警
3.1 查看相关配置文件
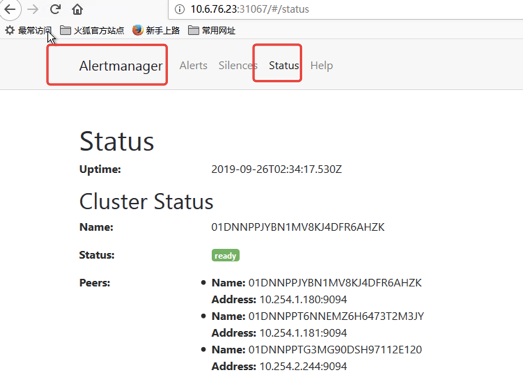
添加一个报警规则配置项,可以通过 AlertManager 的配置文件去配置各种报警接收器
首先我们将 alertmanager-main 这个 Service 改为 NodePort 类型的 Service,修改完成后我们可以在页面上的 status 路径下面查看 AlertManager 的配置信息:
[root@k8s-master manifests]# cat  alertmanager-service.yaml
apiVersion: v1
kind: Service
metadata:
  labels:
    alertmanager: main
  name: alertmanager-main
  namespace: monitoring
spec:
  type: NodePort
  ports:
  - name: web
    port: 9093
    targetPort: web
  selector:
    alertmanager: main
    app: alertmanager
  sessionAffinity: ClientIP
这些配置信息实际上是来自于我们之前在prometheus-operator/contrib/kube-prometheus/manifests目录下面创建的 alertmanager-secret.yaml 文件:
[root@k8s-master manifests]# cat alertmanager-secret.yaml
apiVersion: v1
data:
  alertmanager.yaml: Imdsb2JhbCI6CiAgInJlc29sdmVfdGltZW91dCI6ICI1bSIKInJlY2VpdmVycyI6Ci0gIm5hbWUiOiAibnVsbCIKInJvdXRlIjoKICAiZ3JvdXBfYnkiOgogIC0gImpvYiIKICAiZ3JvdXBfaW50ZXJ2YWwiOiAiNW0iCiAgImdyb3VwX3dhaXQiOiAiMzBzIgogICJyZWNlaXZlciI6ICJudWxsIgogICJyZXBlYXRfaW50ZXJ2YWwiOiAiMTJoIgogICJyb3V0ZXMiOgogIC0gIm1hdGNoIjoKICAgICAgImFsZXJ0bmFtZSI6ICJXYXRjaGRvZyIKICAgICJyZWNlaXZlciI6ICJudWxsIg==
kind: Secret
metadata:
  name: alertmanager-main
  namespace: monitoring
type: Opaque
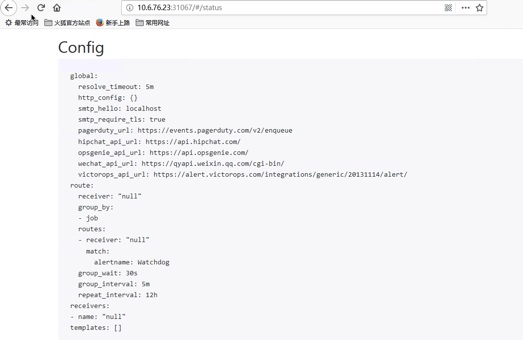
可以将 alertmanager.yaml 对应的 value 值做一个 base64 解码:
[root@k8s-master manifests]# echo "Imdsb2JhbCI6CiAgInJlc29sdmVfdGltZW91dCI6ICI1bSIKInJlY2VpdmVycyI6Ci0gIm5hbWUiOiAibnVsbCIKInJvdXRlIjoKICAiZ3JvdXBfYnkiOgogIC0gImpvYiIKICAiZ3JvdXBfaW50ZXJ2YWwiOiAiNW0iCiAgImdyb3VwX3dhaXQiOiAiMzBzIgogICJyZWNlaXZlciI6ICJudWxsIgogICJyZXBlYXRfaW50ZXJ2YWwiOiAiMTJoIgogICJyb3V0ZXMiOgogIC0gIm1hdGNoIjoKICAgICAgImFsZXJ0bmFtZSI6ICJXYXRjaGRvZyIKICAgICJyZWNlaXZlciI6ICJudWxsIg==" |base64 -d
"global":
  "resolve_timeout": "5m"
"receivers":
- "name": "null"
"route":
  "group_by":
  - "job"
  "group_interval": "5m"
  "group_wait": "30s"
  "receiver": "null"
  "repeat_interval": "12h"
  "routes":
  - "match":
      "alertname": "Watchdog"
    "receiver": "null"[root@k8s-master manifests]#
3.2 准备钉钉机器人
这个和之前都一样
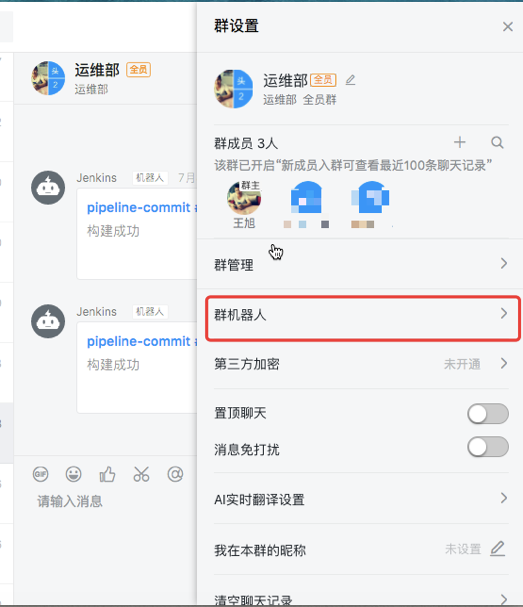
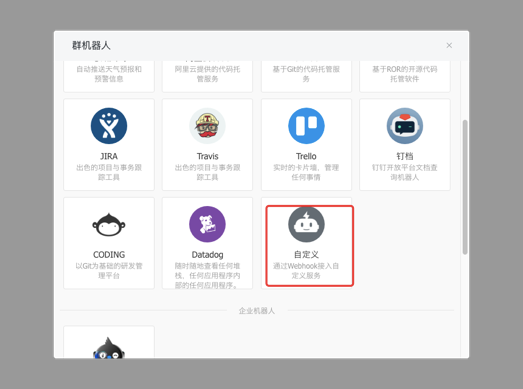
悲催的是赶上钉钉升级,机器人新建不了,我们用之前的Jenkins留下的
3.3 配置钉钉报警发送
[root@k8s-master manifests]# cat dingtalk.yaml
apiVersion: extensions/v1beta1
kind: Deployment
metadata:
  name: dingtalk-hook
  namespace: monitoring
spec:
  template:
    metadata:
      labels:
        app: dingtalk-hook
    spec:
      containers:
      - name: dingtalk-hook
        image: cnych/alertmanager-dingtalk-hook:v0.2
        imagePullPolicy: IfNotPresent
        ports:
        - containerPort: 5000
          name: http
        env:
        - name: ROBOT_TOKEN
          valueFrom:
            secretKeyRef:
              name: dingtalk-secret
              key: token
        resources:
          requests:
            cpu: 50m
            memory: 100Mi
          limits:
            cpu: 50m
            memory: 100Mi

---
apiVersion: v1
kind: Service
metadata:
  name: dingtalk-hook
  namespace: monitoring
spec:
  selector:
    app: dingtalk-hook
  ports:
  - name: hook
    port: 5000
    targetPort: http
要注意上面我们声明了一个 ROBOT_TOKEN 的环境变量,由于这是一个相对于私密的信息,所以我们这里从一个 Secret 对象中去获取,通过如下命令创建一个名为 dingtalk-secret 的 Secret 对象,然后部署上面的资源对象即可:
[root@k8s-master alertmanager]# kubectl create secret generic dingtalk-secret --from-literal=token=17549607d838b3015d183384ffe53333b13df0a98563150df241535808e10781 -n kube-system
secret/dingtalk-secret created
[root@k8s-master alertmanager]# kubectl create -f dingtalk-hook.yaml
deployment.extensions/dingtalk-hook created
service/dingtalk-hook created
[root@k8s-master manifests]# kubectl -n monitoring get secrets | grep dingtalk
dingtalk-secret                   Opaque                                1      61m
[root@k8s-master manifests]# kubectl -n monitoring get pod,svc | grep dingtalk
pod/dingtalk-hook-686ddd6976-pq4fk        1/1     Running            0          59m

service/dingtalk-hook           ClusterIP   10.111.250.130   <none>        5000/TCP                     59m
[root@k8s-master manifests]#
3.4 配置报警接收
部署成功后,现在我们就可以给 AlertManager 配置一个 webhook 了,在上面的配置中增加一个路由接收器
[root@k8s-master manifests]# cat alertmanager.yaml
global:
  resolve_timeout: 5m
  smtp_smarthost: 'smtp.163.com:25'
  smtp_from: 'w.jjwx@163.com'
  smtp_auth_username: 'w.jjwx@163.com'
  smtp_auth_password: '密码'
  smtp_hello: '163.com'
  smtp_require_tls: false
route:
  group_by: ['job', 'severity']
  group_wait: 30s
#测试配置的时间较短
  group_interval: 1m
  repeat_interval: 2m

  #group_interval: 5m
  #repeat_interval: 12h

  receiver: default
 # receiver: webhook
  routes:
  - receiver: webhook
    match:
      alertname: CPUThrottlingHigh
receivers:
- name: 'default'
  email_configs:
  - to: '314144952@qq.com'
    send_resolved: true
- name: 'webhook'
  webhook_configs:
  - url: 'http://dingtalk-hook.monitoring:5000'
    send_resolved: true
将上面文件保存为 alertmanager.yaml,然后使用这个文件创建一个 Secret 对象:
将上面文件保存为 alertmanager.yaml,然后使用这个文件创建一个 Secret 对象:
# 先将之前的 secret 对象删除
kubectl delete secret alertmanager-main -n monitoring
kubectl create secret generic alertmanager-main --from-file=alertmanager.yaml -n monitoring
加载配置文件
[root@k8s-master manifests]# kubectl -n monitoring get svc
NAME                    TYPE        CLUSTER-IP       EXTERNAL-IP   PORT(S)                      AGE
alertmanager-main       NodePort    10.109.59.250    <none>        9093:30583/TCP               13m
alertmanager-operated   ClusterIP   None             <none>        9093/TCP,9094/TCP,9094/UDP   9m
dingtalk-hook           ClusterIP   10.111.250.130   <none>        5000/TCP                     151m
grafana                 NodePort    10.100.31.73     <none>        3000:32339/TCP               4d2h
kube-state-metrics      ClusterIP   None             <none>        8443/TCP,9443/TCP            4d2h
node-exporter           ClusterIP   None             <none>        9100/TCP                     4d2h
prometheus-adapter      ClusterIP   10.97.88.175     <none>        443/TCP                      4d2h
prometheus-k8s          NodePort    10.97.199.239    <none>        9090:31466/TCP               4d2h
prometheus-operated     ClusterIP   None             <none>        9090/TCP                     4d2h
prometheus-operator     ClusterIP   None             <none>        8080/TCP                     4d2h
[root@k8s-master manifests]# curl -X POST "http://10.109.59.250:9093/-/reload"
[root@k8s-master manifests]# curl -X POST "http://10.97.199.239:9090/-/reload"
[root@k8s-master manifests]#
如果配置文件有错的,会爆出来
[root@k8s-master manifests]# curl -X POST "http://10.109.59.250:9093/-/reload"
failed to reload config: undefined receiver "webhook" used in route
[root@k8s-master manifests]#
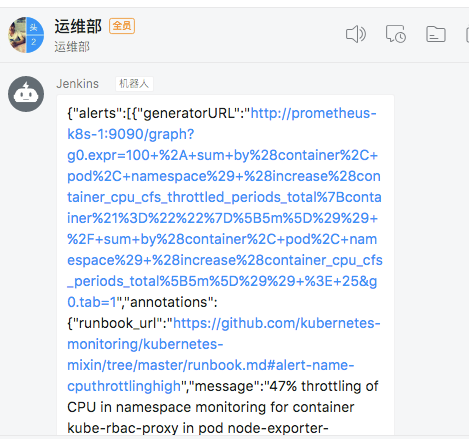
我们添加了两个接收器,默认的通过邮箱进行发送,对于 CPUThrottlingHigh这个报警我们通过 webhook 来进行发送,这个 webhook 就是我们前面课程中定义的一个钉钉接收的 Server,上面的步骤创建完成后,很快我们就会收到一条钉钉消息:
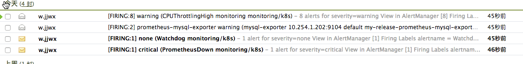
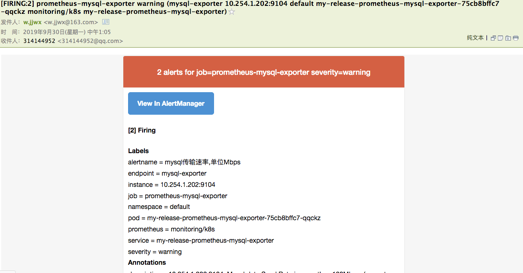
钉钉

 浙公网安备 33010602011771号