
Prometheus监控k8s(6)-prometheus监控ingress-nginx
Prometheus监控ingress-nginx
Prometheus的数据指标是通过一个公开的 HTTP(S) 数据接口获取到的,我们不需要单独安装监控的 agent,只需要暴露一个 metrics 接口,Prometheus 就会定期去拉取数据;对于一些普通的 HTTP 服务,我们完全可以直接重用这个服务,添加一个/metrics接口暴露给 Prometheus;而且获取到的指标数据格式是非常易懂的,不需要太高的学习成本。
现在很多服务从一开始就内置了一个/metrics接口,比如 Kubernetes 的各个组件、istio 服务网格都直接提供了数据指标接口。有一些服务即使没有原生集成该接口,也完全可以使用一些 exporter 来获取到指标数据,比如 mysqld_exporter、node_exporter,这些 exporter 就有点类似于传统监控服务中的 agent,作为一直服务存在,用来收集目标服务的指标数据然后直接暴露给 Prometheus。
在nginx ingress controller的官方文档中对监控有相应描述
https://kubernetes.github.io/ingress-nginx/user-guide/monitoring/
配置监控
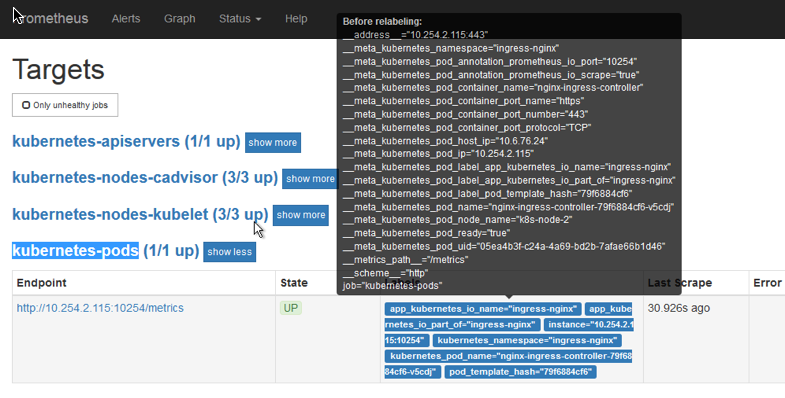
按照我之前的部署方式,官方默认实现了对pod的自动发现(自动发现参考后文),对ingress-nginx已经自动监控
如果没有自动监控
修改prometheus的配置,增加对ingress nginx的监控配置,可按照官方yaml
进行修改:
#vim prometheus-configmap.yaml
- job_name: 'ingress-nginx-endpoints'
  kubernetes_sd_configs:
  - role: pod
    namespaces:
      names:
      - ingress-nginx
  relabel_configs:
  - source_labels: [__meta_kubernetes_pod_annotation_prometheus_io_scrape]
    action: keep
    regex: true
  - source_labels: [__meta_kubernetes_pod_annotation_prometheus_io_scheme]
    action: replace
    target_label: __scheme__
    regex: (https?)
  - source_labels: [__meta_kubernetes_pod_annotation_prometheus_io_path]
    action: replace
    target_label: __metrics_path__
    regex: (.+)
  - source_labels: [__address__, __meta_kubernetes_pod_annotation_prometheus_io_port]
    action: replace
    target_label: __address__
    regex: ([^:]+)(?::\d+)?;(\d+)
    replacement: $1:$2
  - source_labels: [__meta_kubernetes_service_name]
    regex: prometheus-server
    action: drop
#重新apply一下configmap
kubectl apply -f prometheus-configmap.yaml
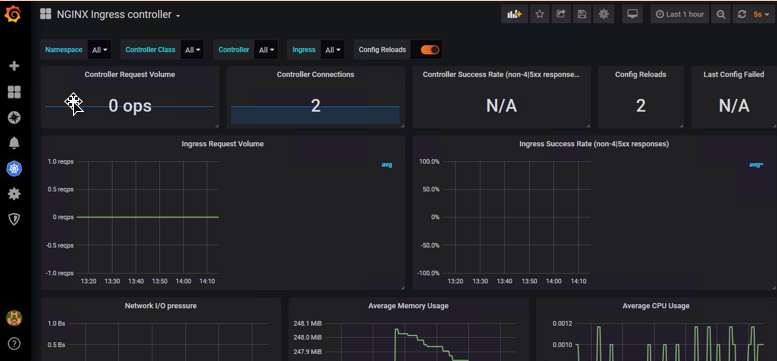
配置grafana图形
https://grafana.com/grafana/dashboards/9614
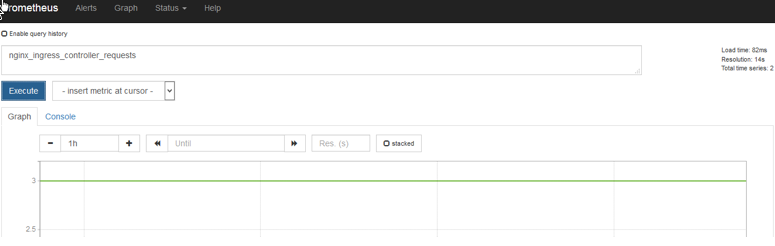
我的没有访问数据为空是正常的

 浙公网安备 33010602011771号