pytorch_基于CIFAR创建自己的数据集并显示图像
创建完自己的数据集训练完之后,开始了预测,如何看到预测图像 Next
- import cv2 用来显示图像
- 在原有测试数据文件中 增加图像显示功能
def TestingData(self):
model_net = torch.load('model_shanbu_128.pkl')
self.LoadData()
# 构造测试的dataloader
dataiter = iter(self.testloader)
# 预测正确的数量和总数量
correct = 0
total = 0
# 使用torch.no_grad的话在前向传播中不记录梯度,节省内存
to_pil_image = transforms.ToPILImage()
with torch.no_grad():
for images, labels in dataiter:
# images, labels = data
# print(images)
print(len(images.data))
outputs = model_net(images)
# 我们的网络输出的实际上是个概率分布,去最大概率的哪一项作为预测分类
_, predicted = torch.max(outputs.data, 1)
total += labels.size(0)
correct += (predicted == labels).sum().item()
# print(images.data[0])
# print(len(images.data[0]))
for i in range(len(images.data)):
# img = to_pil_image(images.data[i])
img = images.data[i] #
img = img.numpy() # FloatTensor转为ndarray
img = np.transpose(img, (2, 1, 0))
img = img/2 +0.5
# img.show()
# img_cv = cv2.cvtColor(img, cv2.COLOR_RGB2BGR)
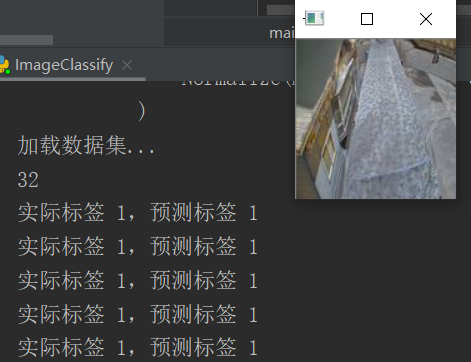
cv2.imshow('predictPic', img)
print('实际标签 {},预测标签 {}'.format(labels[i],predicted[i]))
cv2.waitKey(0)
cv2.destroyAllWindows()
print('Accuracy of the self.network on the 10000 test images: %d %%' % (
100 * correct / total))
显示预测结果 并展示当前图像
posted on 2020-05-29 14:40 wangxiaobei2019 阅读(467) 评论(0) 收藏 举报


 浙公网安备 33010602011771号