

Performance difference of graph-based and alignment-based hybrid error correction methods for error-prone long reads
Performance difference of graph-based and alignment-based hybrid error correction methods for error-prone long reads
针对 容易出错的长读,基于图 和 基于对准 的混合纠错方法的性能差异
Abstract
The error-prone third-generation sequencing (TGS) long reads can be corrected by the high-quality second-generation sequencing (SGS) short reads, which is referred to as hybrid error correction. We here investigate the influences of the principal algorithmic factors of two major types of hybrid error correction methods by mathematical modeling and analysis on both simulated and real data. Our study reveals the distribution of accuracy gain with respect to the original long read error rate. We also demonstrate that the original error rate of 19% is the limit for perfect correction, beyond which long reads are too error-prone to be corrected by these methods.
易出错的第三代测序(TGS)长reads可以通过高质量的第二代测序(SGS)短reads进行校正,即杂交纠错。
本文通过对模拟数据和真实数据的数学建模和分析,研究了两种主要类型的混合误差修正方法的主要算法因素的影响。
我们的研究揭示了相对于原始长读错误率的准确度增益的分布。
我们还证明,原始错误率为19%是完美纠正的极限,超过这个限度,长读的错误就太容易被这些方法纠正。
Background
Third-generation sequencing (TGS) technologies [1], including Pacific Biosciences (PacBio) and Oxford Nanopore Technologies (ONT), have been demonstrated useful in many biomedical research since the unprecedented read lengths (average for PacBio and ONT can be over 10 kb and 20 kb, and maximum over 60 kb and 800 kb) are very informative for addressing complex problems, such as genome assembly and haplotyping [1,2,3,4,5,6,7,8,9,10]. However, the high error rates of TGS data (average 10–15% for the raw data) [11,12,13,14] reduce the mappability and the resolution of downstream analysis. To address this limitation, the high-quality short reads have been used to correct the long reads, which is termed as hybrid error correction. The existing hybrid error correction methods can be classified into two categories: alignment-based method [15,16,17,18,19,20,21] and de Bruijn graph (DBG)-based method (referred as “graph-based method”) [22,23,24,25,26]. Regardless of the lower algorithmic complexity by the graph-based method than the alignment-based one [27] and the difference of software implementations, several principal factors have significant effects on the error correction performance for both methods: long read error rate, short read error rate, short read coverage, alignment criterion, and solid k-mer size. Although previous studies examined some of these factors separately in the corresponding software development [28,29,30], here we establish mathematical frameworks to perform a comprehensive investigation of all these factors in hybrid error correction. Through studying their influences on short read alignment rate and solid k-mer detection in DBG, we finally interrogate how these factors determinate the accuracy gain in hybrid error correction. This research does not only study the algorithmic frameworks of two major hybrid error correction methods, more importantly it also offers an informative guidance for method selection, parameter design, and future method development for long read error correction.
第三代测序(TGS)技术[1],包括太平洋生物科学(PacBio)和牛津纳米孔技术(ONT),在许多生物医学研究中被证明是有用的,因为前所未有的读取长度(PacBio和ONT的平均长度可超过10kb和20kb,最大可超过60kb和800kb)对于解决基因组组装和单倍型[1-10]等复杂问题非常有用]。 然而,TGS数据的高错误率(原始数据的平均10-15%)[11-14]降低了下游分析的可映射性和分辨率。 为了解决这一限制,高质量的短读被用来纠正长读,这被称为混合纠错。
现有的混合纠错方法可分为两类:基于对齐的方法[15-21]和基于de Bruijn图(DBG)的方法(称为“基于图的方法”)[22-26]。
尽管基于图形的方法比基于对齐的方法具有更低的算法复杂度[27]以及软件实现的差异,但几个主要因素对这两种方法的纠错性能都有显著的影响:长读错误率、短读错误率、短读覆盖率、对齐准则和实心k-mer大小。 虽然以前的研究在相应的软件开发[28-30]中分别研究了其中的一些因素,但在这里我们建立了数学框架,对混合纠错中的所有这些因素进行了全面的研究。 通过研究它们对DBG中短读对准率和实k-mer检测的影响,最后探讨了这些因素是如何决定混合纠错精度增益的。
本研究不仅研究了两种主要的混合纠错方法的算法框架,更重要的是为长读纠错的方法 选择、参数设计和未来方法开发提供了信息指导。
Results and discussion
Overall, we first evaluate the accuracy gains by the alignment-based and graph-based methods at each error rate level by mathematical modeling, following by validating the model fitness with simulated and real data. With these data and results, we study the influences of key algorithmic factors under different data scenarios, and compare two methods.
Two major stages of the alignment-based method determine the accuracy gain: short read alignment and consensus inference (Fig. 1a). Denote C as the number of short reads generated at a certain base in sequencing process, which is referred as the real short reads. At the first stage, the C real short reads are aligned to the long reads. Let N be the number of successfully aligned real short reads. Next, per the base of interest, the consensus of the aligned real short reads is generated as the corrected base. We define accuracy gain as γ − (1 − EA), where γ is the original long read error rate and EA is the expected accuracy after error correction:
总的来说,我们首先通过数学建模来评估在每个错误率水平下基于比对和基于图的方法所获得的精度,然后用模拟数据和真实数据验证模型的适用性。
利用这些数据和结果,我们研究了不同数据场景下关键算法因素的影响,并比较了两种方法。
基于比对的方法决定精度增益的两个主要阶段:短读比对和共识推断(图1a)。
表示C为测序过程中在一定碱基上产生的短读数,称为真实短读。
在第一阶段,C实际短读与长读对齐。
设N为成功对齐的实际短读的数量。
接下来,根据感兴趣的基值,生成对齐的实际短读的一致性作为修正的基值。
我们将精度增益定义为:out -(1−EA),其中,fae为原始长读错误率,EA为纠错后的期望精度:
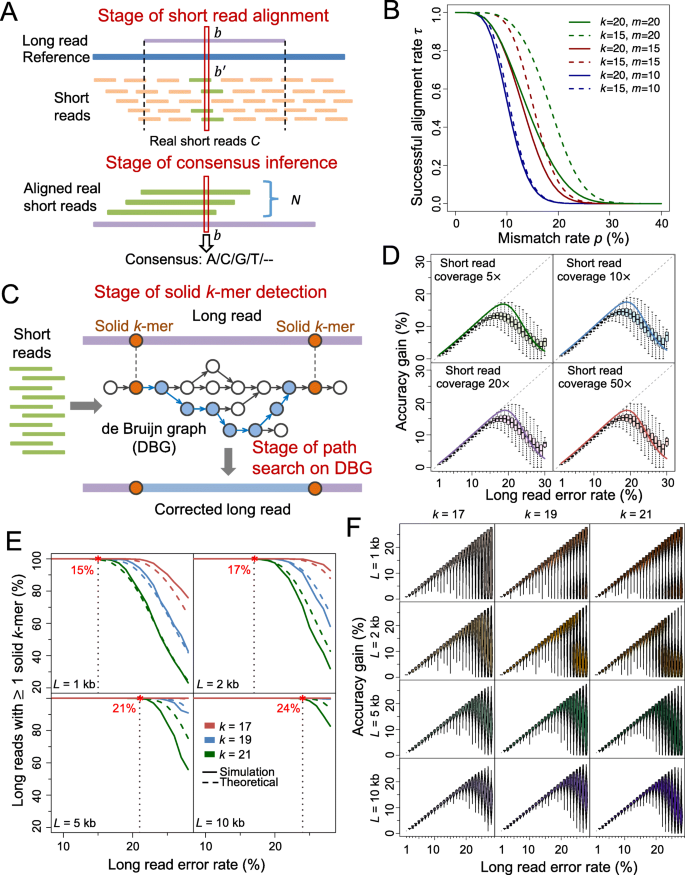
Illustration of alignment-based and graph-based method; results for model fitness and accuracy gain on simulated data.
a Schematic of alignment-based method. b is a certain base on the long read, and b′ is the corresponding base on the reference sequence. The C real short reads are aligned to the long read (with N of them being successfully aligned), and then the consensus is inferred at each base.
b Relationship of the successful alignment probability for short reads τ with the mismatch rate p, lower threshold on perfect match k-mer size k and the upper threshold of mismatches m. In spite of the changes of k or/and m, τ is near to one when p < 5%, and is near to zero when p > 30%. This indicates that mismatch rate is the most dominant factor on τ. As m increases from 10 to 20, the curves move upper (from blue to red and green), implying that τ increases with m. Moreover, the divergence between the dashed and solid blue, red, and green lines also shows an increasing tendency, which means the effect of k on τ also increases with m.
c Schematic of graph-based error correction method. DBG is built based on short reads. Solid k-mers are detected on the long reads. The fragment between two adjacent solid k-mers is then aligned with the correlated path on the DBG. The path is used to correct the fragment when certain criteria are satisfied.
d Accuracy gain at each error rate for simulated long reads corrected by alignment-based method. The boxplots represent the accuracy gain distribution for long reads. The solid lines represent the theoretical values. The dashed gray lines (diagonal lines) correspond to perfect correction.
e Proportion of simulated long reads with solid k-mer detected at each error rate level. The solid lines represent the theoretical values. The dashed lines represent the results on simulated long reads.
f Accuracy gain at each error rate for simulated long reads corrected by graph-based method.
基于对齐和基于图的方法说明;
在模拟数据上的模型适合度和精度增益的结果。
基于对齐方法的原理图。
b是长读的某个基,b是引用序列的相应基。C个真正的短读与长读对齐(其中N个成功对齐),然后在每个基数上推断出共识。
b短读τ匹配成功概率与失配率p、完美匹配k-mer大小k的下阈值和失配k的上阈值m的关系。5%,当p >时接近于零;30%。这说明错配率是τ上最主要的因子。从10到20 m增加,曲线上移动(从蓝色到红色和绿色),这意味着τ增加m。此外,虚线之间的分歧和固体蓝色、红色和绿色线也显示了一个增加的趋势,这意味着k的影响与mτ也增加。
c基于图的误差修正方法原理图。DBG是基于短读构建的。固体k-mers检测在长读取。然后将两个相邻的固体k-mers之间的碎片与DBG上的相关路径对齐。该路径用于在满足某些条件时纠正片段。
d通过基于对齐的方法校正的模拟长读在每个错误率下的精度增益。箱形图表示长时间读取的精度增益分布。实线表示理论值。灰线虚线(对角线)对应完全校正。
e在每个错误率级别上检测到的带有固体k-mer的模拟长读的比例。实线表示理论值。虚线表示模拟长读的结果。
f通过基于图的方法校正的模拟长读在每个错误率下的精度增益。
L: long read length;
k: size of perfectly matched seed or solid k-mer
Pr(N = n) represents the probability that n real short read can be successfully aligned, corresponding to the stage of short read alignment, and g(n, β) is the probability that the consensus equals to the true base, corresponding to the stage of consensus inference. β is the short read error rate. At first we calculate Pr(N = n) via obtaining the probability of successfully aligning a single short read to long read, which highly depends on the tolerance of mismatches and the length of perfectly matched seed required by an aligner. For two sequences X and Y with equal length l, denote M as the number of mismatched bases, and K as the length of the largest perfectly matched seed. Let k be a lower threshold of K, and m be an upper threshold of M and thus the couple of conditions K ≥ k and M ≤ m sets up a criterion of alignment. The following theorem measures the probability τ that a single short read can be successfully aligned under the criterion.
Theorem 1. Let X and Y be two sequences with equal length l. Denote Xi and Yi (1 ≤ i ≤ l) as the ith bases of X and Y, respectively. Suppose all the events {Xi = Yi} are independent, and all the bases have a common mismatch rate p. Let τ(k, m, p, l) ≜ Pr(K ≥ k, M ≤ m), 0 ≤ m ≤ l, where τ is namely the probability that a short read can be successfully aligned to a target place on the long read by an aligner requiring a perfectly matched seed not shorter than k and the number of mismatched bases not more than m. We have:
where Q(n) = max {s| l − ks ≥ n} ⋀ (n + 1). τ increases with m and l, and decreases with k and p.
The proof is provided in Additional file 1: Note 1. Based on τ, we are able to calculate the alignment rate of N short reads Pr(N = n). Given a set of errors in a long read, alignments of short reads are not completely independent, so we consider short reads in several batches (Additional file 1: Note 2, Figure S1). The mismatch rate p can roughly be estimated by β + γ (Additional file 1: Note 3). The analytical results indicate that the mismatch rate (i.e., approximately the long read error rate, because β ≪ γ), is the most dominant factor on τ; as m increases, both τ and the effect of k on τ increase (Fig. 1b, Additional file 1: Note 4). The accuracy of consensus inference g(n, β) can be deducted based on binomial distribution (Methods, Additional file 1: Note 5). The theoretical calculation shows that shallow aligned short read coverage is enough to generate high-accuracy consensus (e.g., only 9× aligned short reads can achieve consensus with accuracy >99.99%), so short read alignment is the dominant stage that impacts accuracy gain (Additional file 1: Figure S2).
Two stages in the graph-based method, including detection of solid k-mer and path search in DBG, influence the accuracy gain (Fig. 1c). At the first stage, all k-mers on the long read are scanned to find the “solid k-mers” that exist in the DBG generated by short reads. At the second stage, all paths that link two adjacent solid k-mers or link a solid k-mer with the end of long read on the DBG are searched to find the optimal one to correct the long read. Let φ(k, γ, L) be the probability that the long read (with length L) contains at least one solid k-mer. According to Theorem 1, we have:
(see Methods, Additional file 1: Note 6, Figure S3 for details). To investigate the second stage, we examine the distance between adjacent solid regions, since it represents the overall difficulty of path search in DBG. We model the solid region distance by a truncated geometric distribution compounded with a geometric distribution, and its expectation increases with k-mer size k and long read error rate γ (see Methods for details).
Pr(N = N)为N个真实短读成功对齐的概率,对应于短读对齐阶段;g(N, β)为共识等于真实基的概率,对应于共识推理阶段。β为短读错误率。首先,我们通过获得单个短读对长读的成功对齐概率来计算Pr(N = N),这在很大程度上取决于对齐器所需要的错配容忍度和完美匹配种子的长度。对于长度为l的两个序列X和Y, M表示错配碱基的数目,K表示最大完全匹配的种子的长度。设k为k的下阈值,m为m的上阈值,则k k和m m这对条件建立了对齐准则。以下定理测量了单个短读在准则下成功对齐的概率τ。定理1。设X和Y是两个长度为l的序列,分别表示Xi和Yi (1 i l)为X和Y的第i个基底。设所有事件{Xi = Yi}都是独立的,所有碱基都有一个共同的错配率p。设τ(k, m, p, l) Pr(k k, mm), 0 m l,其中,τ即短读成功对齐到长读目标位置的概率,该概率由要求不小于k且不大于m的完全匹配种子的对准器实现。我们有:τ(k,m,p,l)= n=0m[t=1Q(n)(1) t1 (n+1t)(l ktn)]pn(1 p)l n,其中Q(n) = max {s| l ks n} (n+1). τ随m和l增加而增大,随k和p减小。基于τ,我们可以计算出N个短读的对齐率Pr(N = N)。给定长读的一组错误,短读的对齐不是完全独立的,因此我们考虑短读分几批进行处理(Additional file 1: Note 2, Figure S1)。错配率p可以由β + γ粗略估计(附加文件1:注3)。分析结果表明,错配率(即近似长读错误率,因为β γ)是τ上最主要的影响因素;随着m的增大,τ和k对τ的影响均增大(图1b,附加文件1:注4)。根据二项分布可以推导一致推断的精度g(n, β)(方法,附加文件1:注5).理论计算表明,浅对齐的短读覆盖率足以产生高精度的一致性(例如,只有9个对齐的短读能够达到精度>99.99%的一致性),因此短读对齐是影响精度增益的主导阶段(Additional file 1: Figure S2)。基于图的方法的两个阶段,包括固体k-mer的检测和DBG中的路径搜索,影响精度增益(图1c)。在第一阶段,对长读的所有k-mers进行扫描,找出短读生成的DBG中存在的固体k-mers。在第二阶段,搜索DBG上连接两个相邻的solid k-mer或连接一个solid k-mer的长读结束的所有路径,找到最优路径来纠正长读。设φ(k, γ, L)为长读(L)中包含至少一个固体k-mer的概率。根据定理1得到:φ(k,γ,L)=τ(k,L,γ)= n=0L k[t=1Q(n)(1) t1 (n+1t)(L ktn)]γn(1 γ) = n=0L k[t=1Q(n)(1) t1 (n+1t)(L ktn)]γn(1 γ)L n(具体见方法,附加文件1:注6,图S3)。为了研究第二阶段,我们考察了相邻固体区域之间的距离,因为它代表了DBG中路径搜索的总体难度。我们用截断的几何分布和几何分布结合来模拟固体区域距离,它的期望随着k-mer大小k和长读错误率γ的增加而增加(详见方法)。
Next, we examine the model fitness and accuracy gains of both methods on simulated data. The long reads and short reads are simulated from the E. coli reference genome (strain K-12 MG1655) (Additional file 1: Note 7) [31, 32]. The alignment-based software proovread [19] is applied to correct the long reads (Additional file 1: Note 8, Figure S4). The tendencies of the theoretical accuracy gains fit the actual accuracy gains on the simulated data under different short read coverages (Fig. 1d). When γ ≤ 15%, even if very shallow short read coverage is used (5×), the accuracy gain increases along the diagonal line, which implies nearly perfect correction. When γ ≥ 18%, the accuracy gain decreases and the corresponding variance increases, and thus very few reads can be perfectly corrected. These results show the upper limit of long read error rate that the alignment-based method can perfectly solve, and the similar results are demonstrated in the graph-based method (as shown below). Moreover, both theoretical calculation and simulated data reveal that the accuracy gain can rarely exceed 20%, although there is slight increment (e.g., <2% and <1%) with respect to short read coverage (e.g., from 5× to 10× and from 20× to 50×, respectively, Fig. 1d). Therefore, the hybrid error correction benefit marginally from increase of short read coverage, especially when it is greater than 10×.
To evaluate the model of graph-based method, we apply LoRDEC (version 0.5.3) [23] to correct the simulated long reads (Additional file 1: Note 9). The short read coverage is 10× in this evaluation. The overall tendencies of the theoretical solid k-mer detection rate φ with respect to the length of long read L and the required k-mer size k align well with the values generated from the simulated data (Fig. 1e), though φ is slightly higher when L is over 2 kb. Overall, the solid k-mer detection rate is close to 1 when long read error rate γ is below certain threshold (such as 15% for k = 21 and L = 1 kb), and it decreases dramatically as γ increases beyond the threshold. This threshold increase with L (e.g., from 15% to 24% for 1 to 10 kb given k = 21) (Fig. 1e). In addition, the increase of k-mer size has an overall negative effect on solid k-mer detection, which is more remarkable when long reads are shorter (Fig. 1e). Of note, high long read error rate results in high probability that no solid k-mer can be detected so that the long read cannot be corrected. Following solid k-mer detection, we investigate the distances between adjacent solid regions: for all k-mer sizes in the test, the theoretical distances are consistent with the actual values obtained in the simulated data at different levels of long read error rates (Additional file 1: Figure S5). Given a k-mer size, both the mean and variance of the distances increase remarkably when long read error rate is ≥18% while it rarely exceeds 500 bp otherwise (Additional file 1: Figure S5). In addition, the increase of k also leads to a substantial increment on the distance.
接下来,我们在模拟数据上检验两种方法的模型适合度和精度增益。长reads和短reads取自大肠杆菌参考基因组(菌株K-12 MG1655)(附加文件1:注7)[31,32]。应用基于对齐的软件proofread[19]来纠正长读(附加文件1:注8,图S4)。理论精度增益的趋势与模拟数据在不同短读覆盖下的实际精度增益相吻合(图1d)。当γ 15%时,即使使用非常浅的短读覆盖(5),精度增益沿对角线增加,这意味着几乎完美的校正。当γ为18%时,精度增益减小,相应的方差增大,因此很少有读取能被完美校正。这些结果表明基于对齐的方法可以很好地解决长读错误率的上限,基于图的方法也得到了类似的结果(如下图所示)。此外,理论计算和模拟数据表明,尽管与短读覆盖(例如,从5到10,从20到50,图1d)相比有轻微的增加(例如,2%和1%),精度增益很少能超过20%。因此,混合错误修正从短读覆盖率的增加中获益甚微,特别是当它大于10时。
为了评估基于图的方法的模型,我们使用LoRDEC(版本0.5.3)[23]来纠正模拟的长读(附加文件1:注9)。在这次评估中,短读覆盖率为10。理论固体k-mer检测率φ相对于长读长度L和所需k-mer尺寸k的总体趋势与模拟数据生成的值吻合良好(图1e),但当L大于2 kb时φ略高。总的来说,当长读错误率γ低于一定的阈值(如k = 21和L = 1 kb时为15%)时,固体k-mer检出率接近1,当γ超过阈值时,固体k-mer检出率急剧下降。这个阈值随着L的增加而增加(例如,给定k = 21,当1到10 kb时,从15%增加到24%)(图1e)。此外,k-mer大小的增加对固体k-mer检测有整体的负面影响,当长读取较短时,这种影响更显著(图1e)。值得注意的是,高长读错误率导致高概率没有固体k-mer可以检测到,因此长读不能被纠正。在固体k-mer检测之后,我们研究相邻固体区域之间的距离:对于测试中所有的k-mer尺寸,在不同长读错误率水平下,理论距离与模拟数据中获得的实际值一致(附加文件1:图S5)。给定k-mer大小,当长读错误率为18%时,距离的均值和方差都显著增加,而在其他情况下很少超过500 bp(附加文件1:图S5)。此外,k的增加也导致距离的大幅增加。
In term of accuracy gain, the simulated data show that long reads can be almost perfectly corrected by the graph-based method when the long read error rate γ ≤ 19%, and the accuracy gain decreases and the corresponding variance increases when γ > 19%. The corresponding change point of γ in the alignment-based method is ~ 15%. However, instead of a single peak of accuracy gain with respect to γ, there is a bimodal pattern with γ > 19% in some scenarios of the graph-based method (e.g., k ≥ 19 and L ≤ 2 kb): some long reads can be corrected almost perfectly while some others have zero or very low accuracy gain (Fig. 1f). The latter subset of long reads may likely contain no or only one solid k-mer, so no or very difficult correction is performed. When the length of long read L increases to ≥5 kb, the distribution of accuracy gain shrinks at every error rate level and the bimodal pattern fades. Because longer read length improves the probability of solid k-mer detection (see the abovementioned results and Fig. 1e), a larger proportion of long reads can be corrected even though not perfectly.
The bimodal pattern of accuracy gain is further investigated through a concrete scenario, in which k = 19, L = 1 kb, γ = 25%. The corrected reads are classified into two groups: “high-gain long reads” with accuracy gain >12.5%, and “low-gain long reads” otherwise. Much higher fraction of the low-gain long reads contains only one solid 19-mer than the high-gain long reads (89.04% vs. 54.58%, Fig. 2a), and overall, the former contain more solid 19-mers than the latter. Moreover, for long reads with single 19-mer, the locations of the 19-mers are different for two classes of long reads: at the middle of high-gain long reads, while near either end of low-gain long reads (Fig. 2b). When the solid k-mer occurs near an end of the long read, one fragment is particularly long so that the correction by path search in DBG becomes more difficult, resulting in lower accuracy gain. In the case that no solid 19-mer is detected, long reads are uncorrected and contribute to the modal with low accuracy again as well. As the read length increases, more reads contain multiple solid 19-mer (Fig. 2c) and the effect of fragments at the ends becomes marginal so that the bimodal pattern disappears.
在精度增益方面,模拟数据表明,当长读错误率γ 19%时,基于图的方法几乎可以很好地校正长读,当γ >时,精度增益减小,相应的方差增大;19%。基于准直法的γ变化点为~ 15%。然而,与γ相比,精度增益不是一个单峰,而是γ >的双峰模式;19%在基于图的方法的某些情况下(例如,k 19和L 2 kb):一些长读几乎可以被完美地校正,而另一些则有零或非常低的精度增益(图1f)。长读的后一个子集可能不包含或只有一个固体k-mer,因此不执行或非常困难的校正。当长读L的长度增加到5 kb时,精度增益的分布在每一个错误率级别上都缩小,双峰模式消失。由于较长的读取长度提高了固体k-mer检测的概率(见上述结果和图1e),较大比例的长读取可以被修正,即使不是完美的。
在k = 19, L = 1 kb, γ = 25%的具体情况下,进一步研究了精度增益的双峰模式。校正读数分为两组:高增益长读数(精度增益>12.5%)和低增益长读数(精度增益>)。相比高增益长读,低增益长读只包含一个固态19个字符的比例要高得多(89.04% vs. 54.58%,图2a),而且总体而言,前者包含的固态19个字符比后者更多。此外,对于单19码长读,两类长读的19码位置是不同的:在高增益长读的中间位置,而在低增益长读的两端位置(图2b)。当固体k-mer出现在长读的末尾附近时,一个片段特别长,因此DBG中的路径搜索校正变得更加困难,导致较低的精度增益。在没有检测到坚实的19-mer的情况下,长读取是不正确的,并导致模态的低准确性。随着读取长度的增加,更多的读取包含多个固体19-mer(图2c),而末端片段的影响变得边缘,从而双峰模式消失。
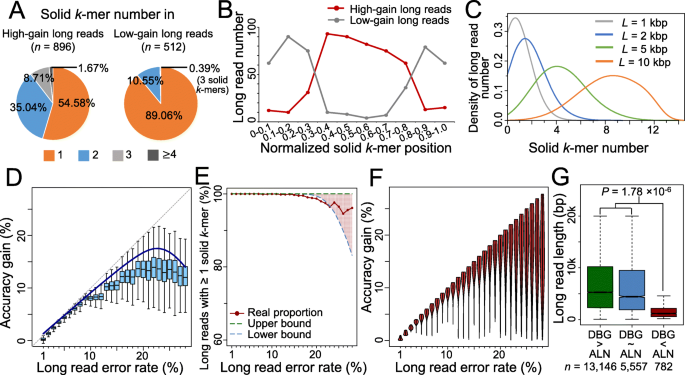
Explanation of bimodal accuracy gain for graph-based method; model fitness and accuracy gain on real dataset. a Proportion of long reads with different solid k-mer number. Without loss of generosity, the simulated long reads with length of 1 kb and error rate of 25% are taken as example. A long read is labeled as “high-gain long read” of the accuracy gain is larger than 12.5% (half of the value of error rate), and “low-gain long read” otherwise. b Distribution of the single solid k-mer locations on the high-gain and low-gain long reads. Only the long reads with one solid k-mer are considered. c Distribution of solid k-mer number on the long reads with different lengths. d Accuracy gain distribution at each error rate level for alignment-based method. e Proportion of long reads with solid k-mer detected. Due to the mixture of different long read lengths, an upper boundary and lower boundary is provided. f Accuracy gain distribution at each error rate level for graph-based method. g Length distribution of long reads on which graph-based method (labeled as DBG) has better, equal, or worse performance than the alignment-based method (labeled as ALN). The p value is calculated by Wilcoxon rank sum test
图论方法的双峰精度增益解释真实数据集上的模型适合度和精度增益。不同固体k-mer数的长读的比例。在不损失宽容度的情况下,以模拟长度为1 kb、错误率为25%的长读为例。长读标为精度增益大于12.5%(错误率值的一半)的高增益长读,反之为低增益长读。b高增益长读和低增益长读的单固体k-mer位置分布。只有长阅读与一个坚实的k-mer被考虑。c不同长度长读数上的固体k-mer数分布。d基于对齐方法在每个错误率水平上的精度增益分布。e检测到固体k-mer的长读数比例。由于不同长读长度的混合,提供了上界和下界。f基于图的方法在每个错误率水平上的精度增益分布。g基于图的方法(标记为DBG)比基于对齐的方法(标记为ALN)性能更好、相同或更差的长读的长度分布。采用Wilcoxon秩和检验计算p值
We further study the accuracy gains on a real PacBio dataset [23] corrected by proovread and LoRDEC, respectively (Additional file 1: Note 8–10, Figure S6, Figure S7). Short reads are randomly sampled with coverage 10×. The overall tendency of the real accuracy gain by proovread is in accordance with the theoretical calculation of the alignment-based method, though there is slight overestimation by the latter (Fig. 2d). On the real data, long reads can rarely obtain accuracy gain >20% (Fig. 2d). However, when the long read error rate increases from 25 to 30%, the accuracy gain maintains at a range of 10–15% rather than showing a sharp decrease as the theoretical modeling. When evaluating the accuracy gain by LoRDEC on the real data, it should be noticed that the real data contains long reads with different lengths, in contrast to the fixed read length in the abovementioned mathematical model of the graph-based method. Despite this difference, the proportion of the real long reads with solid k-mer detected is within the theoretical range (Fig. 2e), and the pattern of accuracy gain is very similar with the simulated results (Fig. 2f and Fig. 1f): most long reads achieve nearly perfect correction when the error rate is <20%, and the variance becomes larger for higher error rates.
Furthermore, two methods are compared based on the real dataset. The difference of accuracy gains between two methods becomes remarkable when the long read error rate >15%. Among 19,485 long reads with original error rates >15%, LoRDEC outperforms proovread on 13,146 (67.47%) reads, i.e., the difference of accuracy gains is >2% (boxplots in Fig. 2d vs. violin plots in Fig. 2f). Two methods show similar accuracy gains in 5,557 (28.52%) long reads, i.e., the difference of accuracy gains is ≤2%. proovread performs better for the remaining 782 (4.01%) reads. The third group of long reads is significantly shorter than the other two groups (p value of Wilcoxon rank sum test 1.78 × 10⁻⁶, Fig. 2g). It is consistent with the abovementioned inference: for the graph-based method, shorter reads are more likely to contain few or no solid k-mers, and the location of the solid k-mer highly affects the correction (Fig. 2a–c).
我们进一步研究了分别经过校对和LoRDEC校正的真实PacBio数据集[23]的精度增益(附加文件1:注8 10,图S6,图S7)。短阅读是随机抽样的覆盖范围10。校正后的实际精度增益总体趋势与基于对准方法的理论计算一致,但后者略有高估(图2d)。在实际数据上,长读很少能获得精度增益>20%(图2d)。然而,当长读错误率从25增加到30%时,精度增益保持在10 - 15%的范围内,而不是像理论模型那样出现急剧下降。在LoRDEC对真实数据进行精度增益评估时,需要注意的是真实数据包含不同长度的长读,而基于图的方法的上述数学模型中的读长度是固定的。尽管存在这种差异,但实际长读时检测到的固体k-mer所占比例在理论范围内(图2e),精度增益模式与模拟结果非常相似(图2f和图1f):当错误率为20%时,大多数长读都能达到近乎完美的校正,错误率越高,方差越大。
并基于实际数据集对两种方法进行了比较。当长读错误率为15%时,两种方法的精度增益差异显著。在19,485个原始误差率>15%的长读中,LoRDEC在13,146个(67.47%)读上优于校对,即精度增益差为>2%(图2d的箱线图与图2f的小提琴图)。两种方法在5557(28.52%)长读中显示出相似的精度增益,即精度增益差为2%。对于剩余的782个(4.01%)读取,proofread的性能更好。第三组长读明显短于其他两组(Wilcoxon秩和检验的p值1.78 10 6,图2g)。这与上述推论一致:对于基于图的方法,较短的reads更有可能包含很少或没有固体k-mer,固体k-mer的位置对校正的影响很大(图2a c)。
In summary, the theoretical calculation by mathematical frameworks together with both analyses of simulated and real data shows how key algorithmic factors and data parameters affect the accuracy gains by two main types of hybrid error correction algorithms. When the original long read error rate is below certain thresholds (e.g., 15%), both methods can correct most errors. For highly error-prone long reads (especially γ ≥ 20%), the graph-based method can obtain generally higher accuracy gain, while the variance is also larger. Among such highly error-prone long reads, the alignment-based method tends to have more advantage in correcting relatively shorter ones (e.g., median length 1,195 bp in our test, Fig. 2g). Although it is not possible to analyze all published software, the results generated by proovread and LoRDEC are representative for the alignment-based and graph-based methods, respectively, as shown by our previous benchmark work on 10 error correction software [27]. Of note, sequencing errors along real long reads may not be independent, or short read coverage may not be evenly distributed (e.g., transcriptome data), so specific adjustment is necessary in the analysis of real data (see Additional file 1: Note 10–11 for details). As both PacBio and ONT improve the technologies, the error rates of most raw data become <20%. At this range, our results fit the real data very well and thus will be beneficial for the analyses of the real data and provide a guidance for method selection, parameter design (Additional file 1: Note 12–13, Figure S8) and future method development. In addition, for modeling the alignment-based method, the mathematical theorem is established to measure the probability of short read alignment, which also lays the groundwork of development and analyses of the other alignment-based algorithms.
综上所述,利用数学框架进行理论计算,并结合仿真和实际数据进行分析,揭示了关键算法因素和数据参数对两种主要混合误差修正算法精度增益的影响。当原始长读错误率低于一定的阈值(如15%)时,两种方法都可以纠正大部分错误。对于容易出错的长读(尤其是γ 20%),基于图的方法一般能获得更高的精度增益,同时方差也较大。在这种高度容易出错的长读中,基于对齐的方法在纠正相对较短的读时更有优势(例如,我们的测试中中值长度为1195 bp,图2g)。虽然不可能分析所有发布的软件,但由校对和LoRDEC生成的结果分别代表了基于对齐和基于图的方法,如我们之前对10个错误修正软件[27]的基准工作所示。值得注意的是,真正长读的测序错误可能不是独立的,或者短读的覆盖范围可能不是均匀分布的(如转录组数据),因此在分析真实数据时需要进行特定的调整(详见附加文件1:注释10 11)。随着PacBio和ONT对技术的改进,大部分原始数据的错误率达到了20%。在此范围内,我们的结果与真实数据吻合良好,有利于对真实数据的分析,并为方法选择、参数设计和未来的方法开发提供指导(Additional file 1: Note 12 13, Figure S8)。此外,对基于对齐方法进行建模,建立了短读对齐概率的数学定理,为其他基于对齐算法的开发和分析奠定了基础。

posted on 2020-09-30 19:04 王闯wangchuang2017 阅读(278) 评论(0) 编辑 收藏 举报


【推荐】国内首个AI IDE,深度理解中文开发场景,立即下载体验Trae
【推荐】编程新体验,更懂你的AI,立即体验豆包MarsCode编程助手
【推荐】抖音旗下AI助手豆包,你的智能百科全书,全免费不限次数
【推荐】轻量又高性能的 SSH 工具 IShell:AI 加持,快人一步
· 开发者必知的日志记录最佳实践
· SQL Server 2025 AI相关能力初探
· Linux系列:如何用 C#调用 C方法造成内存泄露
· AI与.NET技术实操系列(二):开始使用ML.NET
· 记一次.NET内存居高不下排查解决与启示
· 阿里最新开源QwQ-32B,效果媲美deepseek-r1满血版,部署成本又又又降低了!
· 开源Multi-agent AI智能体框架aevatar.ai,欢迎大家贡献代码
· Manus重磅发布:全球首款通用AI代理技术深度解析与实战指南
· 被坑几百块钱后,我竟然真的恢复了删除的微信聊天记录!
· AI技术革命,工作效率10个最佳AI工具