【Python】办公自动化系列之Excel
一、excel软件配置
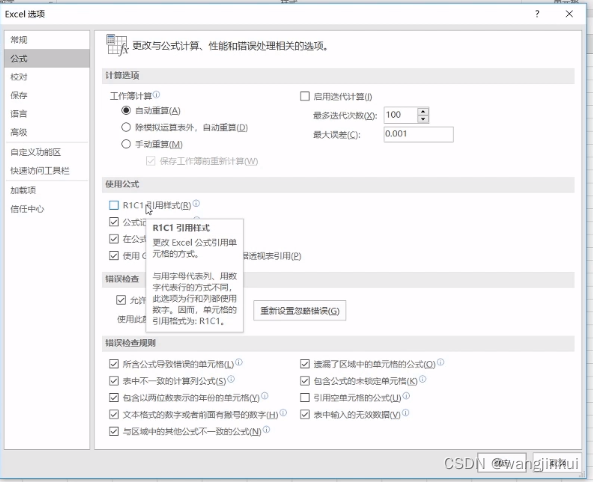
1.1 office
office的excel将列由字母变成数字的设置

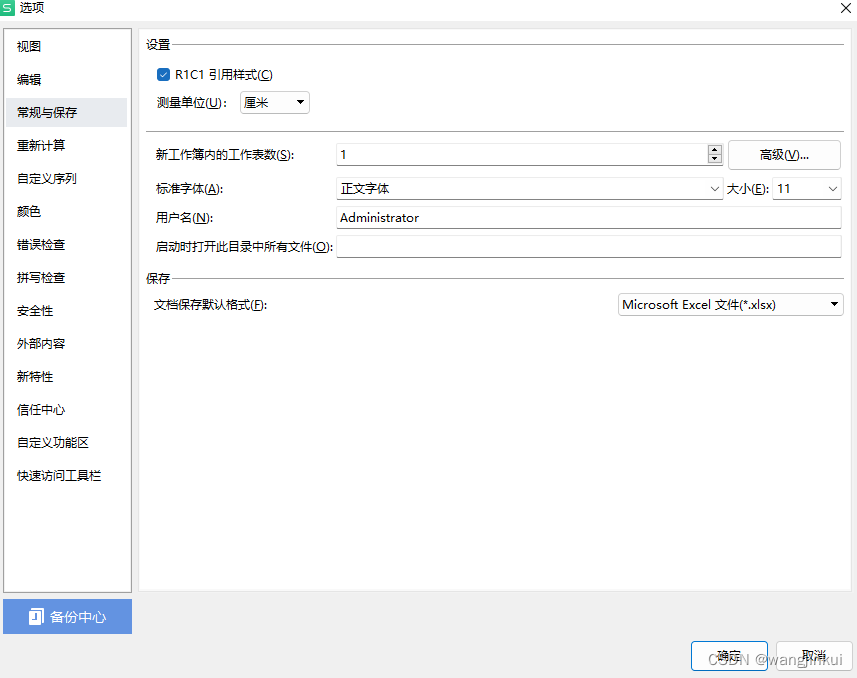
1.2 wps
wps的excel将列由字母变成数字的设置

二、依赖库集
Python-excel https://www.python-excel.org/
三、xlrd
3.1 依赖
workon office
pip install xlrd -i https://pypi.tuna.tsinghua.edu.cn/simple
# xlrd1.2.0之后的版本不支持xlsx格式,支持xls格式,尽量使用1.2老版本
pip uninstall xlrd
pip install xlrd==1.2.0 -i https://pypi.tuna.tsinghua.edu.cn/simple
3.2 实例
from django.http import HttpResponse
import xlrd


def index(request):
    get_sheet()
    return HttpResponse('ok')


def get_sheet():

    xlsx = xlrd.open_workbook("./20220221中文.xlsx")

    """
    获取工作表
    """
    sheets = xlsx.sheet_names()
    print(f"获取所有的sheet列表: {sheets}")
    sheet = xlsx.sheet_by_index(0)
    print(f"通过索引获取指定sheet对象: {sheet}")
    sheet = xlsx.sheet_by_name("Sheet1")
    print(f"通过名称获取指定sheet对象: {sheet}")

    """
    行操作
    """
    # 有效行数 67
    sheet.nrows
    # 指定行的有效列数 13
    sheet.row_len(7)
    # ['序号', '原岗位', '双选部门', '姓名', '性别', '联系电话', '劳动合同开始时间', ......
    sheet.row_values(1, start_colx=1, end_colx=None)
    # [text:'序号', text:'原岗位', text:'双选部门', text:'姓名', text:'性别', ......
    sheet.row(1)
    sheet.row_slice(1)
    # array('B', [1, 1, 1, 1, 1, 1, 1, 1, 1, 1, 1, 1, 1])
    sheet.row_types(1, start_colx=0, end_colx=None)

    """
    列操作
    """
    # 有效列数 13
    sheet.ncols
    # ['', '原岗位', '总编辑', '项目经理', '编辑', '记者', '编辑', ......
    sheet.col_values(1, start_rowx=0, end_rowx=None)
    # [empty:'', text:'原岗位', text:'总编辑', text:'项目经理', ......
    sheet.col(1, start_rowx=0, end_rowx=None)
    sheet.col_slice(1, start_rowx=0, end_rowx=None)
    # [0, 1, 1, 1, 1, 1, 1, 1, 1, 1, 1, 1, 1, 1, 1, 1, 1, 1, 1, 1, 1, ......
    sheet.col_types(1, start_rowx=0, end_rowx=None)

    """
    单元格操作
    """
    sheet.cell(1, 1).value
    sheet.cell_value(1, 1)
    # 返回单元格中的数据类型 1
    sheet.cell_type(1, 1)
四、xlwt
4.1 依赖
workon office
pip install xlwt -i https://pypi.tuna.tsinghua.edu.cn/simple
4.2 实例
from django.http import HttpResponse
import xlwt


def index(request):
    set_write()
    return HttpResponse('ok')


def set_write():

    # 创建一个workbook对象,就相当于创建了一个Excel文件
    # encoding:设置编码,可写中文;style_compression:是否压缩,不常用
    workbook = xlwt.Workbook(encoding='utf-8', style_compression=0)

    # 创建一个sheet对象,相当于创建一个sheet页
    # cell_overwrite_ok:是否可以覆盖单元格,默认为False
    worksheet = workbook.add_sheet('sheet1', cell_overwrite_ok=True)

    """
    样式
        字体设置
        背景颜色设置
        边框设置
        对齐方式设置
        单元格格式
        列宽和行高
        多列合并写入
    """
    style = xlwt.XFStyle()  # 初始化样式
    font = xlwt.Font()  # 为样式创建字体(font)

    # 指定字体的具体属性
    font.name = '宋'  # 指定字体
    font.height = 300  # 字体大小 15,和excel字体大小比例是 1:20
    font.bold = True  # 字体是否加粗
    font.underline = True  # 字体是否下划线
    font.struck_out = True  # 字体是否有横线
    font.italic = True  # 是否斜体字
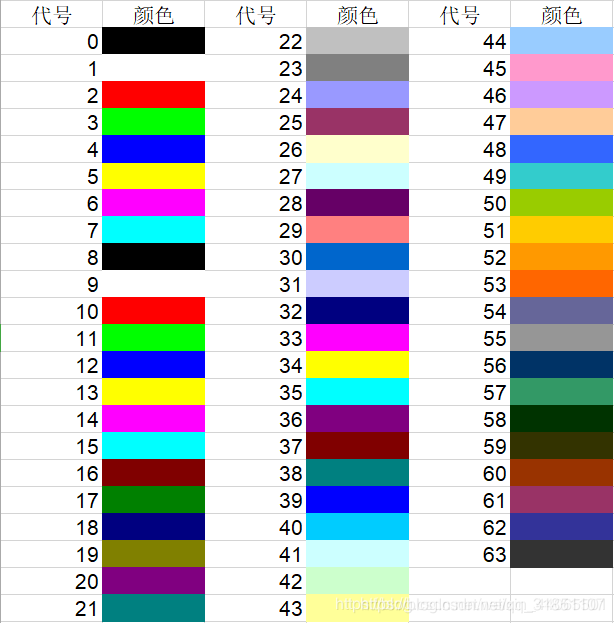
    font.colour_index = 4  # 字体颜色
    style.font = font

    # 为单元格设置背景色
    pattern = xlwt.Pattern()
    pattern.pattern = xlwt.Pattern.SOLID_PATTERN  # 设置背景颜色模式
    pattern.pattern_fore_colour = 3  # 不同的值代表不同颜色背景
    style.pattern = pattern

    # 设定边框属性
    borders = xlwt.Borders()
    borders.left = xlwt.Borders.THIN
    borders.right = xlwt.Borders.THIN
    borders.top = xlwt.Borders.THIN
    borders.bottom = xlwt.Borders.THIN
    style.borders = borders

    # 对齐方式
    alignment = xlwt.Alignment()
    # 设置具体的对齐方式 : vert代表垂直对齐方式;horz代表水平对齐方式
    alignment.vert = 0x01  # 0x00 上端对齐;0x01 居中对齐(垂直方向上);0x02 底端对齐
    alignment.horz = 0x03  # 0x01 左端对齐;0x02 居中对齐(水平方向上);0x03 右端对齐
    alignment.wrap = 1  # 自动换行
    style.alignment = alignment

    # 单元格格式(常规、日期、文本、自定义...)
    style.num_format_str = 'yyyy/MM/dd'

    # 设设置列宽
    worksheet.col(4).width = 256 * 20

    # 设置行高
    worksheet.row(5).height_mismatch = True
    worksheet.row(5).height = 256 * 20

    # 多行合并
    worksheet.write_merge(0, 3, 4, 7, '1-4行,5-8列 合并单元格')

    # 向sheet页中添加数据:worksheet.write(行,列,值)
    worksheet.write(0, 0, '无样式文本')
    worksheet.write(0, 1, '有样式文本有样式文本有样式文本', style)
    from datetime import datetime
    worksheet.write(2, 0, datetime.strptime('2022-04-12', '%Y-%m-%d').date(), style)

    # 将以上内容保存到指定的文件中
    workbook.save('./python_create中文.xls')
4.3 颜色对照

五、xlutils
5.1 依赖
workon office
pip install xlutils -i https://pypi.tuna.tsinghua.edu.cn/simple
5.2 实例
from django.http import HttpResponse
import xlwt
import xlrd
from xlutils.copy import copy


def index(request):
    utils_test()
    return HttpResponse('ok')


def utils_test():
    workbook = xlrd.open_workbook('./20220221中文.xlsx')
    new_workbook = copy(workbook)  # 将xlrd对象拷贝转化为xlwt对象
    new_workbook.save("./mcw_test.xlsx")  # 保存工作簿
六。 图表
workon office
pip install openpyxl -i https://pypi.tuna.tsinghua.edu.cn/simple
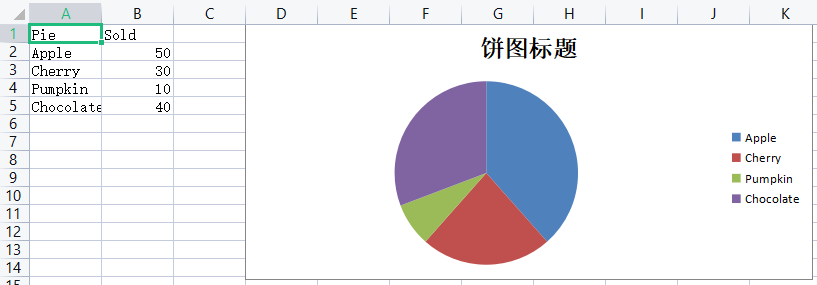
6.1 饼图
from django.http import HttpResponse
import openpyxl
from openpyxl.chart import PieChart, Reference, BarChart, BubbleChart, ScatterChart  # Reference:图标所用信息
from openpyxl.chart import Series


def index(request):
    set_char_bingtu()
    return HttpResponse('ok')


def set_char_bingtu():
    # 准备数据
    rows = [
        ['Pie', 'Sold'],
        ['Apple', 50],
        ['Cherry', 30],
        ['Pumpkin', 10],
        ['Chocolate', 40]
    ]

    # 创建excel和sheet
    wb = openpyxl.Workbook()
    ws = wb.active
    ws.title = '饼图Sheet'

    # 写入数据
    for row in rows:
        ws.append(row)

    # 初始化饼图
    pie_chart = PieChart()
    # 设置饼图标题
    pie_chart.title = '饼图标题'
    # 图表分类和数据选定
    data = Reference(ws, min_col=2, min_row=2, max_row=5)  # 第二列,数据,2-5行
    category = Reference(ws, min_col=1, min_row=2, max_row=5) # 第一列,分类标题,2-5行

    # 需要先添加数据再设置分类标题
    pie_chart.add_data(data)
    pie_chart.set_categories(category)

    # 在excel添加饼图
    ws.add_chart(pie_chart, 'D1')  # 在D1位置绘制饼图
    # 保存
    wb.save('char_excel_text.xlsx')

6.2 柱状图
from django.http import HttpResponse
import openpyxl
from openpyxl.chart import PieChart, Reference, BarChart, BubbleChart, ScatterChart  # Reference:图标所用信息
from openpyxl.chart import Series


def index(request):
    set_char_bar()
    return HttpResponse('ok')


def set_char_bar():
    wb = openpyxl.Workbook()
    ws = wb.create_sheet('柱状图Sheet')

    # 准备数据
    rows = [
        ('Number', 'Batch1', 'Batch2'),
        (2, 10, 30),
        (3, 40, 60),
        (4, 50, 70),
        (5, 20, 10),
        (6, 10, 40),
        (7, 50, 30),
    ]

    # 添加数据
    for row in rows:
        ws.append(row)

    # 绘制柱状图
    bar_chart = BarChart()
    bar_chart.type = 'col'  # col垂直、水平柱状图 bar
    bar_chart.title = '柱状图标题'
    bar_chart.style = 10  # 设置颜色,10的对比度最强,红色与蓝色
    # 设置横轴纵轴标题
    bar_chart.x_axis.title = 'Sample length(mm)'
    bar_chart.y_axis.title = 'Test number'

    # 设置分类
    category = Reference(ws, min_col=1, min_row=2, max_row=7)
    # 获取数据
    data = Reference(ws, min_col=2, max_col=3, min_row=1, max_row=7)

    # 柱状图对象添加数据
    bar_chart.add_data(data, titles_from_data=True)  # titles_from_data=True:根据来源设置数据标题
    # 设置分类
    bar_chart.set_categories(category)
    # 工作页绘制柱状图,并指定位置
    ws.add_chart(bar_chart, 'E1')

    # 保存
    wb.save('char_excel_text.xlsx')

6.3 线形图
from django.http import HttpResponse
import openpyxl
from openpyxl.chart import PieChart, Reference, BarChart, BubbleChart, ScatterChart  # Reference:图标所用信息
from openpyxl.chart import Series


def index(request):
    set_char_scatter()
    return HttpResponse('ok')


def set_char_scatter():
    # 绘制散点图
    wb = openpyxl.Workbook()
    ws = wb.create_sheet('线形图Chart')

    rows = [
        ['Size', 'Batch1', 'Batch2'],
        [2, 40, 25],
        [3, 40, 25],
        [4, 50, 30],
        [5, 30, 25],
        [6, 25, 35],
        [7, 20, 40],
    ]

    for row in rows:
        ws.append(row)

    # 绘制散点图
    scatter_chart = ScatterChart()
    # 设置标题
    scatter_chart.title = '线形图标题'
    # 设置颜色
    scatter_chart.style = 13

    # 设置x轴y轴标题
    scatter_chart.x_axis.title = 'Size'
    scatter_chart.y_axis.title = 'Percentage'

    # 创建x轴的数据来源
    xvalues = Reference(ws, min_col=1, min_row=2, max_row=7)
    # 创建yvalues
    for i in range(2, 4):
        yvalues = Reference(ws, min_col=i, min_row=1, max_row=7)
        series = Series(yvalues, xvalues=xvalues, title_from_data=True)
        scatter_chart.series.append(series)

    # 将散点图添加到ws工作表中
    ws.add_chart(scatter_chart, 'E1')

    # 保存工作簿
    wb.save('charts.xlsx')

作者:小魁jking
出处:https://www.cnblogs.com/wangjinkui/
版权:本文版权归作者和博客园共有
转载:欢迎转载,但未经作者同意,必须保留此段声明;必须在文章中给出原文连接;否则必究法律责任
出处:https://www.cnblogs.com/wangjinkui/
版权:本文版权归作者和博客园共有
转载:欢迎转载,但未经作者同意,必须保留此段声明;必须在文章中给出原文连接;否则必究法律责任


 excel常规操作
