通过influxdbv2 和 grafana 监控 geth
geth.service
[Unit]
  Description=mainnet chain
  StartLimitIntervalSec=500
  StartLimitBurst=5

[Service]
  Restart=on-failure
  RestartSec=5s
  ExecStart=/usr/local/geth/geth --mainnet  --http --http.addr "0.0.0.0"  --http.api eth,net,engine,admin --syncmode snap  --gcmode archive  --authrpc.addr localhost --authrpc.port 8551 --authrpc.vhosts localhost --authrpc.jwtsecret /data/prysm/jwt.hex --datadir /data/eth --allow-insecure-unlock --metrics --metrics.influxdb --metrics.influxdb.endpoint "http://localhost:8086" --metrics.influxdb.username "geth" --metrics.influxdb.password "password" --metrics.influxdb.tags host=geth-01
  Type=simple
  User=root
  KillSignal=SIGINT
  TimeoutStopSec=12000

[Install]
  WantedBy=multi-user.target
安装InfluxDB
influxdb.conf
[meta]
  dir = "/var/lib/influxdb/meta"

[data]
  dir = "/var/lib/influxdb/data"
  engine = "tsm1"
  wal-dir = "/var/lib/influxdb/wal"
docker-compose.yml
version: '3.9'

services:

  influxdb:
    image: "influxdb:1.8.10"
    container_name: influxdb
    restart: always
    environment:
    - TZ=Asia/Tokyo
    networks:
      - influxdb
    ports:
      - "8086:8086"
    volumes:
    - /data/apps/influxdb/data:/var/lib/influxdb
    - /data/apps/influxdb/config/influxdb.conf:/etc/influxdb/influxdb.conf

networks:
  influxdb:
    driver: bridge
创建用户
# curl -XPOST "http://localhost:8086/query" --data-urlencode "q=CREATE USER username WITH PASSWORD 'password' WITH ALL PRIVILEGES"
{"results":[{"statement_id":0}]}
登录influxdb shell
influx -username 'username' -password 'password'InfluxDB shell version: 1.8.10
> 创建db
InfluxDB shell version: 1.8.10
>
> create database geth查询数据
InfluxDB shell version: 1.8.10
>
> use geth
> show measurements
Grafana
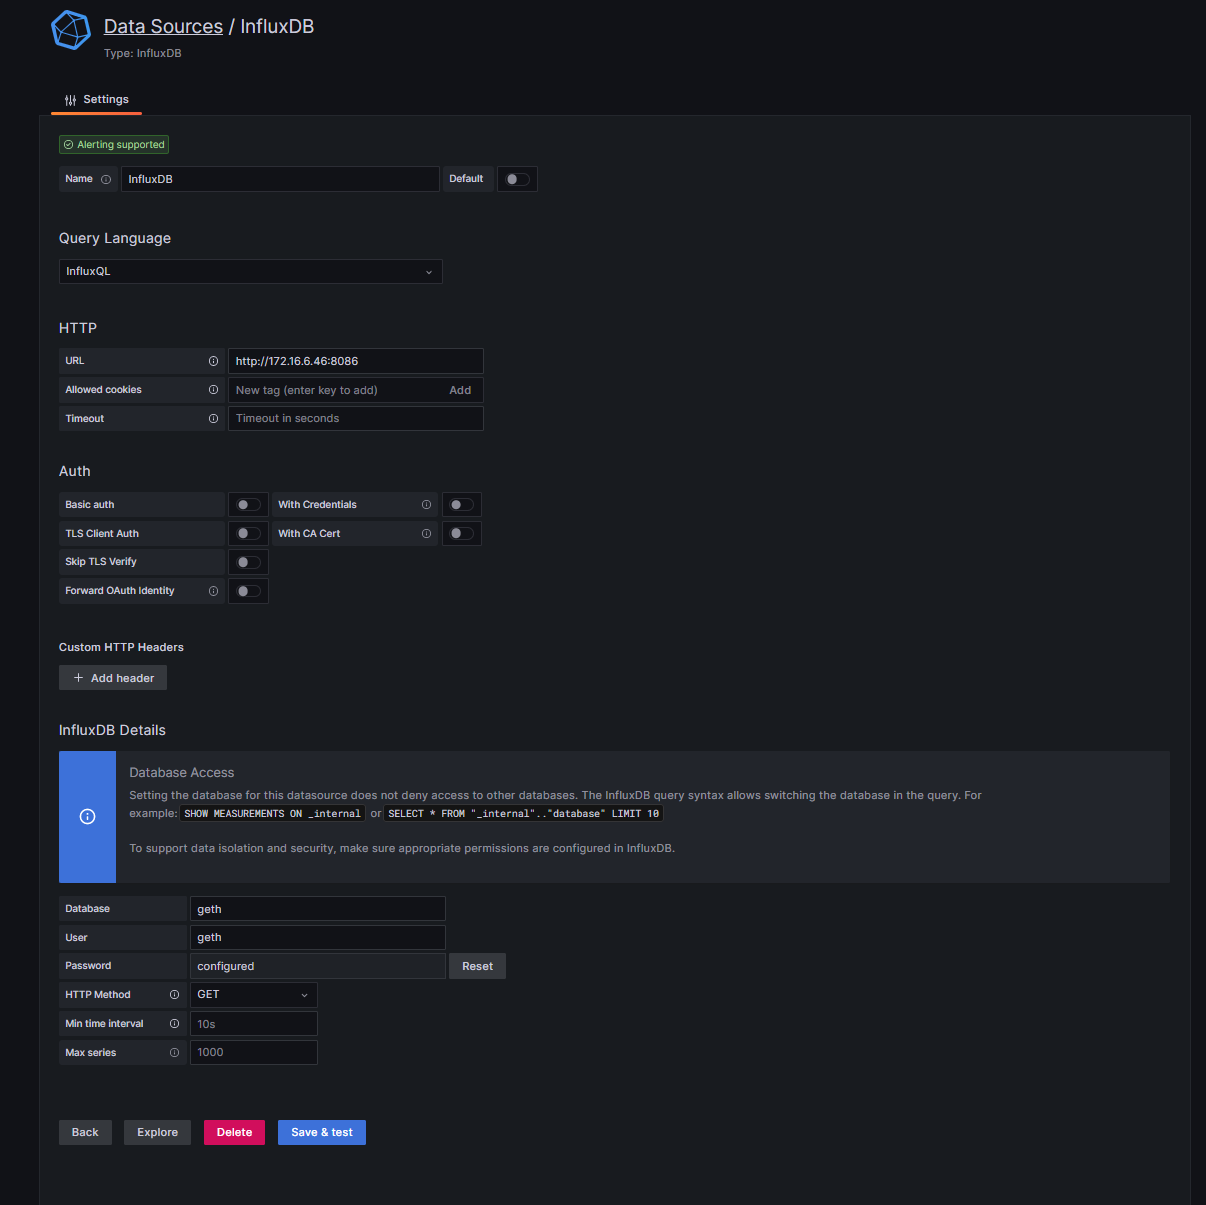
添加influxdb数据源
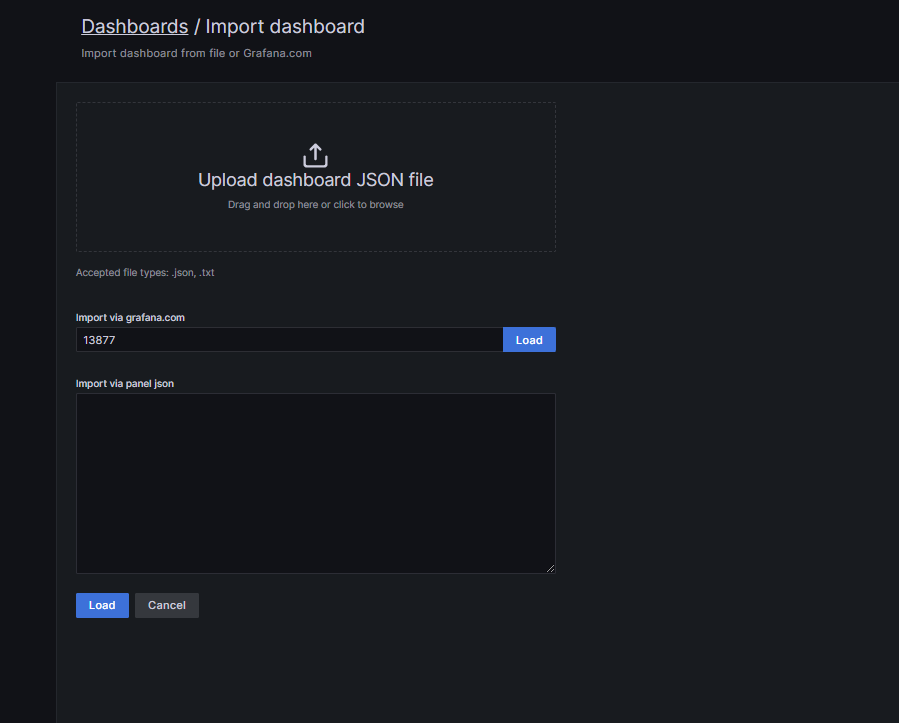
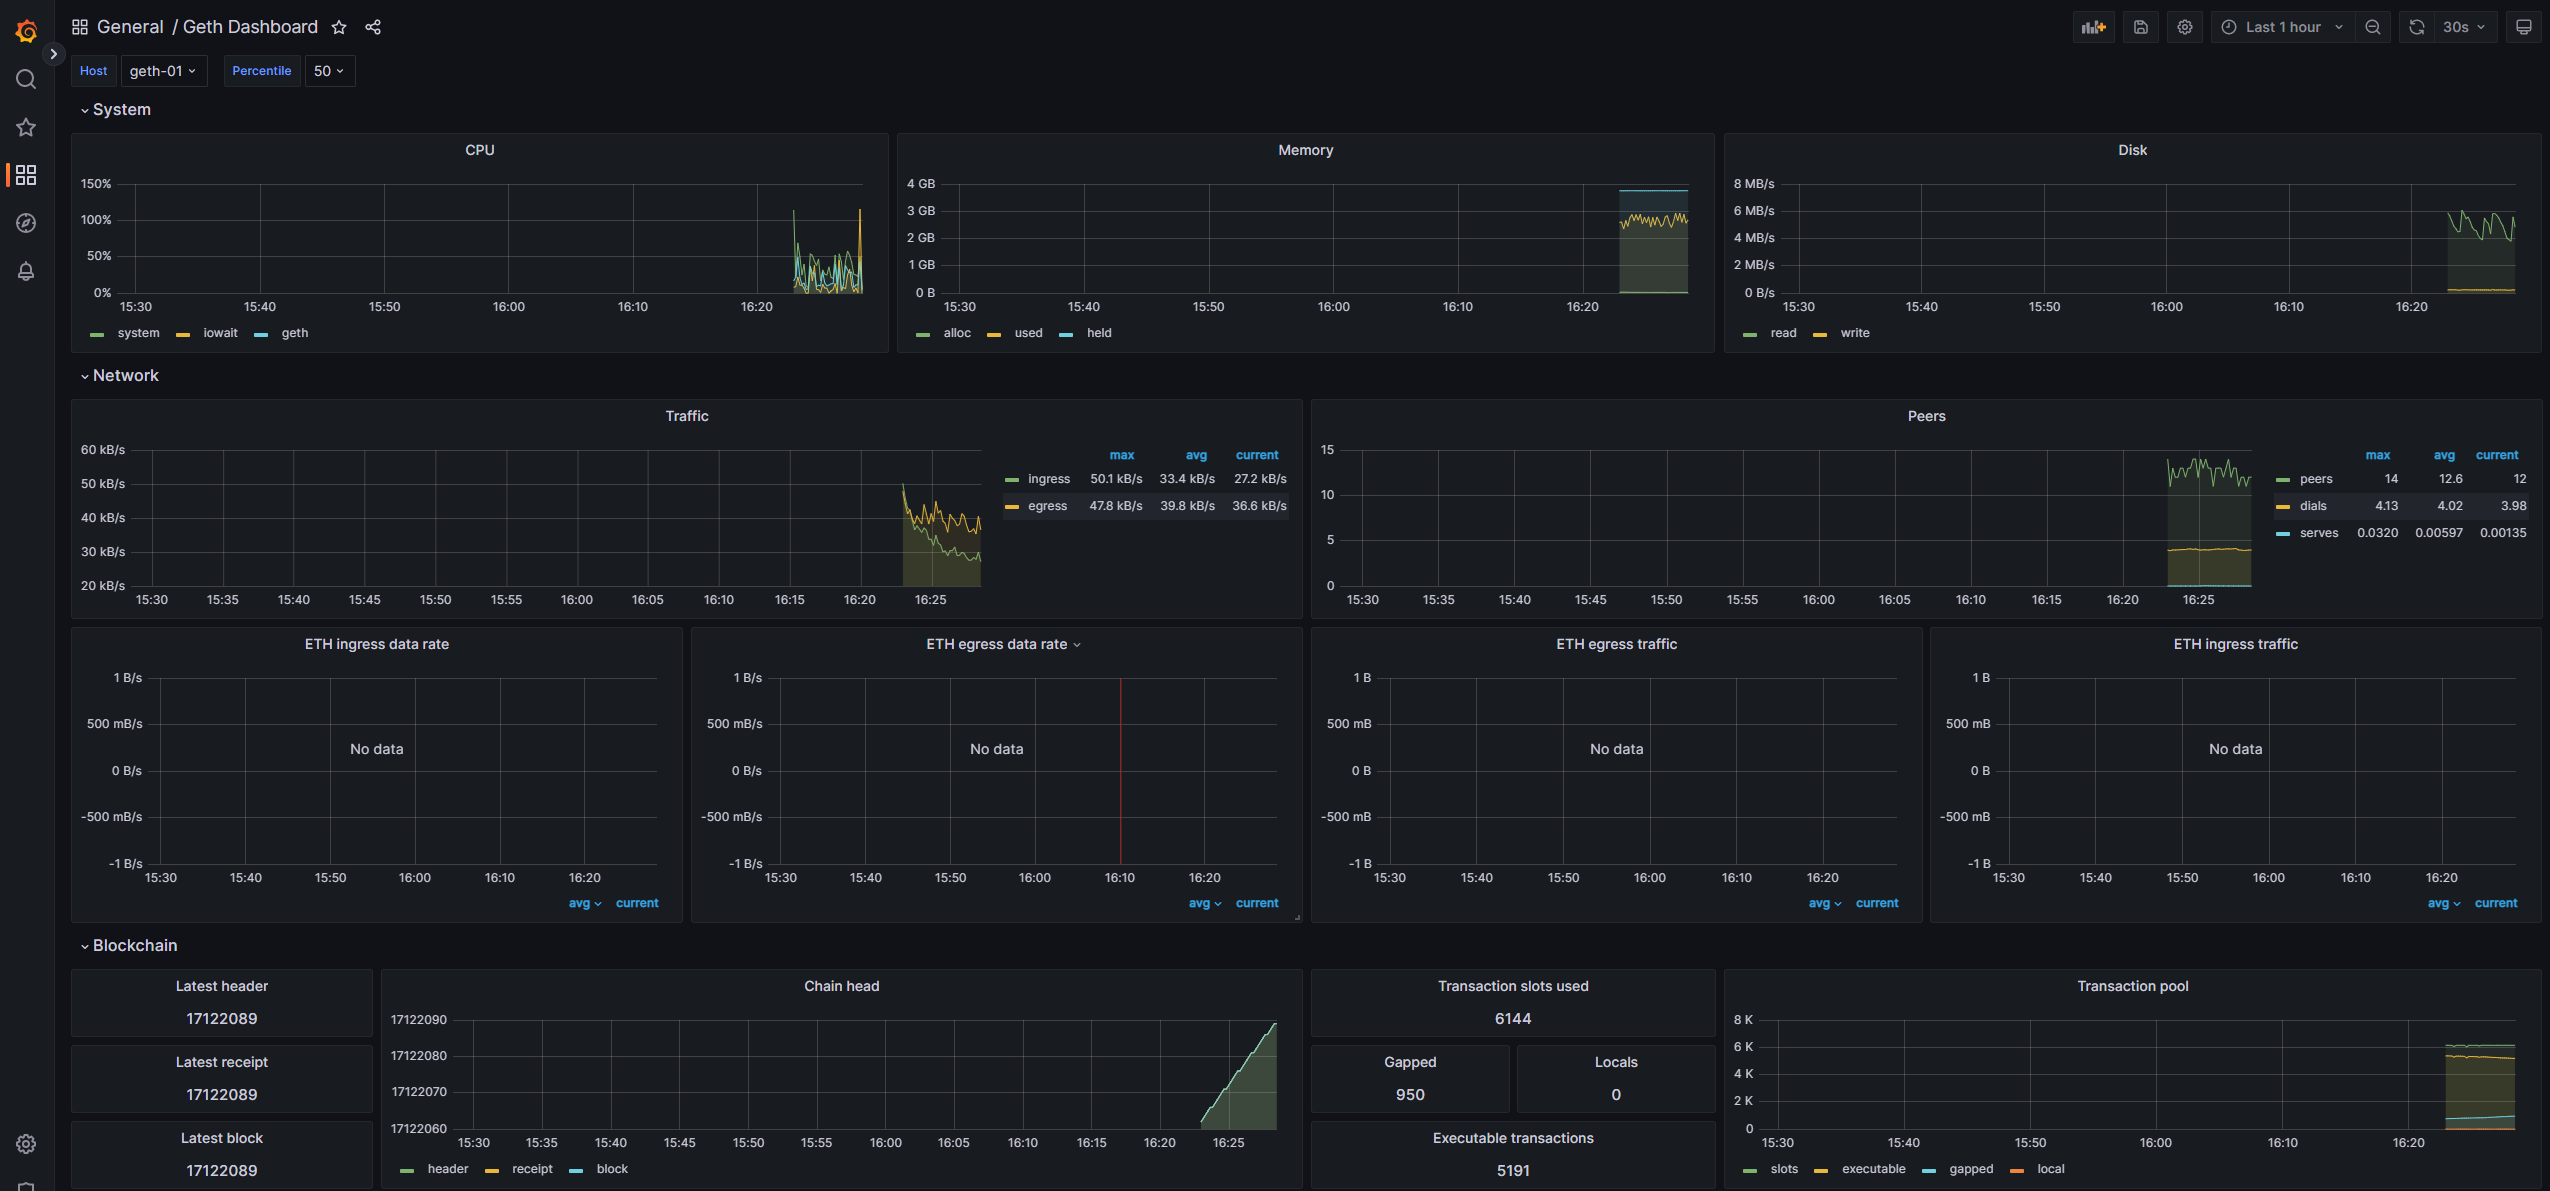
导入模板
ID: 13877
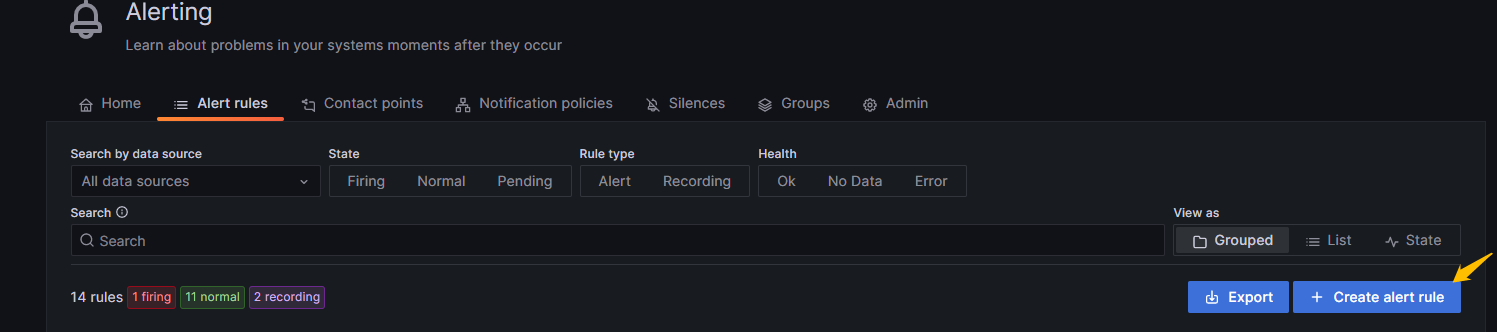
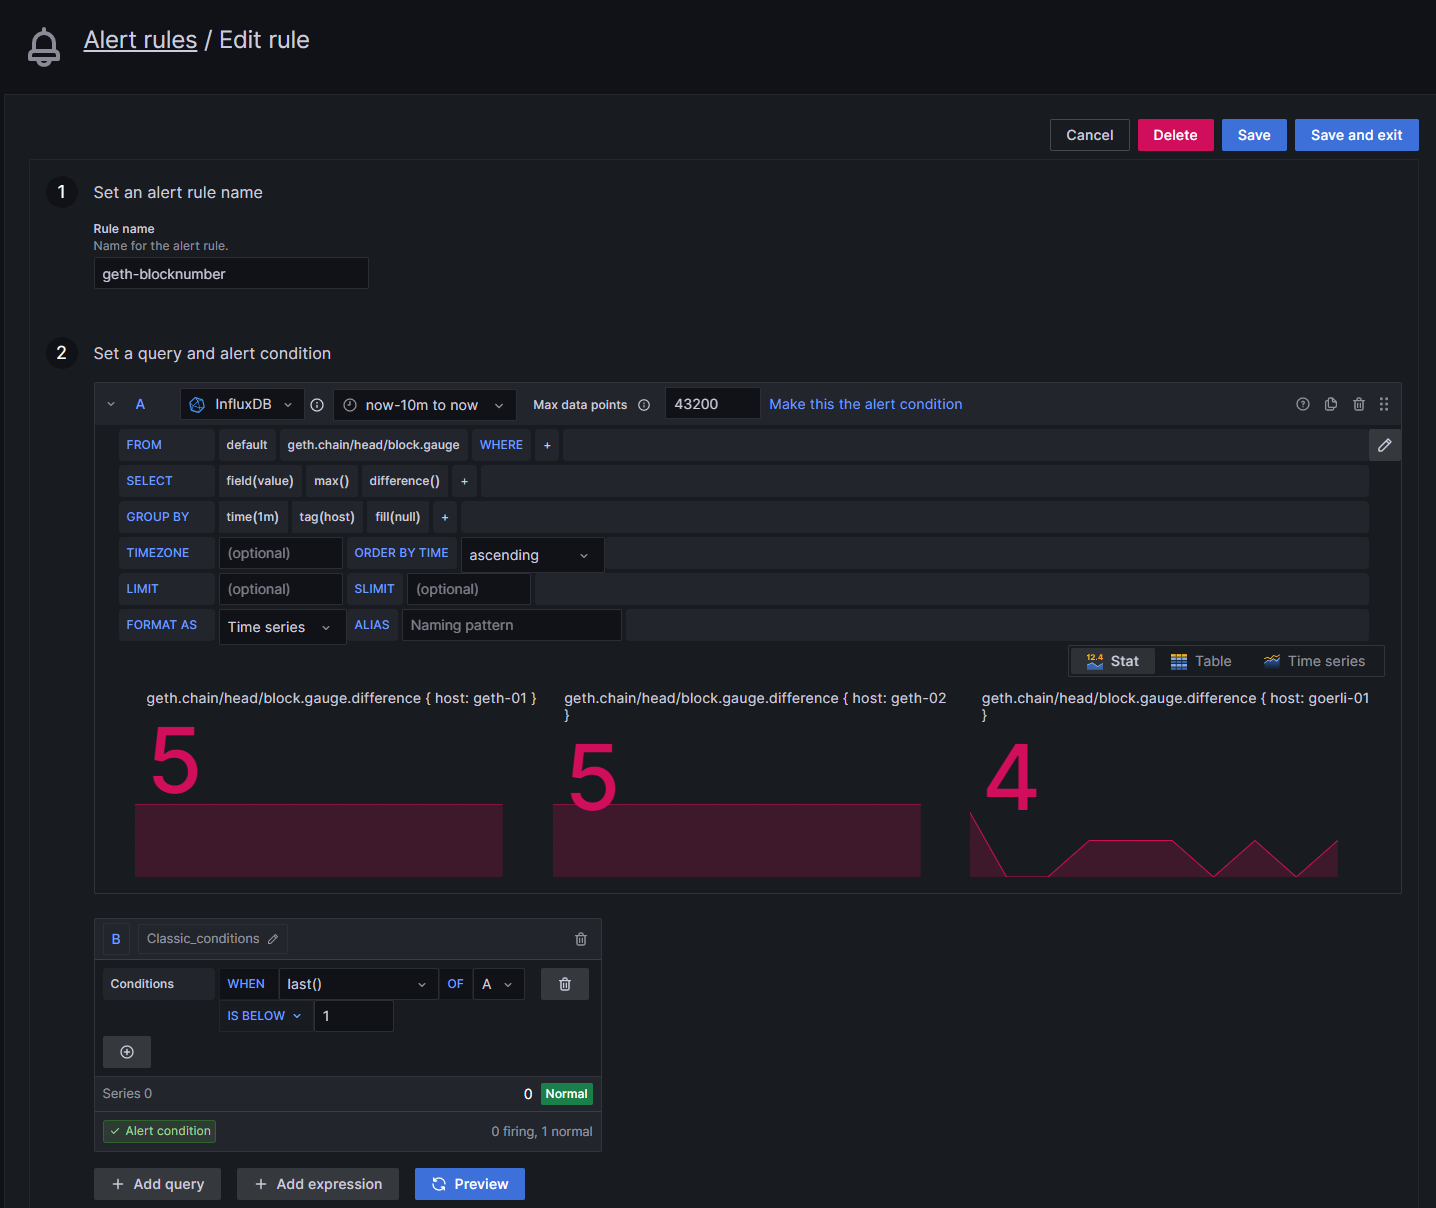
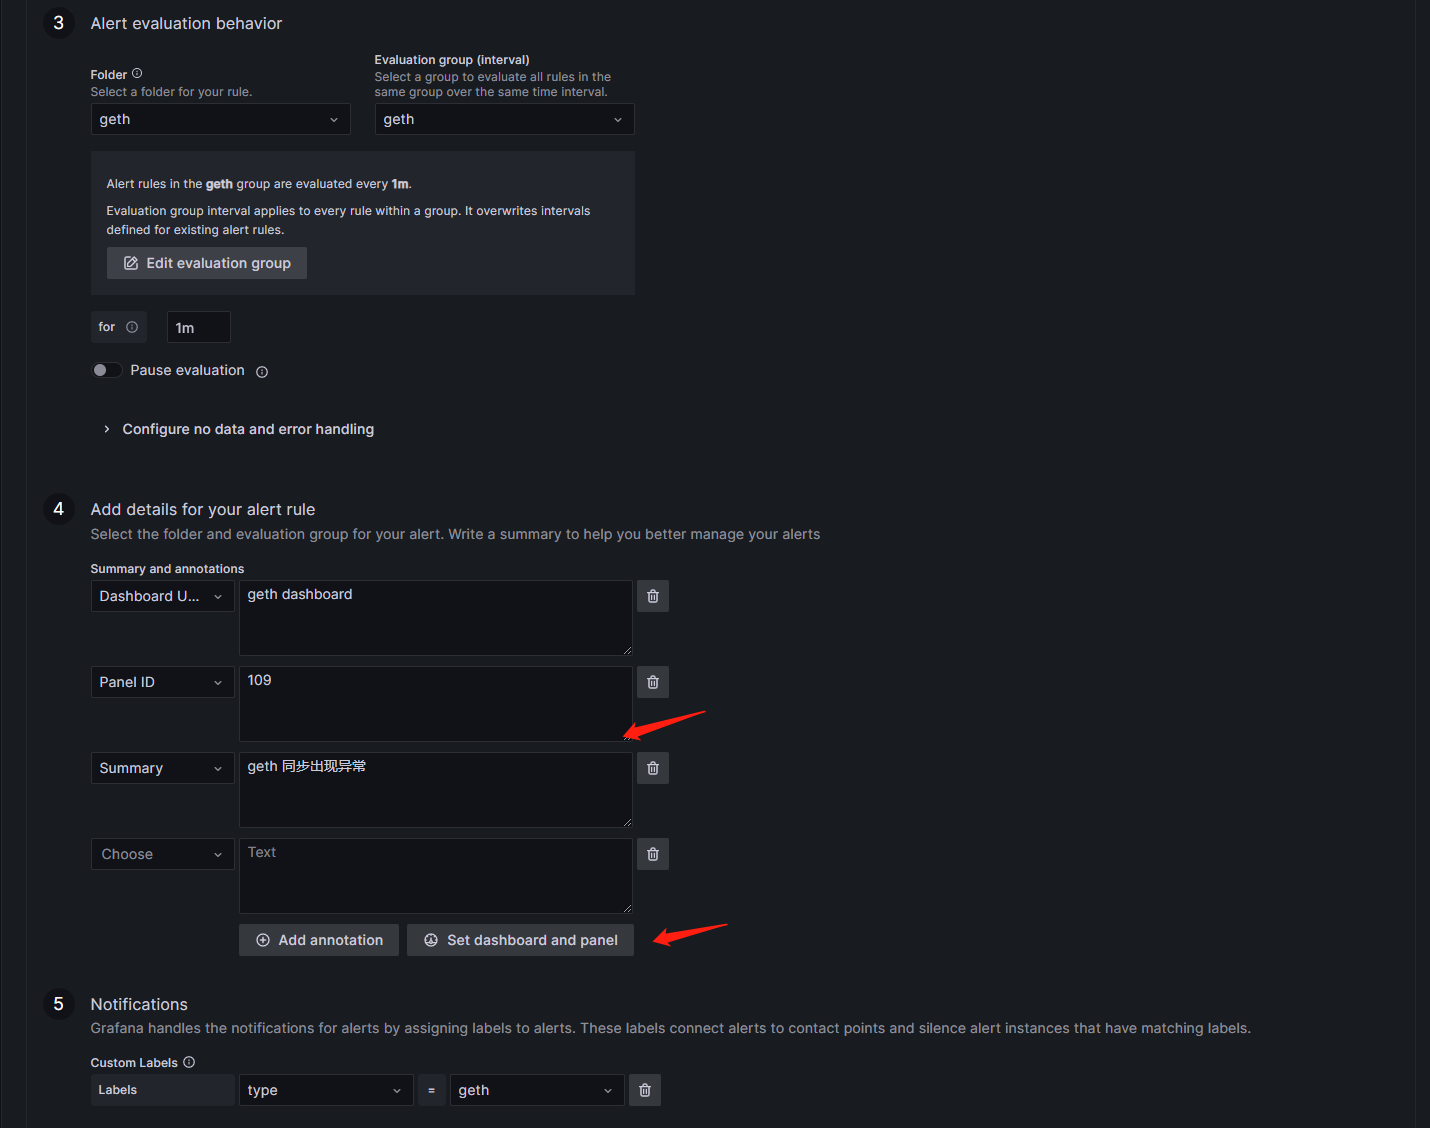
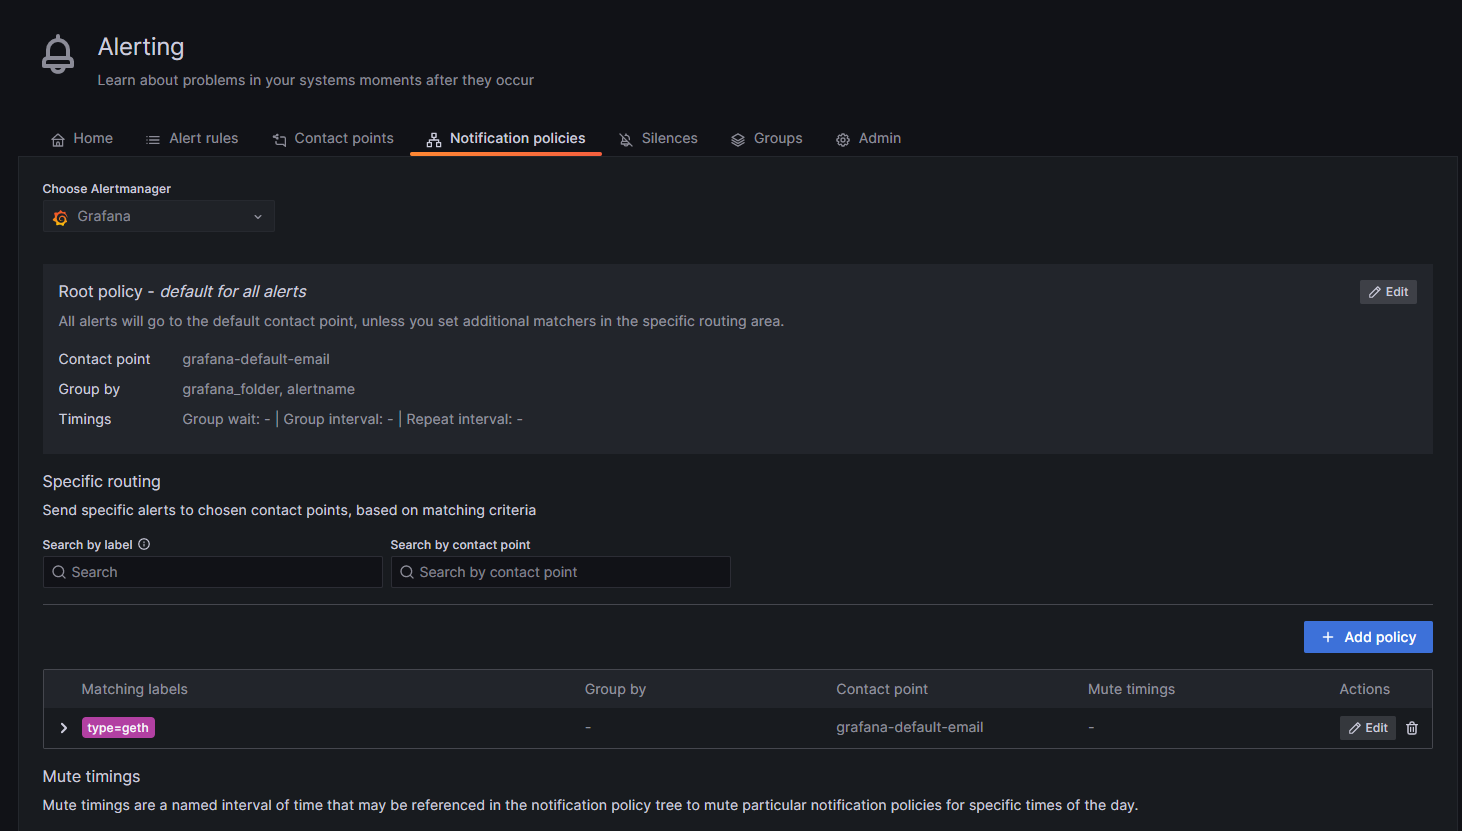
定义监控告警

METRICS 参数
    --metrics                      (default: false)
          Enable metrics collection and reporting

    --metrics.addr value           (default: "127.0.0.1")
          Enable stand-alone metrics HTTP server listening interface

    --metrics.expensive            (default: false)
          Enable expensive metrics collection and reporting

    --metrics.influxdb             (default: false)
          Enable metrics export/push to an external InfluxDB database

    --metrics.influxdb.bucket value (default: "geth")
          InfluxDB bucket name to push reported metrics to (v2 only)

    --metrics.influxdb.database value (default: "geth")
          InfluxDB database name to push reported metrics to

    --metrics.influxdb.endpoint value (default: "http://localhost:8086")
          InfluxDB API endpoint to report metrics to

    --metrics.influxdb.organization value (default: "geth")
          InfluxDB organization name (v2 only)

    --metrics.influxdb.password value (default: "test")
          Password to authorize access to the database

    --metrics.influxdb.tags value  (default: "host=localhost")
          Comma-separated InfluxDB tags (key/values) attached to all measurements

    --metrics.influxdb.token value (default: "test")
          Token to authorize access to the database (v2 only)

    --metrics.influxdb.username value (default: "test")
          Username to authorize access to the database

    --metrics.influxdbv2           (default: false)
          Enable metrics export/push to an external InfluxDB v2 database

    --metrics.port value           (default: 6060)
          Metrics HTTP server listening port
参考文档
https://geth.ethereum.org/docs/monitoring/dashboards
https://docs.influxdata.com/influxdb/v2.6/tools/grafana/

 浙公网安备 33010602011771号