Envoy Administrator interface基础
管理接口admin
https://www.envoyproxy.io/docs/envoy/latest/operations/operations
https://www.envoyproxy.io/docs/envoy/latest/operations/admin
管理接口介绍
Envoy内建了一个管理服务(administration server),它支持查询和修改操作,甚至有可能暴露私有数据(例如统计数据、集群名称和证书信息等),因此非常有必要精心编排其访问控制机制以避免非授权访问;
管理接口配置格式
admin:
  access_log: [] # 访问日志协议的相关配置,通常需要指定日志过滤器及日志配置等;
  access_log_path: ... # 管理接口的访问日志文件路径,无须记录访问日志时使用/dev/null;
  profile_path: ... # cpu profiler的输出路径,默认为/var/log/envoy/envoy.prof;
  address: # 监听的套接字;
    socket_address:
      protocol: ...
      address: ...
      port_value: ...
管理接口配置示例
admin:
  access_log_path: /tmp/admin_access.log
  address:
    socket_address: { address: 0.0.0.0, port_value: 9901 }
# 提示:此处 仅为出于方便测试的目的,才设定其监听于对外通信的任意IP地址;安全起见,应该使用127.0.0.1;
Envoy启用admin interface
环境说明
envoy:Front Proxy,地址为172.31.5.2
webserver01:第一个后端服务,地址为172.31.5.11
webserver02:第二个后端服务,地址为172.31.5.12
envoy配置文件
查看代码
admin:
  profile_path: /tmp/envoy.prof
  access_log_path: /tmp/admin_access.log
  address:
    socket_address:
       address: 0.0.0.0
       port_value: 9901

static_resources:
  listeners:
  - name: listener_0
    address:
      socket_address: { address: 0.0.0.0, port_value: 80 }
    filter_chains:
    - filters:
      - name: envoy.filters.network.http_connection_manager
        typed_config:
          "@type": type.googleapis.com/envoy.extensions.filters.network.http_connection_manager.v3.HttpConnectionManager
          stat_prefix: ingress_http
          codec_type: AUTO
          route_config:
            name: local_route
            virtual_hosts:
            - name: web_service_1
              domains: ["*"]
              routes:
              - match: { prefix: "/" }
                route: { cluster: local_cluster }
          http_filters:
          - name: envoy.filters.http.router
            typed_config:
              "@type": type.googleapis.com/envoy.extensions.filters.http.router.v3.Router

  clusters:
  - name: local_cluster
    connect_timeout: 0.25s
    type: STATIC
    lb_policy: ROUND_ROBIN
    load_assignment:
      cluster_name: local_cluster
      endpoints:
      - lb_endpoints:
        - endpoint:
            address:
              socket_address: { address: 172.31.5.11, port_value: 8080 }
        - endpoint:
            address:
              socket_address: { address: 172.31.5.12, port_value: 8080 }
docker-compose.yaml
查看代码
version: '3.3'

services:
  envoy:
    image: envoyproxy/envoy:v1.23-latest
    volumes:
    - ./envoy.yaml:/etc/envoy/envoy.yaml
    environment:
      - ENVOY_UID=0
      - ENVOY_GID=0
    networks:
      envoymesh:
        ipv4_address: 172.31.5.2
        aliases:
        - front-proxy
    depends_on:
    - webserver01
    - webserver02
    ports:
    - "9901:9901"


  webserver01:
    image: ikubernetes/demoapp:v1.0
    environment:
      - PORT=8080
    hostname: webserver01
    networks:
      envoymesh:
        ipv4_address: 172.31.5.11
        aliases:
        - webserver01

  webserver02:
    image: ikubernetes/demoapp:v1.0
    environment:
      - PORT=8080
    hostname: webserver02
    networks:
      envoymesh:
        ipv4_address: 172.31.5.12
        aliases:
        - webserver02

networks:
  envoymesh:
    driver: bridge
    ipam:
      config:
        - subnet: 172.31.5.0/24
运行envoy
docker-compose up -d测试envoy
连接envoy容器
# docker-compose exec envoy bash
root@e8486e37e7b3:/#
获取帮助信息
查看代码
 # curl 127.0.0.1:9901/help
admin commands are:
  /: Admin home page
  /certs: print certs on machine
  /clusters: upstream cluster status
  /config_dump: dump current Envoy configs (experimental)
  /contention: dump current Envoy mutex contention stats (if enabled)
  /cpuprofiler: enable/disable the CPU profiler
  /drain_listeners: drain listeners
  /healthcheck/fail: cause the server to fail health checks
  /healthcheck/ok: cause the server to pass health checks
  /heapprofiler: enable/disable the heap profiler
  /help: print out list of admin commands
  /hot_restart_version: print the hot restart compatibility version
  /init_dump: dump current Envoy init manager information (experimental)
  /listeners: print listener info
  /logging: query/change logging levels
  /memory: print current allocation/heap usage
  /quitquitquit: exit the server
  /ready: print server state, return 200 if LIVE, otherwise return 503
  /reopen_logs: reopen access logs
  /reset_counters: reset all counters to zero
  /runtime: print runtime values
  /runtime_modify: modify runtime values
  /server_info: print server version/status information
  /stats: print server stats
  /stats/prometheus: print server stats in prometheus format
  /stats/recentlookups: Show recent stat-name lookups
  /stats/recentlookups/clear: clear list of stat-name lookups and counter
  /stats/recentlookups/disable: disable recording of reset stat-name lookup names
  /stats/recentlookups/enable: enable recording of reset stat-name lookup names
查看完整配置
# curl 127.0.0.1:9901/config_dump列出各Listener
# curl 127.0.0.1:9901/listenersadmin interface ui
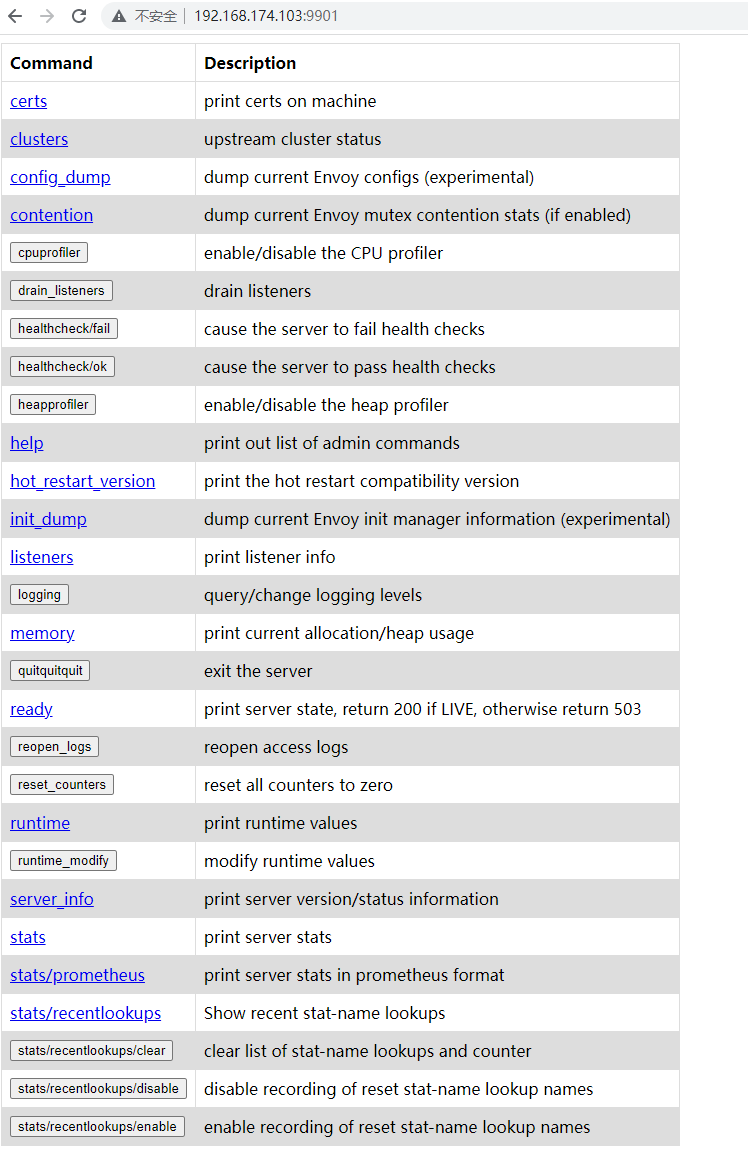
管理接口
管理接口列表
admin commands are:
  /: Admin home page                                                  # GET
  /certs: print certs on machine                                      # GET,列出已加载的所有TLS证书及相关的信息;
  /clusters: upstream cluster status                                  # GET,额外支持使用“GET /clusters?format=json”
  /config_dump: dump current Envoy configs (experimental)             # GET,打印Envoy加载的各类配置信息;支持include_eds、master和resource等查询参数;
  /contention: dump current Envoy mutex contention stats (if enabled) # GET,互斥跟踪
  /cpuprofiler: enable/disable the CPU profiler                       # POST,启用或禁用cpuprofiler
  /drain_listeners: drain listeners                                   # POST,驱逐所有的listener,支持使用inboundonly(仅入站侦听器)和graceful(优雅关闭)等查询参数;
  /healthcheck/fail: cause the server to fail health checks           # POST,强制设定HTTP健康状态检查为失败;
  /healthcheck/ok: cause the server to pass health checks             # POST,强制设定HTTP健康状态检查为成功;
  /heapprofiler: enable/disable the heap profiler                     # POST,启用或禁用heapprofiler;
  /help: print out list of admin commands
  /hot_restart_version: print the hot restart compatibility version   # GET,打印热重启相关的信息;
  /init_dump: dump current Envoy init manager information (experimental)
  /listeners: print listener info                                     # GET,列出所有侦听器,支持使用“GET /listeners?format=json”
  /logging: query/change logging levels                               # POST,启用或禁用不同子组件上的不同日志记录级别
  /memory: print current allocation/heap usage                        # POST,打印当前内在分配信息,以字节为单位;
  /quitquitquit: exit the server                                      # POST,干净退出服务器;
  /ready: print server state, return 200 if LIVE, otherwise return 503 # GET,返回envoy服务当前的状态;
  /reopen_logs: reopen access logs                                    # POST,重新打开所有的日志,功能类似于SIGUSR1信号;
  /reset_counters: reset all counters to zero                         # POST,重围所有计数器;
  /runtime: print runtime values                                      # GET,以json格式输出所有运行时相关值;
  /runtime_modify: modify runtime values                              # POST /runtime_modify?key1=value1&key2=value2,添加或修改在查询参数中传递的运行时值;
  /server_info: print server version/status information               # GET,打印当前Envoy Server的相关信息;
  /stats: print server stats                                          # 按需输出统计数据,例如GET /stats?filter=regex,另外还支持json和prometheus两种输出格式;
  /stats/prometheus: print server stats in prometheus format          # 输出prometheus格式的统计信息;
  /stats/recentlookups: Show recent stat-name lookups
  /stats/recentlookups/clear: clear list of stat-name lookups and counter
  /stats/recentlookups/disable: disable recording of reset stat-name lookup names
  /stats/recentlookups/enable: enable recording of reset stat-name lookup names
管理接口输出样例
- GET /clusters:列出所有已配置的集群,包括每个集群中发现的所有上游主机以及每个主机的统计信息;支持输出为json格式;
-
集群管理器信息:“version_info string”,无CDS时,则显示为“version_info::static”
-
集群相关的信息:断路器、异常点检测和用于表示是否通过CDS添加的标识“add_via_api”
-
每个主机的统计信息:包括总连接数、活动连接数、总请求数和主机的健康状态等;不健康的原因通常有以下三种
-
failed_active_hc:未通过主动健康状态检测;
-
failed_eds_health:被EDS标记为不健康;
-
failed_outlier_check:未通过异常检测机制的检查;
-
-
-
GET /listeners:列出所有已配置的侦听器,包括侦听器的名称以及监听的地址;支持输出为json格式;
- reset_counters:将所有计数器重围为0;不过,它只会影响Server本地的输出,对于已经发送到外部存储系统的统计数据无效;
-
GET /config_dump:以json格式打印当前从Envoy的各种组件加载的配置信息;
-
GET /ready:获取Server就绪与否的状态,LIVE状态为200,否则为503;
集群统计信息主机状态
Per host statistics
|
Name |
Type |
Description |
|---|---|---|
|
cx_total |
Counter |
Total connections |
|
cx_active |
Gauge |
Total active connections |
|
cx_connect_fail |
Counter |
Total connection failures |
|
rq_total |
Counter |
Total requests |
|
rq_timeout |
Counter |
Total timed out requests |
|
rq_success |
Counter |
Total requests with non-5xx responses |
|
rq_error |
Counter |
Total requests with 5xx responses |
|
rq_active |
Gauge |
Total active requests |
|
healthy |
String |
The health status of the host. See below |
|
weight |
Integer |
Load balancing weight (1-100) |
|
zone |
String |
Service zone |
|
canary |
Boolean |
Whether the host is a canary |
|
success_rate |
Double |
Request success rate (0-100). -1 if there was not enough request volume in the interval to calculate it |
使用示例
# curl -XPOST http://envoy_ip:admin_port/runtime_modify?key1=val1&key2=val2
# curl -XPOST 'http://envoy_ip:9901/runtime_modify?key1=val1&key2=val2'

 浙公网安备 33010602011771号