cephadm 监控
一 监控组件
官方文档:https://docs.ceph.com/en/pacific/cephadm/services/monitoring/
监控栈由Prometheus、 Prometheus 导出器(Prometheus Module、Node exporter)、Prometheus Alert Manager和Grafana 组成。
Ceph Dashboard 使用Prometheus、Grafana和相关工具来存储和可视化有关集群利用率和性能的详细指标。
二 ceph监控
ceph在引导新集群时默认安装监控组件,除非使用该--skip-monitoring-stack 选项。
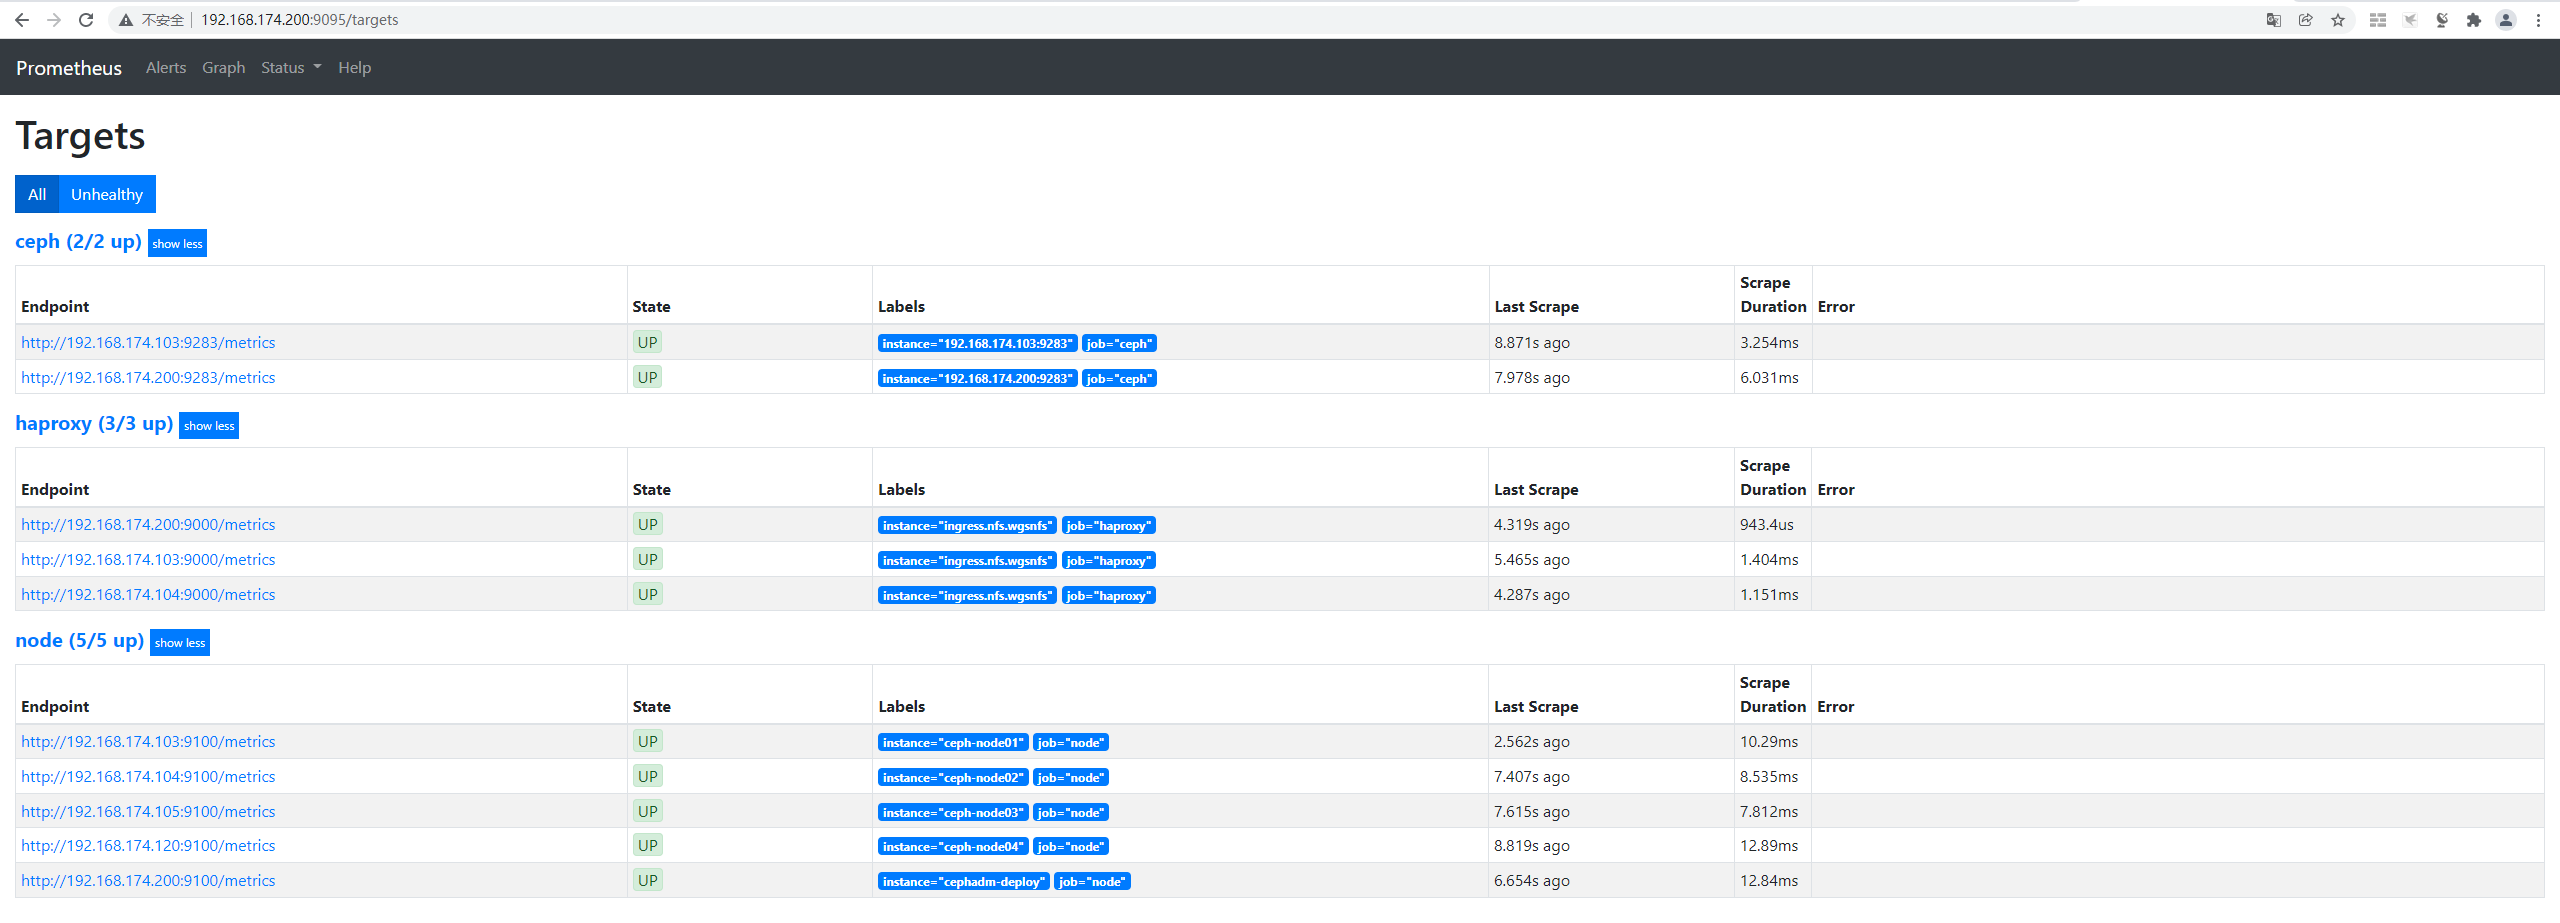
默认情况下,ceph-mgr 在每个运行 ceph-mgr 守护进程的主机上的端口 9283 上显示 prometheus 指标。
三 Prometheus
四 grafana dashboard
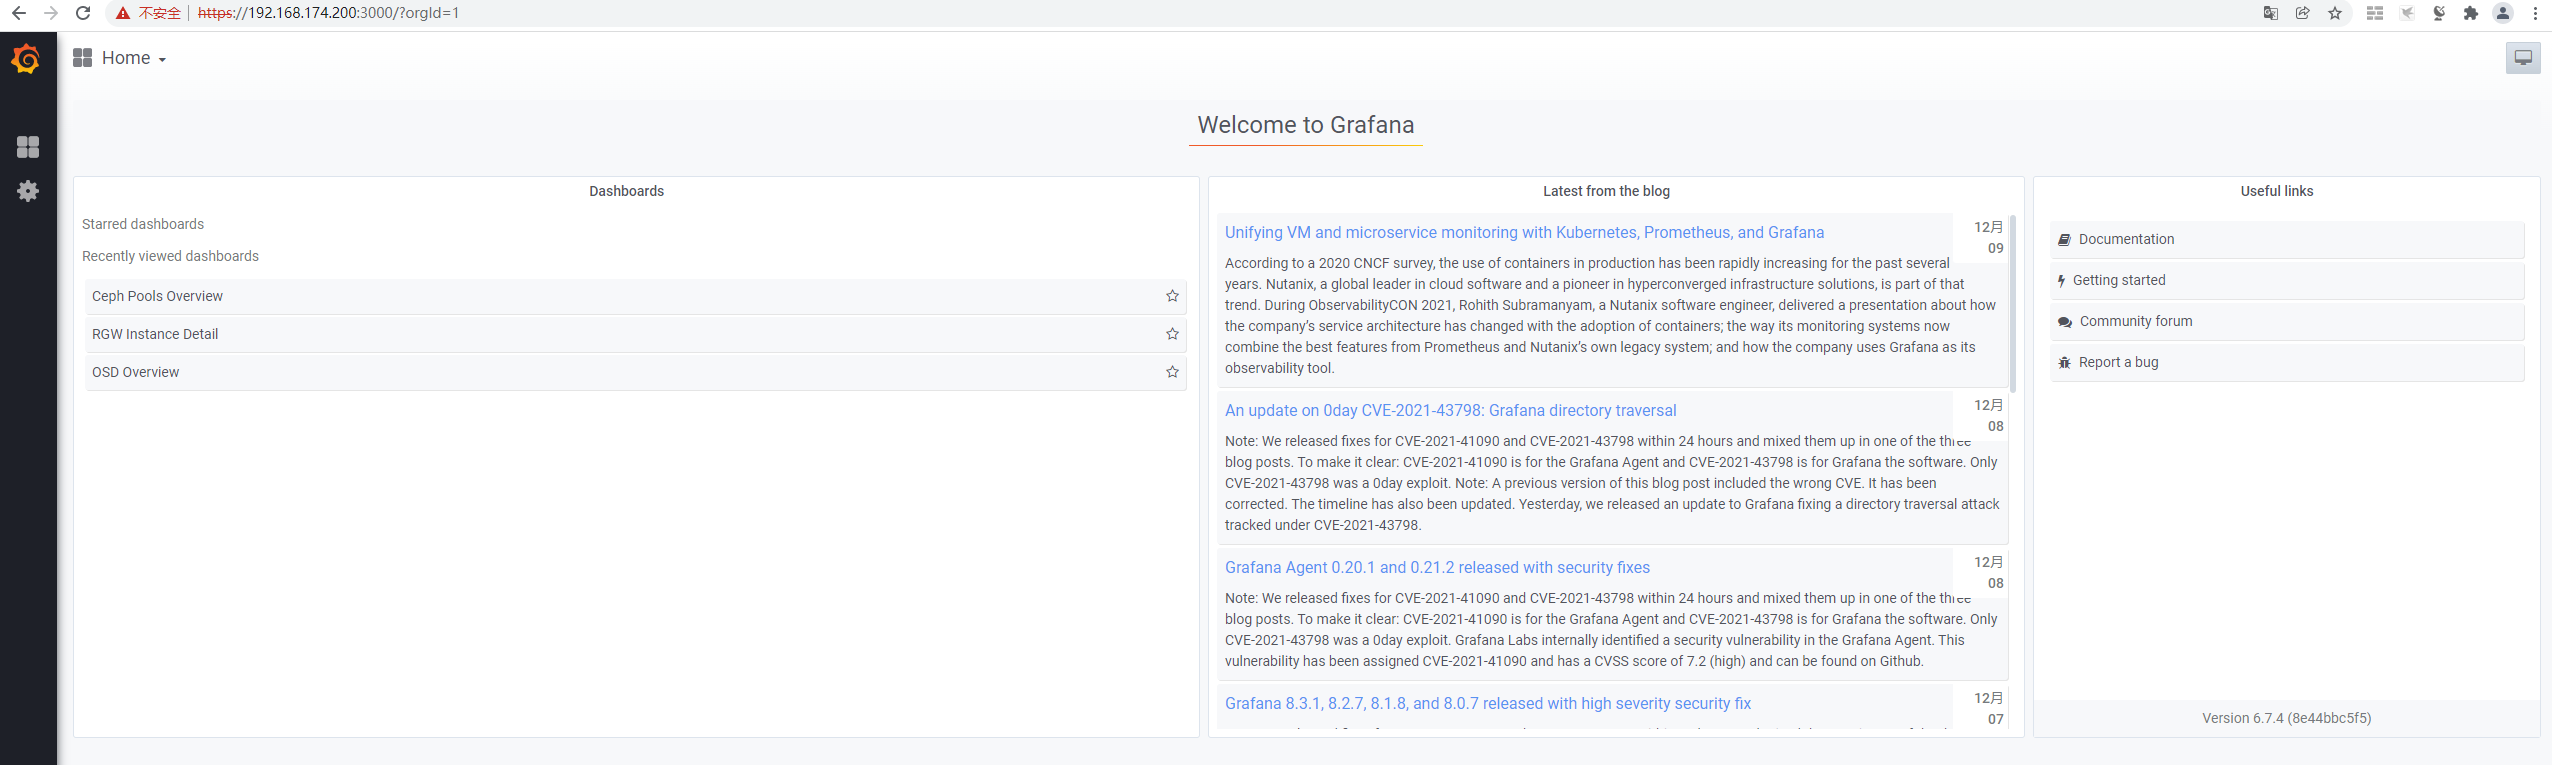
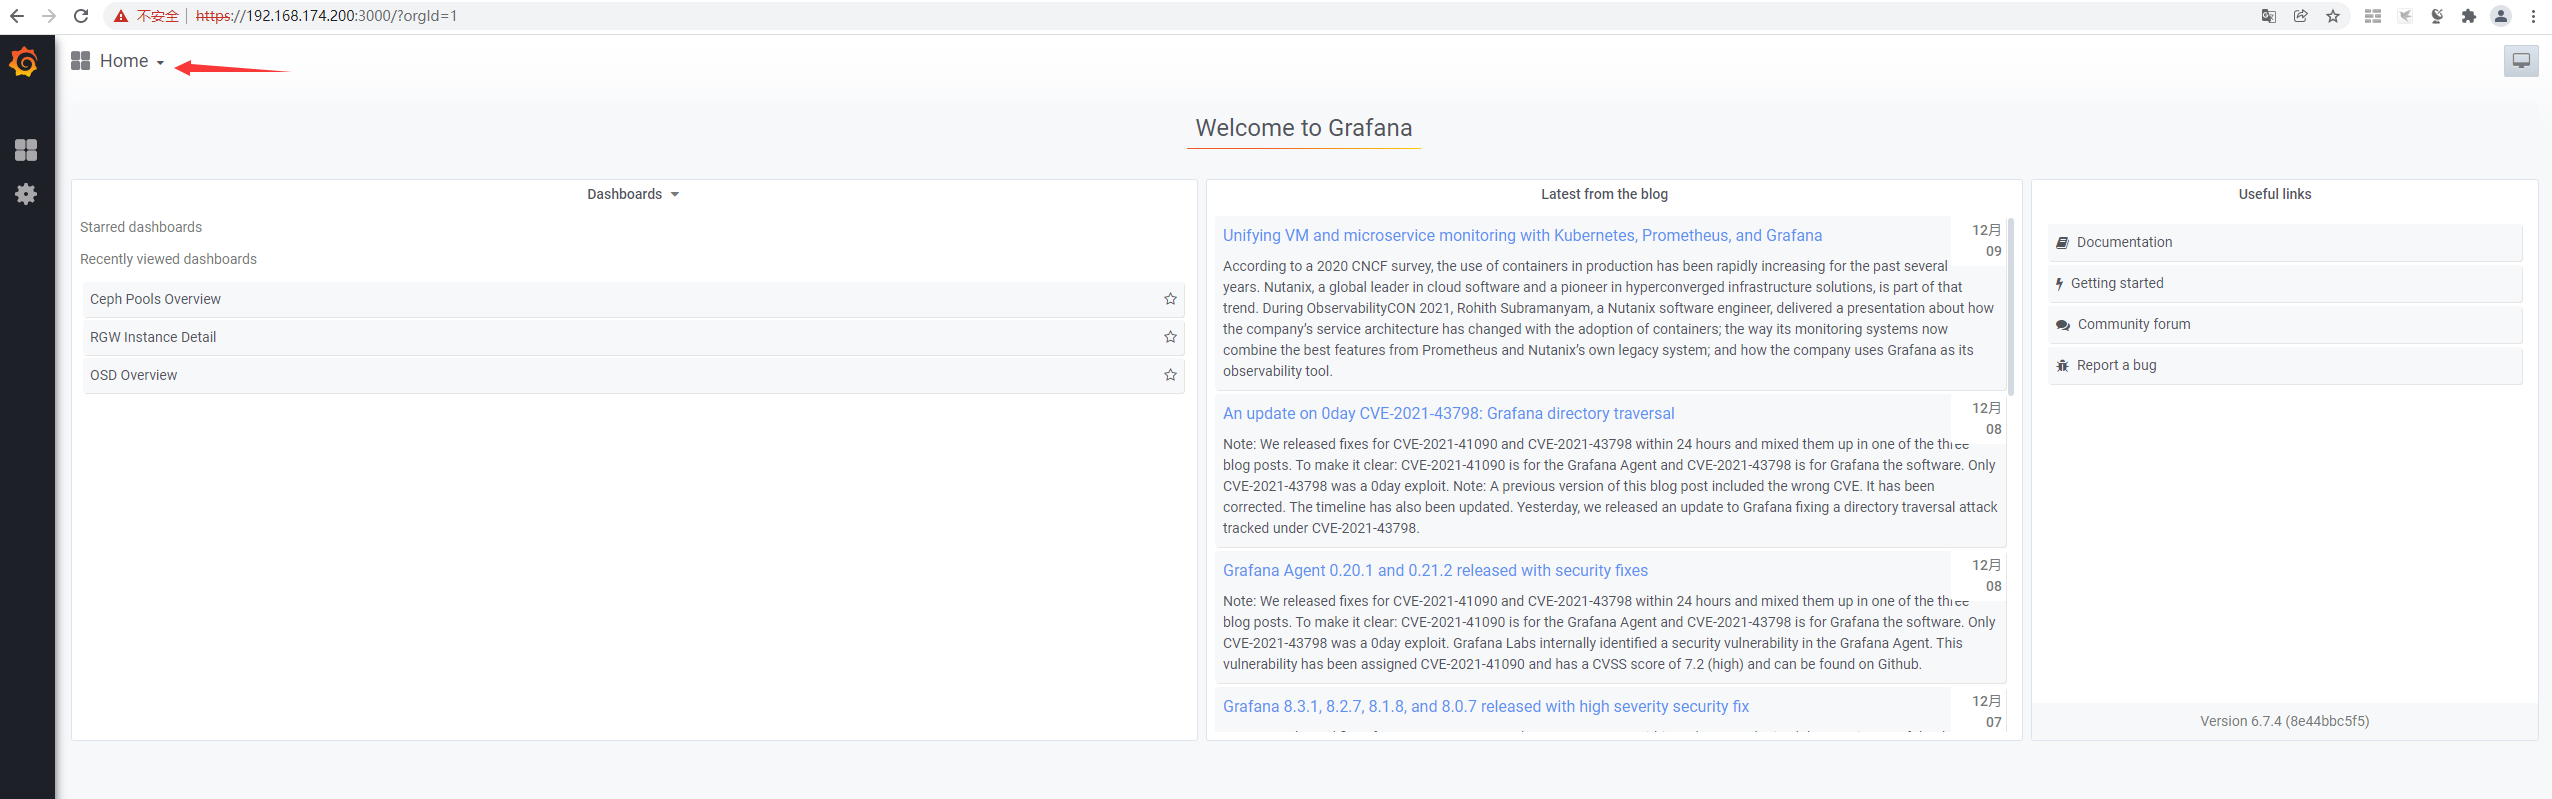
4.1 访问grafana dashboard
https://192.168.174.200:3000/
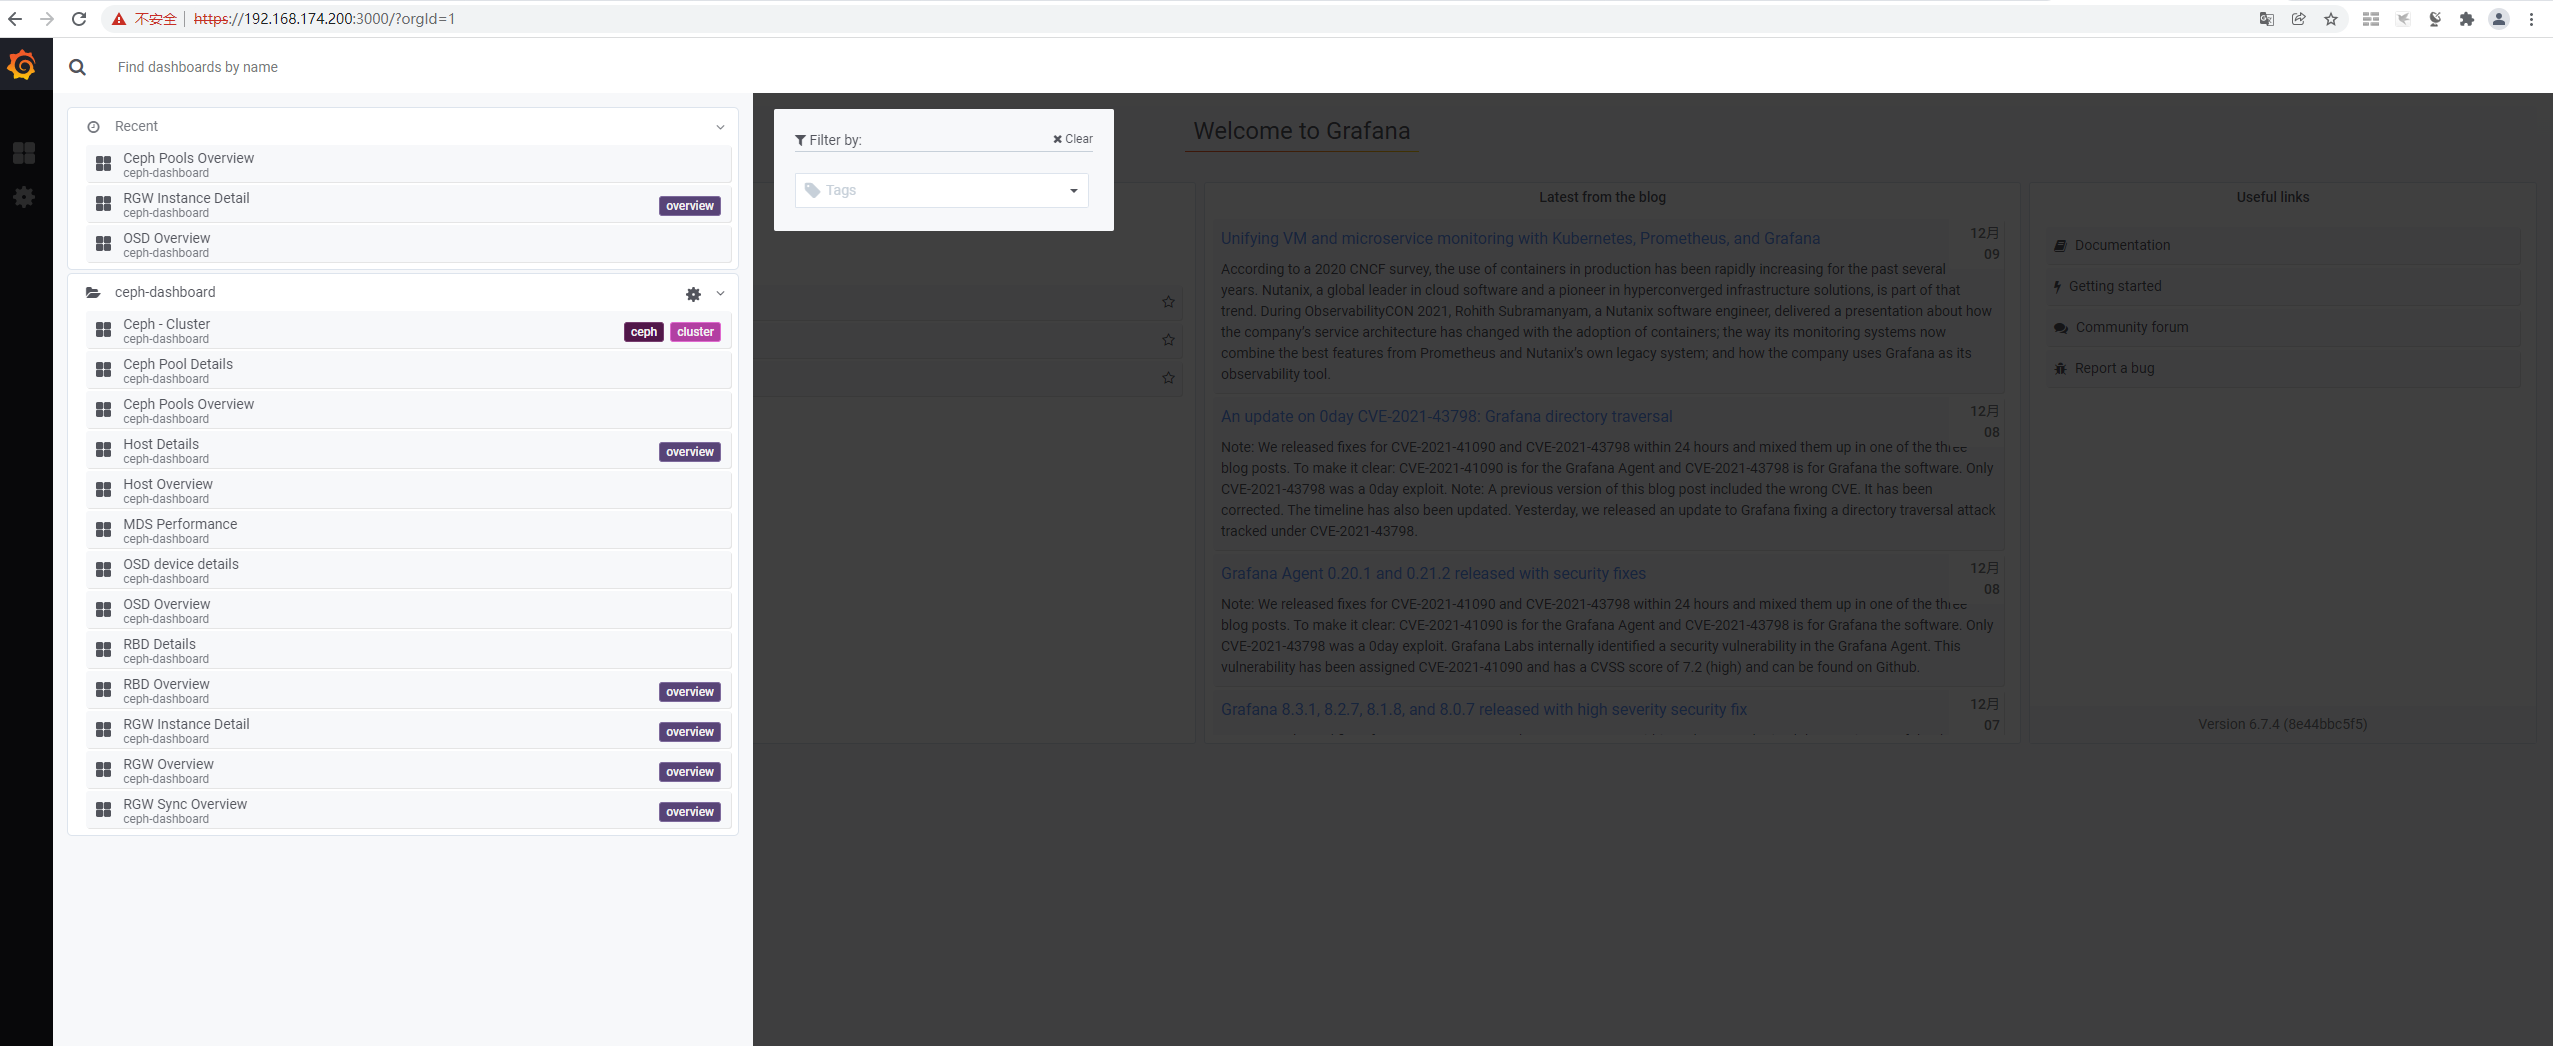
4.2 监控模板
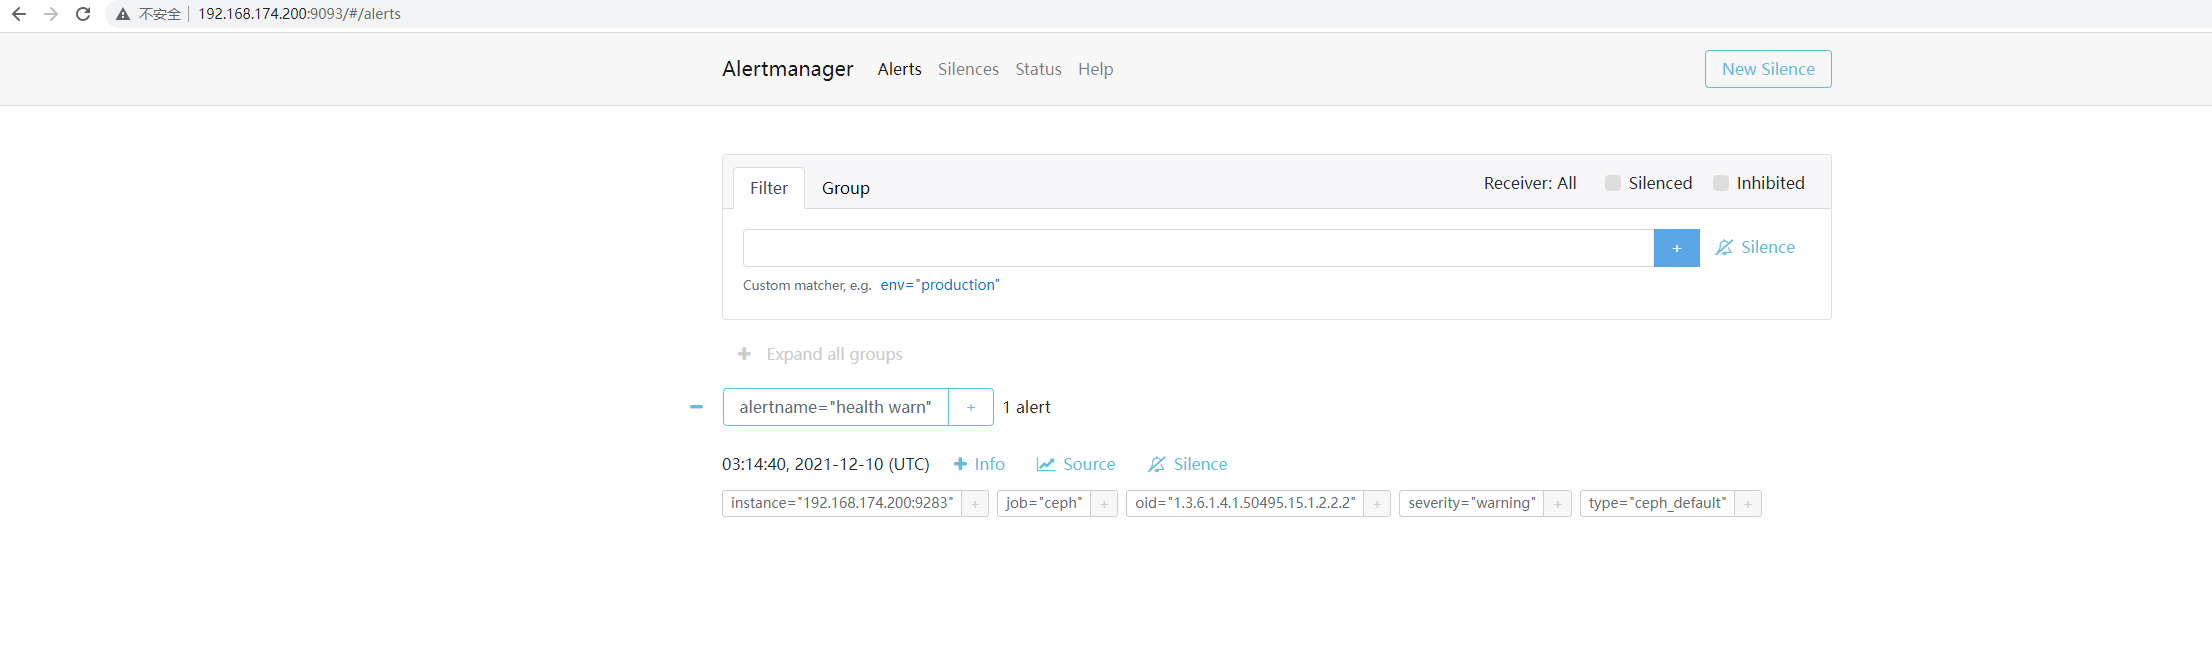
五 alertmanager

 浙公网安备 33010602011771号