nacos监控
一 nacos监控指标
1.1 nacos监控指标
| 指标 | 含义 |
|---|---|
| http_server_requests_seconds_count | http请求次数,包括多种(url,方法,code) |
| http_server_requests_seconds_sum | http请求总耗时,包括多种(url,方法,code) |
| nacos_timer_seconds_sum | Nacos config水平通知耗时 |
| nacos_timer_seconds_count | Nacos config水平通知次数 |
| nacos_monitor{name='longPolling'} | Nacos config长连接数 |
| nacos_monitor{name='configCount'} | Nacos config配置个数 |
| nacos_monitor{name='dumpTask'} | Nacos config配置落盘任务堆积数 |
| nacos_monitor{name='notifyTask'} | Nacos config配置水平通知任务堆积数 |
| nacos_monitor{name='getConfig'} | Nacos config读配置统计数 |
| nacos_monitor{name='publish'} | Nacos config写配置统计数 |
| nacos_monitor{name='ipCount'} | Nacos naming ip个数 |
| nacos_monitor{name='domCount'} | Nacos naming域名个数 |
| nacos_monitor{name='failedPush'} | Nacos naming推送失败数 |
| nacos_monitor{name='avgPushCost'} | Nacos naming平均推送耗时 |
| nacos_monitor{name='leaderStatus'} | Nacos naming角色状态 |
| nacos_monitor{name='maxPushCost'} | Nacos naming最大推送耗时 |
| nacos_monitor{name='mysqlhealthCheck'} | Nacos naming mysql健康检查次数 |
| nacos_monitor{name='httpHealthCheck'} | Nacos naming http健康检查次数 |
| nacos_monitor{name='tcpHealthCheck'} | Nacos naming tcp健康检查次数 |
1.2 nacos异常指标
| 指标 | 含义 |
|---|---|
| nacos_exception_total{name='db'} | 数据库异常 |
| nacos_exception_total{name='configNotify'} | Nacos config水平通知失败 |
| nacos_exception_total{name='unhealth'} | Nacos config server之间健康检查异常 |
| nacos_exception_total{name='disk'} | Nacos naming写磁盘异常 |
| nacos_exception_total{name='leaderSendBeatFailed'} | Nacos naming leader发送心跳异常 |
| nacos_exception_total{name='illegalArgument'} | 请求参数不合法 |
| nacos_exception_total{name='nacos'} | Nacos请求响应内部错误异常(读写失败,没权限,参数错误) |
1.3 jvm metric
| 指标 | 含义 |
|---|---|
| system_cpu_usage | CPU使用率 |
| system_load_average_1m | load |
| jvm_memory_used_bytes | 内存使用字节,包含各种内存区 |
| jvm_memory_max_bytes | 内存最大字节,包含各种内存区 |
| jvm_gc_pause_seconds_count | gc次数,包含各种gc |
| jvm_gc_pause_seconds_sum | gc耗时,包含各种gc |
| jvm_threads_daemon | 线程数 |
1.4 client metrics
| 指标 | 含义 |
|---|---|
| nacos_monitor{name='subServiceCount'} | 订阅的服务数 |
| nacos_monitor{name='pubServiceCount'} | 发布的服务数 |
| nacos_monitor{name='configListenSize'} | 监听的配置数 |
| nacos_client_request_seconds_count | 请求的次数,包括多种(url,方法,code) |
| nacos_client_request_seconds_sum | 请求的总耗时,包括多种(url,方法,code) |
二 nacos暴露metric数据
2.1 修改application.properties文件
~# grep management.endpoints.web.exposure.include /usr/local/nacos/conf/application.properties
#management.endpoints.web.exposure.include=*
~# sed -i 's@#management.endpoints.web.exposure.include@management.endpoints.web.exposure.include@g' /usr/local/nacos/conf/application.properties
~# grep management.endpoints.web.exposure.include /usr/local/nacos/conf/application.properties
management.endpoints.web.exposure.include=*
2.2 重启nacos服务
~# systemctl restart nacos2.3 验证nacos web界面
http://192.168.174.103:8848/nacos/actuator/prometheus
三 Prometheus监控nacos
3.1 修改Prometheus.yml文件
~# cat /usr/local/prometheus/prometheus.yml
- job_name: "nacos"
    metrics_path: '/nacos/actuator/prometheus'
    static_configs:
      - targets:
        - "192.168.174.103:8848"
        - "192.168.174.104:8848"
        - "192.168.174.105:8848"
3.2 重启Prometheus服务
~# systemctl restart prometheus3.3 验证Prometheus web界面
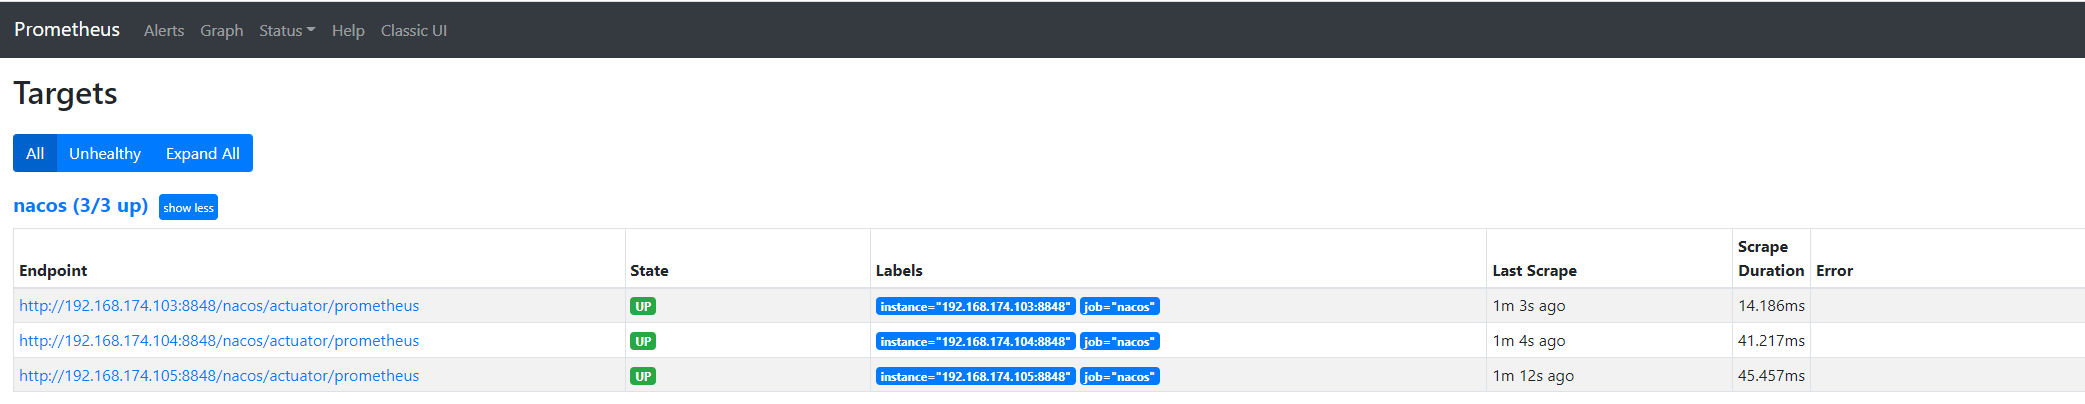
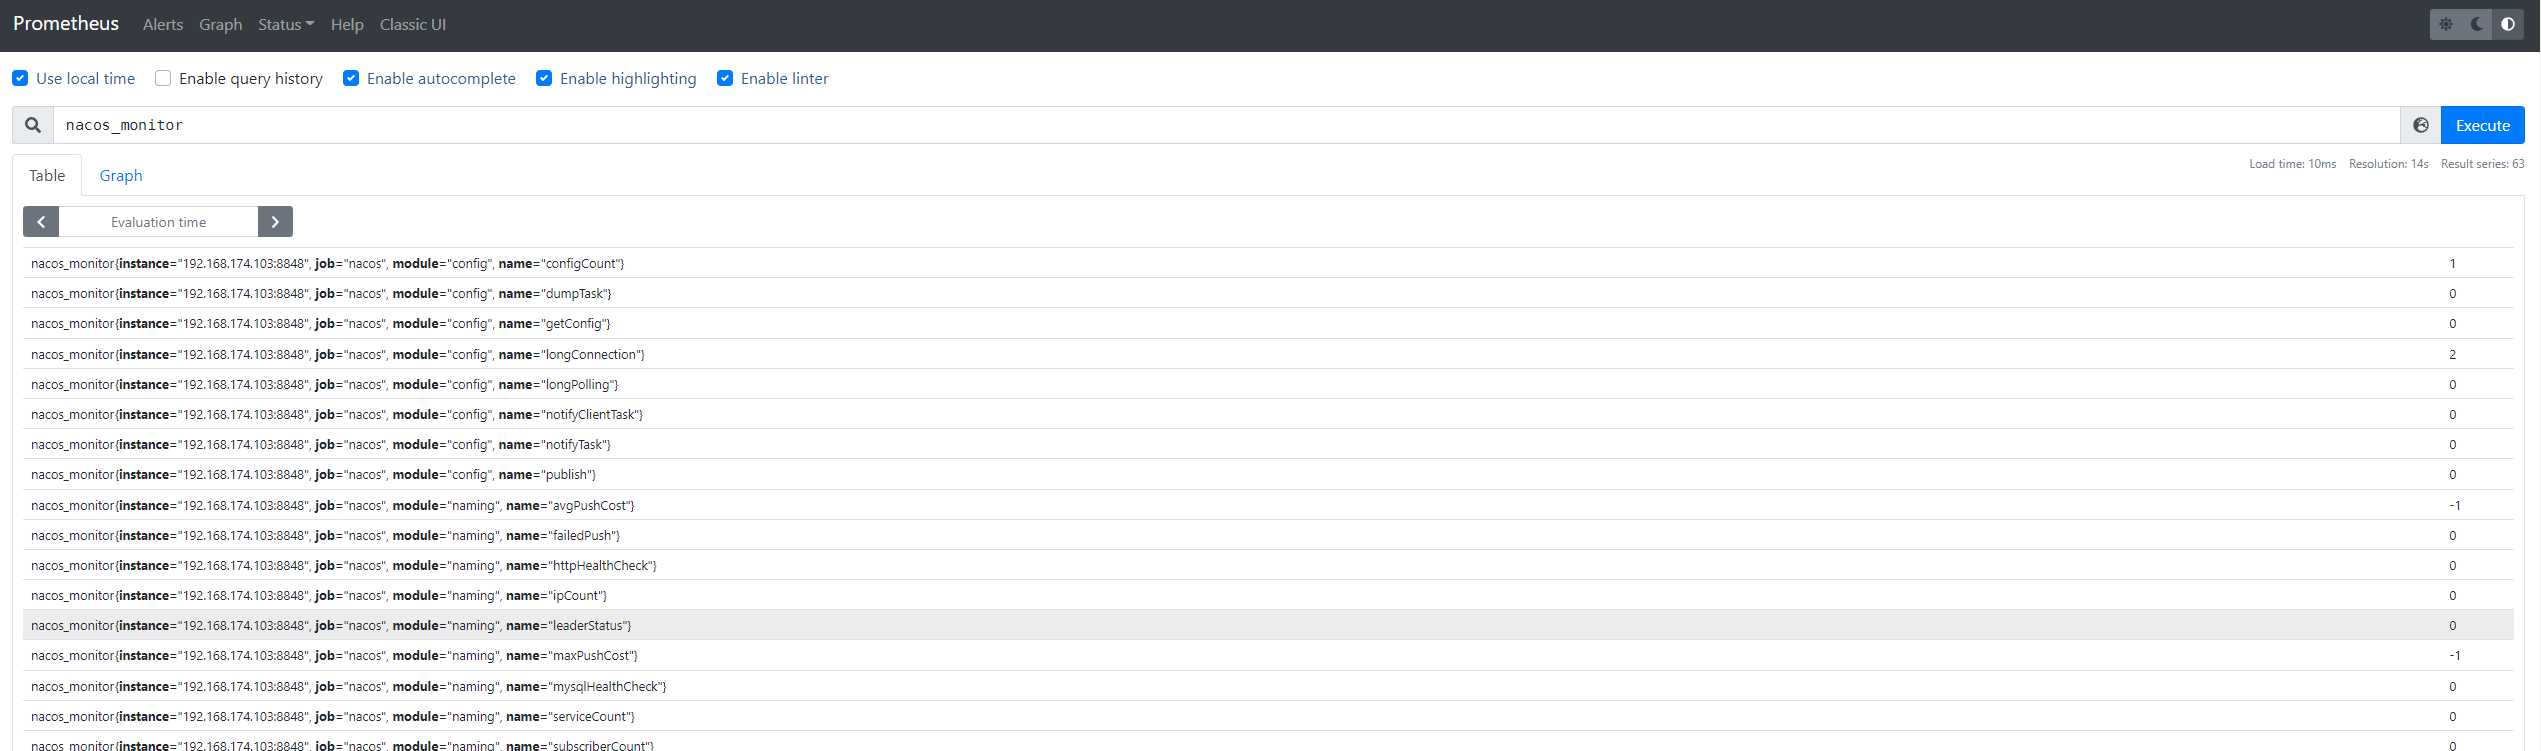
3.4 验证Prometheus 数据
三 grafana配置
3.1 模板信息
点击查看代码
{
"annotations": {
"list": [
{
"builtIn": 1,
"datasource": "-- Grafana --",
"enable": true,
"hide": true,
"iconColor": "rgba(0, 211, 255, 1)",
"name": "Annotations & Alerts",
"type": "dashboard"
}
]
},
"editable": true,
"gnetId": null,
"graphTooltip": 0,
"id": 8,
"iteration": 1547344645256,
"links": [],
"panels": [
{
"collapsed": false,
"gridPos": {
"h": 1,
"w": 24,
"x": 0,
"y": 0
},
"id": 80,
"panels": [],
"title": "nacos monitor",
"type": "row"
},
{
"cacheTimeout": null,
"colorBackground": false,
"colorValue": false,
"colors": [
"#299c46",
"rgba(237, 129, 40, 0.89)",
"#d44a3a"
],
"datasource": "prometheus",
"format": "none",
"gauge": {
"maxValue": 100,
"minValue": 0,
"show": false,
"thresholdLabels": false,
"thresholdMarkers": true
},
"gridPos": {
"h": 3,
"w": 3,
"x": 0,
"y": 1
},
"id": 89,
"interval": null,
"links": [],
"mappingType": 1,
"mappingTypes": [
{
"name": "value to text",
"value": 1
},
{
"name": "range to text",
"value": 2
}
],
"maxDataPoints": 100,
"nullPointMode": "connected",
"nullText": null,
"postfix": "",
"postfixFontSize": "50%",
"prefix": "",
"prefixFontSize": "50%",
"rangeMaps": [
{
"from": "null",
"text": "N/A",
"to": "null"
}
],
"sparkline": {
"fillColor": "rgba(31, 118, 189, 0.18)",
"full": false,
"lineColor": "rgb(31, 120, 193)",
"show": false
},
"tableColumn": "",
"targets": [
{
"expr": "count(nacos_monitor{name=\"configCount\"})",
"format": "time_series",
"intervalFactor": 1,
"refId": "A"
}
],
"thresholds": "",
"title": "UP",
"type": "singlestat",
"valueFontSize": "80%",
"valueMaps": [
{
"op": "=",
"text": "N/A",
"value": "null"
}
],
"valueName": "current"
},
{
"cacheTimeout": null,
"colorBackground": false,
"colorValue": false,
"colors": [
"#299c46",
"rgba(237, 129, 40, 0.89)",
"#d44a3a"
],
"datasource": "prometheus",
"format": "none",
"gauge": {
"maxValue": 100,
"minValue": 0,
"show": false,
"thresholdLabels": false,
"thresholdMarkers": true
},
"gridPos": {
"h": 3,
"w": 3,
"x": 3,
"y": 1
},
"id": 90,
"interval": null,
"links": [],
"mappingType": 1,
"mappingTypes": [
{
"name": "value to text",
"value": 1
},
{
"name": "range to text",
"value": 2
}
],
"maxDataPoints": 100,
"nullPointMode": "connected",
"nullText": null,
"postfix": "",
"postfixFontSize": "50%",
"prefix": "",
"prefixFontSize": "50%",
"rangeMaps": [
{
"from": "null",
"text": "N/A",
"to": "null"
}
],
"sparkline": {
"fillColor": "rgba(31, 118, 189, 0.18)",
"full": false,
"lineColor": "rgb(31, 120, 193)",
"show": false
},
"tableColumn": "",
"targets": [
{
"expr": "max(nacos_monitor{name='domCount'})",
"format": "time_series",
"intervalFactor": 1,
"refId": "A"
}
],
"thresholds": "",
"title": "service count",
"type": "singlestat",
"valueFontSize": "80%",
"valueMaps": [
{
"op": "=",
"text": "N/A",
"value": "null"
}
],
"valueName": "current"
},
{
"cacheTimeout": null,
"colorBackground": false,
"colorValue": false,
"colors": [
"#299c46",
"rgba(237, 129, 40, 0.89)",
"#d44a3a"
],
"datasource": "prometheus",
"format": "none",
"gauge": {
"maxValue": 100,
"minValue": 0,
"show": false,
"thresholdLabels": false,
"thresholdMarkers": true
},
"gridPos": {
"h": 3,
"w": 3,
"x": 6,
"y": 1
},
"id": 93,
"interval": null,
"links": [],
"mappingType": 1,
"mappingTypes": [
{
"name": "value to text",
"value": 1
},
{
"name": "range to text",
"value": 2
}
],
"maxDataPoints": 100,
"nullPointMode": "connected",
"nullText": null,
"postfix": "",
"postfixFontSize": "50%",
"prefix": "",
"prefixFontSize": "50%",
"rangeMaps": [
{
"from": "null",
"text": "N/A",
"to": "null"
}
],
"sparkline": {
"fillColor": "rgba(31, 118, 189, 0.18)",
"full": false,
"lineColor": "rgb(31, 120, 193)",
"show": false
},
"tableColumn": "",
"targets": [
{
"expr": "max(nacos_monitor{name='ipCount'})",
"format": "time_series",
"intervalFactor": 1,
"refId": "A"
}
],
"thresholds": "",
"title": "ip count",
"type": "singlestat",
"valueFontSize": "80%",
"valueMaps": [
{
"op": "=",
"text": "N/A",
"value": "null"
}
],
"valueName": "current"
},
{
"cacheTimeout": null,
"colorBackground": false,
"colorValue": false,
"colors": [
"#299c46",
"rgba(237, 129, 40, 0.89)",
"#d44a3a"
],
"datasource": "prometheus",
"format": "none",
"gauge": {
"maxValue": 100,
"minValue": 0,
"show": false,
"thresholdLabels": false,
"thresholdMarkers": true
},
"gridPos": {
"h": 3,
"w": 3,
"x": 9,
"y": 1
},
"id": 92,
"interval": null,
"links": [],
"mappingType": 1,
"mappingTypes": [
{
"name": "value to text",
"value": 1
},
{
"name": "range to text",
"value": 2
}
],
"maxDataPoints": 100,
"nullPointMode": "connected",
"nullText": null,
"postfix": "",
"postfixFontSize": "50%",
"prefix": "",
"prefixFontSize": "50%",
"rangeMaps": [
{
"from": "null",
"text": "N/A",
"to": "null"
}
],
"sparkline": {
"fillColor": "rgba(31, 118, 189, 0.18)",
"full": false,
"lineColor": "rgb(31, 120, 193)",
"show": false
},
"tableColumn": "",
"targets": [
{
"expr": "max(nacos_monitor{name='configCount', instance=~'$instance'})",
"format": "time_series",
"intervalFactor": 1,
"refId": "A"
}
],
"thresholds": "",
"title": "config count",
"type": "singlestat",
"valueFontSize": "80%",
"valueMaps": [
{
"op": "=",
"text": "N/A",
"value": "null"
}
],
"valueName": "current"
},
{
"cacheTimeout": null,
"colorBackground": false,
"colorValue": false,
"colors": [
"#299c46",
"rgba(237, 129, 40, 0.89)",
"#d44a3a"
],
"datasource": "prometheus",
"format": "none",
"gauge": {
"maxValue": 100,
"minValue": 0,
"show": false,
"thresholdLabels": false,
"thresholdMarkers": true
},
"gridPos": {
"h": 3,
"w": 3,
"x": 12,
"y": 1
},
"id": 91,
"interval": null,
"links": [],
"mappingType": 1,
"mappingTypes": [
{
"name": "value to text",
"value": 1
},
{
"name": "range to text",
"value": 2
}
],
"maxDataPoints": 100,
"nullPointMode": "connected",
"nullText": null,
"postfix": "",
"postfixFontSize": "50%",
"prefix": "",
"prefixFontSize": "50%",
"rangeMaps": [
{
"from": "null",
"text": "N/A",
"to": "null"
}
],
"sparkline": {
"fillColor": "rgba(31, 118, 189, 0.18)",
"full": false,
"lineColor": "rgb(31, 120, 193)",
"show": false
},
"tableColumn": "",
"targets": [
{
"expr": "sum(nacos_monitor{name='longPolling'})",
"format": "time_series",
"intervalFactor": 1,
"refId": "A"
}
],
"thresholds": "",
"title": "long polling",
"type": "singlestat",
"valueFontSize": "80%",
"valueMaps": [
{
"op": "=",
"text": "N/A",
"value": "null"
}
],
"valueName": "current"
},
{
"cacheTimeout": null,
"colorBackground": false,
"colorValue": false,
"colors": [
"#299c46",
"rgba(237, 129, 40, 0.89)",
"#d44a3a"
],
"datasource": "prometheus",
"format": "none",
"gauge": {
"maxValue": 100,
"minValue": 0,
"show": false,
"thresholdLabels": false,
"thresholdMarkers": true
},
"gridPos": {
"h": 3,
"w": 3,
"x": 15,
"y": 1
},
"id": 88,
"interval": null,
"links": [],
"mappingType": 1,
"mappingTypes": [
{
"name": "value to text",
"value": 1
},
{
"name": "range to text",
"value": 2
}
],
"maxDataPoints": 100,
"nullPointMode": "connected",
"nullText": null,
"postfix": "",
"postfixFontSize": "50%",
"prefix": "",
"prefixFontSize": "50%",
"rangeMaps": [
{
"from": "null",
"text": "N/A",
"to": "null"
}
],
"sparkline": {
"fillColor": "rgba(31, 118, 189, 0.18)",
"full": false,
"lineColor": "rgb(31, 120, 193)",
"show": false
},
"tableColumn": "",
"targets": [
{
"expr": "sum(nacos_monitor{name='getConfig', instance=~'$instance'}) by (name)",
"format": "time_series",
"intervalFactor": 1,
"refId": "A"
}
],
"thresholds": "",
"title": "config push total",
"type": "singlestat",
"valueFontSize": "80%",
"valueMaps": [
{
"op": "=",
"text": "N/A",
"value": "null"
}
],
"valueName": "current"
},
{
"content": "<html>\n<body>\n<center>\n<a href=\"https://nacos.io\">\n<img src=\"https://nacos.io/img/nacos.png\" style=\"height: 50px;\" >\n</a>\n</center>\n</body>\n</html>",
"gridPos": {
"h": 3,
"w": 6,
"x": 18,
"y": 1
},
"id": 82,
"links": [],
"mode": "html",
"title": "",
"type": "text"
},
{
"cacheTimeout": null,
"colorBackground": false,
"colorPrefix": false,
"colorValue": false,
"colors": [
"#299c46",
"rgba(237, 129, 40, 0.89)",
"#d44a3a"
],
"datasource": "prometheus",
"decimals": null,
"format": "none",
"gauge": {
"maxValue": 100,
"minValue": 0,
"show": true,
"thresholdLabels": false,
"thresholdMarkers": true
},
"gridPos": {
"h": 4,
"w": 9,
"x": 0,
"y": 4
},
"id": 33,
"interval": "",
"links": [],
"mappingType": 1,
"mappingTypes": [
{
"name": "value to text",
"value": 1
},
{
"name": "range to text",
"value": 2
}
],
"maxDataPoints": 100,
"nullPointMode": "connected",
"nullText": null,
"postfix": "%",
"postfixFontSize": "50%",
"prefix": "",
"prefixFontSize": "50%",
"rangeMaps": [
{
"from": "null",
"text": "N/A",
"to": "null"
}
],
"repeat": null,
"repeatDirection": "h",
"sparkline": {
"fillColor": "rgba(31, 118, 189, 0.18)",
"full": false,
"lineColor": "rgb(31, 120, 193)",
"show": false
},
"tableColumn": "",
"targets": [
{
"expr": "max(system_cpu_usage{instance=~'$instance'}) * 100",
"format": "time_series",
"interval": "",
"intervalFactor": 1,
"legendFormat": "",
"refId": "A"
}
],
"thresholds": "50,80",
"title": "cpu",
"type": "singlestat",
"valueFontSize": "70%",
"valueMaps": [
{
"op": "=",
"text": "N/A",
"value": "null"
}
],
"valueName": "current"
},
{
"cacheTimeout": null,
"colorBackground": false,
"colorPrefix": false,
"colorValue": false,
"colors": [
"#299c46",
"rgba(237, 129, 40, 0.89)",
"#d44a3a"
],
"datasource": "prometheus",
"decimals": null,
"format": "none",
"gauge": {
"maxValue": 70,
"minValue": 0,
"show": true,
"thresholdLabels": false,
"thresholdMarkers": true
},
"gridPos": {
"h": 4,
"w": 9,
"x": 9,
"y": 4
},
"id": 32,
"interval": null,
"links": [],
"mappingType": 1,
"mappingTypes": [
{
"name": "value to text",
"value": 1
},
{
"name": "range to text",
"value": 2
}
],
"maxDataPoints": 100,
"nullPointMode": "connected",
"nullText": null,
"postfix": "%",
"postfixFontSize": "50%",
"prefix": "",
"prefixFontSize": "50%",
"rangeMaps": [
{
"from": "null",
"text": "N/A",
"to": "null"
}
],
"sparkline": {
"fillColor": "rgba(31, 118, 189, 0.18)",
"full": false,
"lineColor": "rgb(31, 120, 193)",
"show": false
},
"tableColumn": "",
"targets": [
{
"expr": "sum(jvm_memory_used_bytes{area=\"heap\", instance=~'$instance'})/sum(jvm_memory_max_bytes{area=\"heap\", instance=~'$instance'}) * 100",
"format": "time_series",
"intervalFactor": 1,
"refId": "A"
}
],
"thresholds": "50,70",
"title": "memory",
"type": "singlestat",
"valueFontSize": "70%",
"valueMaps": [
{
"op": "=",
"text": "N/A",
"value": "null"
}
],
"valueName": "current"
},
{
"dashboardFilter": "",
"folderId": null,
"gridPos": {
"h": 16,
"w": 6,
"x": 18,
"y": 4
},
"id": 48,
"limit": 10,
"links": [],
"nameFilter": "",
"onlyAlertsOnDashboard": false,
"repeat": null,
"show": "current",
"sortOrder": 1,
"stateFilter": [],
"title": "alert list",
"transparent": false,
"type": "alertlist"
},
{
"cacheTimeout": null,
"colorBackground": false,
"colorPrefix": false,
"colorValue": false,
"colors": [
"#299c46",
"rgba(237, 129, 40, 0.89)",
"#d44a3a"
],
"datasource": "prometheus",
"decimals": null,
"format": "none",
"gauge": {
"maxValue": 1500,
"minValue": 0,
"show": true,
"thresholdLabels": false,
"thresholdMarkers": true
},
"gridPos": {
"h": 4,
"w": 9,
"x": 0,
"y": 8
},
"id": 29,
"interval": null,
"links": [],
"mappingType": 1,
"mappingTypes": [
{
"name": "value to text",
"value": 1
},
{
"name": "range to text",
"value": 2
}
],
"maxDataPoints": 100,
"nullPointMode": "connected",
"nullText": null,
"postfix": "",
"postfixFontSize": "50%",
"prefix": "",
"prefixFontSize": "50%",
"rangeMaps": [
{
"from": "null",
"text": "N/A",
"to": "null"
}
],
"sparkline": {
"fillColor": "rgba(31, 118, 189, 0.18)",
"full": false,
"lineColor": "rgb(31, 120, 193)",
"show": false
},
"tableColumn": "",
"targets": [
{
"expr": "max(jvm_threads_daemon_threads{instance=~'$instance'})",
"format": "time_series",
"intervalFactor": 1,
"refId": "A"
}
],
"thresholds": "800,1500",
"title": "threads",
"type": "singlestat",
"valueFontSize": "70%",
"valueMaps": [
{
"op": "=",
"text": "N/A",
"value": "null"
}
],
"valueName": "current"
},
{
"cacheTimeout": null,
"colorBackground": false,
"colorPrefix": false,
"colorValue": false,
"colors": [
"#299c46",
"rgba(237, 129, 40, 0.89)",
"#d44a3a"
],
"datasource": "prometheus",
"decimals": null,
"format": "none",
"gauge": {
"maxValue": 20,
"minValue": 0,
"show": true,
"thresholdLabels": false,
"thresholdMarkers": true
},
"gridPos": {
"h": 4,
"w": 9,
"x": 9,
"y": 8
},
"id": 30,
"interval": null,
"links": [],
"mappingType": 1,
"mappingTypes": [
{
"name": "value to text",
"value": 1
},
{
"name": "range to text",
"value": 2
}
],
"maxDataPoints": 100,
"nullPointMode": "connected",
"nullText": null,
"postfix": "",
"postfixFontSize": "50%",
"prefix": "",
"prefixFontSize": "50%",
"rangeMaps": [
{
"from": "null",
"text": "N/A",
"to": "null"
}
],
"sparkline": {
"fillColor": "rgba(31, 118, 189, 0.18)",
"full": false,
"lineColor": "rgb(31, 120, 193)",
"show": false
},
"tableColumn": "",
"targets": [
{
"expr": "max(system_load_average_1m{instance=~'$instance'})",
"format": "time_series",
"intervalFactor": 1,
"refId": "A"
}
],
"thresholds": "5,10",
"title": "load",
"type": "singlestat",
"valueFontSize": "70%",
"valueMaps": [
{
"op": "=",
"text": "N/A",
"value": "null"
}
],
"valueName": "current"
},
{
"cacheTimeout": null,
"colorBackground": false,
"colorPrefix": false,
"colorValue": false,
"colors": [
"#299c46",
"rgba(237, 129, 40, 0.89)",
"#d44a3a"
],
"datasource": "prometheus",
"decimals": null,
"format": "none",
"gauge": {
"maxValue": 5000,
"minValue": 0,
"show": true,
"thresholdLabels": false,
"thresholdMarkers": true
},
"gridPos": {
"h": 4,
"w": 9,
"x": 0,
"y": 12
},
"id": 61,
"interval": null,
"links": [],
"mappingType": 1,
"mappingTypes": [
{
"name": "value to text",
"value": 1
},
{
"name": "range to text",
"value": 2
}
],
"maxDataPoints": 100,
"nullPointMode": "connected",
"nullText": null,
"postfix": "ms",
"postfixFontSize": "50%",
"prefix": "",
"prefixFontSize": "50%",
"rangeMaps": [
{
"from": "null",
"text": "N/A",
"to": "null"
}
],
"sparkline": {
"fillColor": "rgba(31, 118, 189, 0.18)",
"full": false,
"lineColor": "rgb(31, 120, 193)",
"show": false
},
"tableColumn": "",
"targets": [
{
"expr": "sum(rate(nacos_timer_seconds_sum{instance=~'$instance'}[1m]))/sum(rate(nacos_timer_seconds_count{instance=~'$instance'}[1m])) * 1000",
"format": "time_series",
"intervalFactor": 1,
"legendFormat": "",
"refId": "A"
}
],
"thresholds": "3000,5000",
"title": "notify rt",
"type": "singlestat",
"valueFontSize": "80%",
"valueMaps": [
{
"op": "=",
"text": "N/A",
"value": "null"
}
],
"valueName": "current"
},
{
"cacheTimeout": null,
"colorBackground": false,
"colorPrefix": false,
"colorValue": false,
"colors": [
"#299c46",
"rgba(237, 129, 40, 0.89)",
"#d44a3a"
],
"datasource": "prometheus",
"decimals": null,
"format": "none",
"gauge": {
"maxValue": 5000,
"minValue": 0,
"show": true,
"thresholdLabels": false,
"thresholdMarkers": true
},
"gridPos": {
"h": 4,
"w": 9,
"x": 9,
"y": 12
},
"id": 26,
"interval": null,
"links": [],
"mappingType": 1,
"mappingTypes": [
{
"name": "value to text",
"value": 1
},
{
"name": "range to text",
"value": 2
}
],
"maxDataPoints": 100,
"nullPointMode": "connected",
"nullText": null,
"postfix": "ms",
"postfixFontSize": "50%",
"prefix": "",
"prefixFontSize": "50%",
"rangeMaps": [
{
"from": "null",
"text": "N/A",
"to": "null"
}
],
"sparkline": {
"fillColor": "rgba(31, 118, 189, 0.18)",
"full": false,
"lineColor": "rgb(31, 120, 193)",
"show": false
},
"tableColumn": "",
"targets": [
{
"expr": "sum(rate(http_server_requests_seconds_sum{instance=~'$instance'}[1m]))/sum(rate(http_server_requests_seconds_count{instance=~'$instance'}[1m])) * 1000",
"format": "time_series",
"intervalFactor": 1,
"legendFormat": "",
"refId": "A"
}
],
"thresholds": "3000,5000",
"title": "rt",
"type": "singlestat",
"valueFontSize": "80%",
"valueMaps": [
{
"op": "=",
"text": "N/A",
"value": "null"
}
],
"valueName": "current"
},
{
"cacheTimeout": null,
"colorBackground": false,
"colorPrefix": false,
"colorValue": false,
"colors": [
"#299c46",
"rgba(237, 129, 40, 0.89)",
"#d44a3a"
],
"datasource": "prometheus",
"decimals": null,
"format": "none",
"gauge": {
"maxValue": 2000,
"minValue": 0,
"show": true,
"thresholdLabels": false,
"thresholdMarkers": true
},
"gridPos": {
"h": 4,
"w": 9,
"x": 0,
"y": 16
},
"id": 25,
"interval": null,
"links": [],
"mappingType": 1,
"mappingTypes": [
{
"name": "value to text",
"value": 1
},
{
"name": "range to text",
"value": 2
}
],
"maxDataPoints": 100,
"nullPointMode": "connected",
"nullText": null,
"postfix": "",
"postfixFontSize": "50%",
"prefix": "",
"prefixFontSize": "50%",
"rangeMaps": [
{
"from": "null",
"text": "N/A",
"to": "null"
}
],
"sparkline": {
"fillColor": "rgba(31, 118, 189, 0.18)",
"full": false,
"lineColor": "rgb(31, 120, 193)",
"show": false
},
"tableColumn": "",
"targets": [
{
"expr": "sum(rate(http_server_requests_seconds_count{instance=~'$instance'}[1m]))",
"format": "time_series",
"intervalFactor": 1,
"legendFormat": "",
"refId": "A"
}
],
"thresholds": "1000,2000",
"title": "qps",
"type": "singlestat",
"valueFontSize": "70%",
"valueMaps": [
{
"op": "=",
"text": "N/A",
"value": "null"
}
],
"valueName": "current"
},
{
"cacheTimeout": null,
"colorBackground": false,
"colorPrefix": false,
"colorValue": false,
"colors": [
"#299c46",
"rgba(237, 129, 40, 0.89)",
"#d44a3a"
],
"datasource": "prometheus",
"decimals": null,
"format": "none",
"gauge": {
"maxValue": 5000,
"minValue": 0,
"show": true,
"thresholdLabels": false,
"thresholdMarkers": true
},
"gridPos": {
"h": 4,
"w": 9,
"x": 9,
"y": 16
},
"id": 70,
"interval": null,
"links": [],
"mappingType": 1,
"mappingTypes": [
{
"name": "value to text",
"value": 1
},
{
"name": "range to text",
"value": 2
}
],
"maxDataPoints": 100,
"nullPointMode": "connected",
"nullText": null,
"postfix": "ms",
"postfixFontSize": "50%",
"prefix": "",
"prefixFontSize": "50%",
"rangeMaps": [
{
"from": "null",
"text": "N/A",
"to": "null"
}
],
"sparkline": {
"fillColor": "rgba(31, 118, 189, 0.18)",
"full": false,
"lineColor": "rgb(31, 120, 193)",
"show": false
},
"tableColumn": "",
"targets": [
{
"expr": "max(nacos_monitor{name='avgPushCost', instance=~'$instance'})",
"format": "time_series",
"intervalFactor": 1,
"refId": "A"
}
],
"thresholds": "1000,5000",
"title": "avgPushCost",
"type": "singlestat",
"valueFontSize": "70%",
"valueMaps": [
{
"op": "=",
"text": "N/A",
"value": "null"
}
],
"valueName": "current"
},
{
"collapsed": false,
"gridPos": {
"h": 1,
"w": 24,
"x": 0,
"y": 20
},
"id": 78,
"panels": [],
"title": "nacos detail",
"type": "row"
},
{
"aliasColors": {},
"bars": false,
"dashLength": 10,
"dashes": false,
"datasource": "prometheus",
"fill": 1,
"gridPos": {
"h": 5,
"w": 8,
"x": 0,
"y": 21
},
"id": 20,
"legend": {
"avg": false,
"current": false,
"max": false,
"min": false,
"show": true,
"total": false,
"values": false
},
"lines": true,
"linewidth": 1,
"links": [],
"nullPointMode": "null",
"percentage": false,
"pointradius": 5,
"points": false,
"renderer": "flot",
"seriesOverrides": [],
"spaceLength": 10,
"stack": false,
"steppedLine": false,
"targets": [
{
"expr": "sum(rate(http_server_requests_seconds_sum{uri=~'/v1/cs/configs|/nacos/v1/ns', instance=~'$instance'}[1m])/rate(http_server_requests_seconds_count{uri=~'/v1/cs/configs|/nacos/v1/ns/instance|/nacos/v1/ns/health', instance=~'$instance'}[1m])) by (method,uri) * 1000",
"format": "time_series",
"intervalFactor": 1,
"refId": "A"
},
{
"expr": "sum(rate(http_server_requests_seconds_sum{instance=~'$instance'}[1m]))/sum(rate(http_server_requests_seconds_count{instance=~'$instance'}[1m])) * 1000",
"format": "time_series",
"hide": false,
"intervalFactor": 1,
"legendFormat": "all",
"refId": "B"
}
],
"thresholds": [],
"timeFrom": null,
"timeRegions": [],
"timeShift": null,
"title": "rt",
"tooltip": {
"shared": true,
"sort": 0,
"value_type": "individual"
},
"type": "graph",
"xaxis": {
"buckets": null,
"mode": "time",
"name": null,
"show": true,
"values": []
},
"yaxes": [
{
"format": "short",
"label": null,
"logBase": 1,
"max": null,
"min": null,
"show": true
},
{
"format": "short",
"label": null,
"logBase": 1,
"max": null,
"min": null,
"show": true
}
],
"yaxis": {
"align": false,
"alignLevel": null
}
},
{
"aliasColors": {},
"bars": false,
"dashLength": 10,
"dashes": false,
"datasource": "prometheus",
"fill": 1,
"gridPos": {
"h": 5,
"w": 8,
"x": 8,
"y": 21
},
"id": 41,
"legend": {
"avg": false,
"current": false,
"max": false,
"min": false,
"show": true,
"total": false,
"values": false
},
"lines": true,
"linewidth": 1,
"links": [],
"nullPointMode": "null",
"percentage": false,
"pointradius": 5,
"points": false,
"renderer": "flot",
"repeat": "group",
"repeatDirection": "h",
"seriesOverrides": [],
"spaceLength": 10,
"stack": false,
"steppedLine": false,
"targets": [
{
"expr": "sum(nacos_monitor{name='longPolling', instance=~'$instance'})",
"format": "time_series",
"intervalFactor": 1,
"legendFormat": "",
"refId": "A"
}
],
"thresholds": [],
"timeFrom": null,
"timeRegions": [],
"timeShift": null,
"title": "long polling",
"tooltip": {
"shared": true,
"sort": 0,
"value_type": "individual"
},
"type": "graph",
"xaxis": {
"buckets": null,
"mode": "time",
"name": null,
"show": true,
"values": []
},
"yaxes": [
{
"format": "short",
"label": "",
"logBase": 1,
"max": null,
"min": null,
"show": true
},
{
"format": "short",
"label": null,
"logBase": 1,
"max": null,
"min": null,
"show": true
}
],
"yaxis": {
"align": false,
"alignLevel": null
}
},
{
"aliasColors": {},
"bars": false,
"dashLength": 10,
"dashes": false,
"datasource": "prometheus",
"fill": 1,
"gridPos": {
"h": 5,
"w": 8,
"x": 16,
"y": 21
},
"id": 37,
"legend": {
"avg": false,
"current": false,
"max": false,
"min": false,
"show": true,
"total": false,
"values": false
},
"lines": true,
"linewidth": 1,
"links": [],
"nullPointMode": "null",
"percentage": false,
"pointradius": 5,
"points": false,
"renderer": "flot",
"seriesOverrides": [],
"spaceLength": 10,
"stack": false,
"steppedLine": false,
"targets": [
{
"expr": "max(system_load_average_1m{instance=~'$instance'})",
"format": "time_series",
"intervalFactor": 1,
"refId": "A"
}
],
"thresholds": [],
"timeFrom": null,
"timeRegions": [],
"timeShift": null,
"title": "load 1m",
"tooltip": {
"shared": true,
"sort": 0,
"value_type": "individual"
},
"type": "graph",
"xaxis": {
"buckets": null,
"mode": "time",
"name": null,
"show": true,
"values": []
},
"yaxes": [
{
"format": "short",
"label": null,
"logBase": 1,
"max": null,
"min": null,
"show": true
},
{
"format": "short",
"label": null,
"logBase": 1,
"max": null,
"min": null,
"show": true
}
],
"yaxis": {
"align": false,
"alignLevel": null
}
},
{
"aliasColors": {},
"bars": false,
"dashLength": 10,
"dashes": false,
"datasource": "prometheus",
"fill": 1,
"gridPos": {
"h": 5,
"w": 8,
"x": 0,
"y": 26
},
"id": 18,
"legend": {
"avg": false,
"current": false,
"max": false,
"min": false,
"show": true,
"total": false,
"values": false
},
"lines": true,
"linewidth": 1,
"links": [],
"nullPointMode": "null",
"percentage": false,
"pointradius": 5,
"points": false,
"renderer": "flot",
"seriesOverrides": [],
"spaceLength": 10,
"stack": false,
"steppedLine": false,
"targets": [
{
"expr": "sum(rate(http_server_requests_seconds_count{uri=~'/v1/cs/configs|/nacos/v1/ns/instance|/nacos/v1/ns/health', instance=~'$instance'}[1m])) by (method,uri)",
"format": "time_series",
"intervalFactor": 1,
"refId": "A"
},
{
"expr": "sum(rate(http_server_requests_seconds_count[1m]))",
"format": "time_series",
"intervalFactor": 1,
"refId": "B"
}
],
"thresholds": [],
"timeFrom": null,
"timeRegions": [],
"timeShift": null,
"title": "qps",
"tooltip": {
"shared": true,
"sort": 0,
"value_type": "individual"
},
"transparent": false,
"type": "graph",
"xaxis": {
"buckets": null,
"mode": "time",
"name": null,
"show": true,
"values": []
},
"yaxes": [
{
"format": "short",
"label": null,
"logBase": 1,
"max": null,
"min": null,
"show": true
},
{
"format": "short",
"label": null,
"logBase": 1,
"max": null,
"min": null,
"show": true
}
],
"yaxis": {
"align": false,
"alignLevel": null
}
},
{
"aliasColors": {},
"bars": false,
"dashLength": 10,
"dashes": false,
"datasource": "prometheus",
"fill": 1,
"gridPos": {
"h": 5,
"w": 8,
"x": 8,
"y": 26
},
"id": 52,
"legend": {
"avg": false,
"current": false,
"max": false,
"min": false,
"show": true,
"total": false,
"values": false
},
"lines": true,
"linewidth": 1,
"links": [],
"nullPointMode": "null",
"percentage": false,
"pointradius": 5,
"points": false,
"renderer": "flot",
"seriesOverrides": [],
"spaceLength": 10,
"stack": false,
"steppedLine": false,
"targets": [
{
"expr": "sum(nacos_monitor{name='leaderStatus', instance=~'$instance'})",
"format": "time_series",
"intervalFactor": 1,
"refId": "B"
}
],
"thresholds": [],
"timeFrom": null,
"timeRegions": [],
"timeShift": null,
"title": "leaderStatus",
"tooltip": {
"shared": true,
"sort": 0,
"value_type": "individual"
},
"type": "graph",
"xaxis": {
"buckets": null,
"mode": "time",
"name": null,
"show": true,
"values": []
},
"yaxes": [
{
"format": "short",
"label": null,
"logBase": 1,
"max": null,
"min": null,
"show": true
},
{
"format": "short",
"label": null,
"logBase": 1,
"max": null,
"min": null,
"show": true
}
],
"yaxis": {
"align": false,
"alignLevel": null
}
},
{
"aliasColors": {},
"bars": false,
"dashLength": 10,
"dashes": false,
"datasource": "prometheus",
"fill": 1,
"gridPos": {
"h": 5,
"w": 8,
"x": 16,
"y": 26
},
"id": 50,
"legend": {
"avg": false,
"current": false,
"max": false,
"min": false,
"show": true,
"total": false,
"values": false
},
"lines": true,
"linewidth": 1,
"links": [],
"nullPointMode": "null",
"percentage": false,
"pointradius": 5,
"points": false,
"renderer": "flot",
"seriesOverrides": [],
"spaceLength": 10,
"stack": false,
"steppedLine": false,
"targets": [
{
"expr": "sum(nacos_monitor{name='avgPushCost', instance=~'$instance'})",
"format": "time_series",
"intervalFactor": 1,
"refId": "A"
}
],
"thresholds": [],
"timeFrom": null,
"timeRegions": [],
"timeShift": null,
"title": "avgPushCost",
"tooltip": {
"shared": true,
"sort": 0,
"value_type": "individual"
},
"type": "graph",
"xaxis": {
"buckets": null,
"mode": "time",
"name": null,
"show": true,
"values": []
},
"yaxes": [
{
"format": "short",
"label": null,
"logBase": 1,
"max": null,
"min": null,
"show": true
},
{
"format": "short",
"label": null,
"logBase": 1,
"max": null,
"min": null,
"show": true
}
],
"yaxis": {
"align": false,
"alignLevel": null
}
},
{
"aliasColors": {},
"bars": false,
"dashLength": 10,
"dashes": false,
"datasource": "prometheus",
"fill": 1,
"gridPos": {
"h": 5,
"w": 8,
"x": 0,
"y": 31
},
"id": 53,
"legend": {
"avg": false,
"current": false,
"max": false,
"min": false,
"show": true,
"total": false,
"values": false
},
"lines": true,
"linewidth": 1,
"links": [],
"nullPointMode": "null",
"percentage": false,
"pointradius": 5,
"points": false,
"renderer": "flot",
"seriesOverrides": [],
"spaceLength": 10,
"stack": false,
"steppedLine": false,
"targets": [
{
"expr": "max(nacos_monitor{name='maxPushCost', instance=~'$instance'})",
"format": "time_series",
"intervalFactor": 1,
"refId": "A"
}
],
"thresholds": [],
"timeFrom": null,
"timeRegions": [],
"timeShift": null,
"title": "maxPushCost",
"tooltip": {
"shared": true,
"sort": 0,
"value_type": "individual"
},
"type": "graph",
"xaxis": {
"buckets": null,
"mode": "time",
"name": null,
"show": true,
"values": []
},
"yaxes": [
{
"format": "short",
"label": null,
"logBase": 1,
"max": null,
"min": null,
"show": true
},
{
"format": "short",
"label": null,
"logBase": 1,
"max": null,
"min": null,
"show": true
}
],
"yaxis": {
"align": false,
"alignLevel": null
}
},
{
"aliasColors": {},
"bars": false,
"dashLength": 10,
"dashes": false,
"datasource": "prometheus",
"fill": 1,
"gridPos": {
"h": 5,
"w": 8,
"x": 8,
"y": 31
},
"id": 83,
"legend": {
"avg": false,
"current": false,
"max": false,
"min": false,
"show": true,
"total": false,
"values": false
},
"lines": true,
"linewidth": 1,
"links": [],
"nullPointMode": "null",
"percentage": false,
"pointradius": 5,
"points": false,
"renderer": "flot",
"seriesOverrides": [],
"spaceLength": 10,
"stack": false,
"steppedLine": false,
"targets": [
{
"expr": "sum(nacos_monitor{name='publish', instance=~'$instance'}) by (name)",
"format": "time_series",
"intervalFactor": 1,
"legendFormat": "publish config",
"refId": "A"
},
{
"expr": "sum(nacos_monitor{name='getConfig', instance=~'$instance'}) by (name)",
"format": "time_series",
"intervalFactor": 1,
"legendFormat": "get config",
"refId": "B"
}
],
"thresholds": [],
"timeFrom": null,
"timeRegions": [],
"timeShift": null,
"title": "config statistics",
"tooltip": {
"shared": true,
"sort": 0,
"value_type": "individual"
},
"type": "graph",
"xaxis": {
"buckets": null,
"mode": "time",
"name": null,
"show": true,
"values": []
},
"yaxes": [
{
"format": "short",
"label": null,
"logBase": 1,
"max": null,
"min": null,
"show": true
},
{
"format": "short",
"label": null,
"logBase": 1,
"max": null,
"min": null,
"show": true
}
],
"yaxis": {
"align": false,
"alignLevel": null
}
},
{
"aliasColors": {},
"bars": false,
"dashLength": 10,
"dashes": false,
"datasource": "prometheus",
"fill": 1,
"gridPos": {
"h": 5,
"w": 8,
"x": 16,
"y": 31
},
"id": 16,
"legend": {
"avg": false,
"current": false,
"max": false,
"min": false,
"show": true,
"total": false,
"values": false
},
"lines": true,
"linewidth": 1,
"links": [],
"nullPointMode": "null",
"percentage": false,
"pointradius": 5,
"points": false,
"renderer": "flot",
"seriesOverrides": [],
"spaceLength": 10,
"stack": false,
"steppedLine": false,
"targets": [
{
"expr": "sum(rate(nacos_monitor{name=~'.*HealthCheck', instance=~'$instance'}[1m])) by (name) * 60",
"format": "time_series",
"intervalFactor": 1,
"legendFormat": "",
"refId": "A"
}
],
"thresholds": [],
"timeFrom": null,
"timeRegions": [],
"timeShift": null,
"title": "health check",
"tooltip": {
"shared": true,
"sort": 0,
"value_type": "individual"
},
"type": "graph",
"xaxis": {
"buckets": null,
"mode": "time",
"name": null,
"show": true,
"values": []
},
"yaxes": [
{
"format": "short",
"label": null,
"logBase": 1,
"max": null,
"min": null,
"show": true
},
{
"format": "short",
"label": null,
"logBase": 1,
"max": null,
"min": null,
"show": true
}
],
"yaxis": {
"align": false,
"alignLevel": null
}
},
{
"collapsed": false,
"gridPos": {
"h": 1,
"w": 24,
"x": 0,
"y": 36
},
"id": 74,
"panels": [],
"title": "nacos alert",
"type": "row"
},
{
"alert": {
"conditions": [
{
"evaluator": {
"params": [
50
],
"type": "gt"
},
"operator": {
"type": "and"
},
"query": {
"params": [
"A",
"1m",
"now"
]
},
"reducer": {
"params": [],
"type": "avg"
},
"type": "query"
}
],
"executionErrorState": "keep_state",
"for": "1m",
"frequency": "1m",
"handler": 1,
"name": "cpu alert",
"noDataState": "ok",
"notifications": [
{
"id": 1
}
]
},
"aliasColors": {},
"bars": false,
"dashLength": 10,
"dashes": false,
"datasource": "prometheus",
"fill": 1,
"gridPos": {
"h": 5,
"w": 8,
"x": 0,
"y": 37
},
"id": 45,
"legend": {
"avg": false,
"current": false,
"max": false,
"min": false,
"show": true,
"total": false,
"values": false
},
"lines": true,
"linewidth": 1,
"links": [],
"nullPointMode": "null",
"percentage": false,
"pointradius": 5,
"points": false,
"renderer": "flot",
"seriesOverrides": [],
"spaceLength": 10,
"stack": false,
"steppedLine": false,
"targets": [
{
"expr": "max(system_cpu_usage) * 100",
"format": "time_series",
"intervalFactor": 1,
"refId": "A"
}
],
"thresholds": [
{
"colorMode": "critical",
"fill": true,
"line": true,
"op": "gt",
"value": 50
}
],
"timeFrom": null,
"timeRegions": [],
"timeShift": null,
"title": "cpu alert",
"tooltip": {
"shared": true,
"sort": 0,
"value_type": "individual"
},
"type": "graph",
"xaxis": {
"buckets": null,
"mode": "time",
"name": null,
"show": true,
"values": []
},
"yaxes": [
{
"format": "short",
"label": null,
"logBase": 1,
"max": null,
"min": null,
"show": true
},
{
"format": "short",
"label": null,
"logBase": 1,
"max": null,
"min": null,
"show": true
}
],
"yaxis": {
"align": false,
"alignLevel": null
}
},
{
"alert": {
"conditions": [
{
"evaluator": {
"params": [
15
],
"type": "gt"
},
"operator": {
"type": "and"
},
"query": {
"params": [
"A",
"1m",
"now"
]
},
"reducer": {
"params": [],
"type": "avg"
},
"type": "query"
}
],
"executionErrorState": "keep_state",
"frequency": "60s",
"handler": 1,
"name": "load 1m alert",
"noDataState": "ok",
"notifications": []
},
"aliasColors": {},
"bars": false,
"dashLength": 10,
"dashes": false,
"datasource": "prometheus",
"fill": 1,
"gridPos": {
"h": 5,
"w": 8,
"x": 8,
"y": 37
},
"id": 86,
"legend": {
"avg": false,
"current": false,
"max": false,
"min": false,
"show": true,
"total": false,
"values": false
},
"lines": true,
"linewidth": 1,
"links": [],
"nullPointMode": "null",
"percentage": false,
"pointradius": 5,
"points": false,
"renderer": "flot",
"seriesOverrides": [],
"spaceLength": 10,
"stack": false,
"steppedLine": false,
"targets": [
{
"expr": "max(system_load_average_1m)",
"format": "time_series",
"intervalFactor": 1,
"refId": "A"
}
],
"thresholds": [
{
"colorMode": "critical",
"fill": true,
"line": true,
"op": "gt",
"value": 15
}
],
"timeFrom": null,
"timeRegions": [],
"timeShift": null,
"title": "load alert",
"tooltip": {
"shared": true,
"sort": 0,
"value_type": "individual"
},
"type": "graph",
"xaxis": {
"buckets": null,
"mode": "time",
"name": null,
"show": true,
"values": []
},
"yaxes": [
{
"format": "short",
"label": null,
"logBase": 1,
"max": null,
"min": null,
"show": true
},
{
"format": "short",
"label": null,
"logBase": 1,
"max": null,
"min": null,
"show": true
}
],
"yaxis": {
"align": false,
"alignLevel": null
}
},
{
"alert": {
"conditions": [
{
"evaluator": {
"params": [
60
],
"type": "gt"
},
"operator": {
"type": "and"
},
"query": {
"params": [
"A",
"5m",
"now"
]
},
"reducer": {
"params": [],
"type": "avg"
},
"type": "query"
}
],
"executionErrorState": "keep_state",
"frequency": "60s",
"handler": 1,
"name": "memory alert",
"noDataState": "ok",
"notifications": []
},
"aliasColors": {},
"bars": false,
"dashLength": 10,
"dashes": false,
"datasource": "prometheus",
"fill": 1,
"gridPos": {
"h": 5,
"w": 8,
"x": 16,
"y": 37
},
"id": 46,
"legend": {
"avg": false,
"current": false,
"max": false,
"min": false,
"show": true,
"total": false,
"values": false
},
"lines": true,
"linewidth": 1,
"links": [],
"nullPointMode": "null",
"percentage": false,
"pointradius": 5,
"points": false,
"renderer": "flot",
"seriesOverrides": [],
"spaceLength": 10,
"stack": false,
"steppedLine": false,
"targets": [
{
"expr": "sum(jvm_memory_used_bytes{area=\"heap\"})/sum(jvm_memory_max_bytes{area=\"heap\"}) * 100",
"format": "time_series",
"intervalFactor": 1,
"refId": "A"
}
],
"thresholds": [
{
"colorMode": "critical",
"fill": true,
"line": true,
"op": "gt",
"value": 60
}
],
"timeFrom": null,
"timeRegions": [],
"timeShift": null,
"title": "memory alert",
"tooltip": {
"shared": true,
"sort": 0,
"value_type": "individual"
},
"type": "graph",
"xaxis": {
"buckets": null,
"mode": "time",
"name": null,
"show": true,
"values": []
},
"yaxes": [
{
"format": "short",
"label": null,
"logBase": 1,
"max": null,
"min": null,
"show": true
},
{
"format": "short",
"label": null,
"logBase": 1,
"max": null,
"min": null,
"show": true
}
],
"yaxis": {
"align": false,
"alignLevel": null
}
},
{
"alert": {
"conditions": [
{
"evaluator": {
"params": [
500
],
"type": "gt"
},
"operator": {
"type": "and"
},
"query": {
"params": [
"A",
"1m",
"now"
]
},
"reducer": {
"params": [],
"type": "avg"
},
"type": "query"
}
],
"executionErrorState": "keep_state",
"frequency": "60s",
"handler": 1,
"name": "threads alert",
"noDataState": "ok",
"notifications": []
},
"aliasColors": {},
"bars": false,
"dashLength": 10,
"dashes": false,
"datasource": "prometheus",
"fill": 1,
"gridPos": {
"h": 5,
"w": 8,
"x": 0,
"y": 42
},
"id": 39,
"legend": {
"avg": false,
"current": false,
"max": false,
"min": false,
"show": true,
"total": false,
"values": false
},
"lines": true,
"linewidth": 1,
"links": [],
"nullPointMode": "null",
"percentage": false,
"pointradius": 5,
"points": false,
"renderer": "flot",
"seriesOverrides": [],
"spaceLength": 10,
"stack": false,
"steppedLine": false,
"targets": [
{
"expr": "max(jvm_threads_daemon_threads)",
"format": "time_series",
"intervalFactor": 1,
"refId": "A"
}
],
"thresholds": [
{
"colorMode": "critical",
"fill": true,
"line": true,
"op": "gt",
"value": 500
}
],
"timeFrom": null,
"timeRegions": [],
"timeShift": null,
"title": "threads alert",
"tooltip": {
"shared": true,
"sort": 0,
"value_type": "individual"
},
"type": "graph",
"xaxis": {
"buckets": null,
"mode": "time",
"name": null,
"show": true,
"values": []
},
"yaxes": [
{
"format": "short",
"label": null,
"logBase": 1,
"max": null,
"min": null,
"show": true
},
{
"format": "short",
"label": null,
"logBase": 1,
"max": null,
"min": null,
"show": true
}
],
"yaxis": {
"align": false,
"alignLevel": null
}
},
{
"alert": {
"conditions": [
{
"evaluator": {
"params": [
5
],
"type": "gt"
},
"operator": {
"type": "and"
},
"query": {
"params": [
"A",
"1m",
"now"
]
},
"reducer": {
"params": [],
"type": "avg"
},
"type": "query"
}
],
"executionErrorState": "keep_state",
"for": "1m",
"frequency": "1m",
"handler": 1,
"message": "too many full gc",
"name": "gc alert",
"noDataState": "ok",
"notifications": [
{
"id": 1
}
]
},
"aliasColors": {},
"bars": false,
"dashLength": 10,
"dashes": false,
"datasource": "prometheus",
"fill": 1,
"gridPos": {
"h": 5,
"w": 8,
"x": 8,
"y": 42
},
"id": 38,
"legend": {
"avg": false,
"current": false,
"max": false,
"min": false,
"show": true,
"total": false,
"values": false
},
"lines": true,
"linewidth": 1,
"links": [],
"nullPointMode": "null",
"percentage": false,
"pointradius": 5,
"points": false,
"renderer": "flot",
"seriesOverrides": [],
"spaceLength": 10,
"stack": false,
"steppedLine": false,
"targets": [
{
"expr": "max(rate(jvm_gc_pause_seconds_count{action=\"end of major GC\"}[5m])) * 300",
"format": "time_series",
"intervalFactor": 1,
"refId": "A"
}
],
"thresholds": [
{
"colorMode": "critical",
"fill": true,
"line": true,
"op": "gt",
"value": 5
}
],
"timeFrom": null,
"timeRegions": [],
"timeShift": null,
"title": "gc alert",
"tooltip": {
"shared": true,
"sort": 0,
"value_type": "individual"
},
"type": "graph",
"xaxis": {
"buckets": null,
"mode": "time",
"name": null,
"show": true,
"values": []
},
"yaxes": [
{
"format": "short",
"label": null,
"logBase": 1,
"max": null,
"min": null,
"show": true
},
{
"format": "short",
"label": null,
"logBase": 1,
"max": null,
"min": null,
"show": true
}
],
"yaxis": {
"align": false,
"alignLevel": null
}
},
{
"alert": {
"conditions": [
{
"evaluator": {
"params": [
10
],
"type": "gt"
},
"operator": {
"type": "and"
},
"query": {
"params": [
"A",
"1m",
"now"
]
},
"reducer": {
"params": [],
"type": "avg"
},
"type": "query"
}
],
"executionErrorState": "keep_state",
"frequency": "60s",
"handler": 1,
"name": "notify task alert",
"noDataState": "ok",
"notifications": []
},
"aliasColors": {},
"bars": false,
"dashLength": 10,
"dashes": false,
"datasource": "prometheus",
"fill": 1,
"gridPos": {
"h": 5,
"w": 8,
"x": 16,
"y": 42
},
"id": 49,
"legend": {
"avg": false,
"current": false,
"max": false,
"min": false,
"show": true,
"total": false,
"values": false
},
"lines": true,
"linewidth": 1,
"links": [],
"nullPointMode": "null",
"percentage": false,
"pointradius": 5,
"points": false,
"renderer": "flot",
"seriesOverrides": [],
"spaceLength": 10,
"stack": false,
"steppedLine": false,
"targets": [
{
"expr": "sum(nacos_monitor{name='notifyTask'})",
"format": "time_series",
"intervalFactor": 1,
"refId": "A"
}
],
"thresholds": [
{
"colorMode": "critical",
"fill": true,
"line": true,
"op": "gt",
"value": 10
}
],
"timeFrom": null,
"timeRegions": [],
"timeShift": null,
"title": "notify task alert",
"tooltip": {
"shared": true,
"sort": 0,
"value_type": "individual"
},
"type": "graph",
"xaxis": {
"buckets": null,
"mode": "time",
"name": null,
"show": true,
"values": []
},
"yaxes": [
{
"format": "short",
"label": null,
"logBase": 1,
"max": null,
"min": null,
"show": true
},
{
"format": "short",
"label": null,
"logBase": 1,
"max": null,
"min": null,
"show": true
}
],
"yaxis": {
"align": false,
"alignLevel": null
}
},
{
"alert": {
"conditions": [
{
"evaluator": {
"params": [
5000
],
"type": "gt"
},
"operator": {
"type": "and"
},
"query": {
"params": [
"B",
"1m",
"now"
]
},
"reducer": {
"params": [],
"type": "avg"
},
"type": "query"
}
],
"executionErrorState": "keep_state",
"frequency": "60s",
"handler": 1,
"name": "rt alert",
"noDataState": "ok",
"notifications": []
},
"aliasColors": {},
"bars": false,
"dashLength": 10,
"dashes": false,
"datasource": "prometheus",
"fill": 1,
"gridPos": {
"h": 5,
"w": 8,
"x": 0,
"y": 47
},
"id": 85,
"legend": {
"avg": false,
"current": false,
"max": false,
"min": false,
"show": true,
"total": false,
"values": false
},
"lines": true,
"linewidth": 1,
"links": [],
"nullPointMode": "null",
"percentage": false,
"pointradius": 5,
"points": false,
"renderer": "flot",
"seriesOverrides": [],
"spaceLength": 10,
"stack": false,
"steppedLine": false,
"targets": [
{
"expr": "sum(rate(http_server_requests_seconds_sum[1m]))/sum(rate(http_server_requests_seconds_count[1m])) * 1000",
"format": "time_series",
"hide": false,
"intervalFactor": 1,
"refId": "B"
}
],
"thresholds": [
{
"colorMode": "critical",
"fill": true,
"line": true,
"op": "gt",
"value": 5000
}
],
"timeFrom": null,
"timeRegions": [],
"timeShift": null,
"title": "rt alert",
"tooltip": {
"shared": true,
"sort": 0,
"value_type": "individual"
},
"type": "graph",
"xaxis": {
"buckets": null,
"mode": "time",
"name": null,
"show": true,
"values": []
},
"yaxes": [
{
"format": "short",
"label": null,
"logBase": 1,
"max": null,
"min": null,
"show": true
},
{
"format": "short",
"label": null,
"logBase": 1,
"max": null,
"min": null,
"show": true
}
],
"yaxis": {
"align": false,
"alignLevel": null
}
},
{
"alert": {
"conditions": [
{
"evaluator": {
"params": [
5000
],
"type": "gt"
},
"operator": {
"type": "and"
},
"query": {
"params": [
"A",
"1m",
"now"
]
},
"reducer": {
"params": [],
"type": "avg"
},
"type": "query"
}
],
"executionErrorState": "keep_state",
"frequency": "60s",
"handler": 1,
"name": "long polling alert",
"noDataState": "ok",
"notifications": []
},
"aliasColors": {},
"bars": false,
"dashLength": 10,
"dashes": false,
"datasource": "prometheus",
"fill": 1,
"gridPos": {
"h": 5,
"w": 8,
"x": 8,
"y": 47
},
"id": 84,
"legend": {
"avg": false,
"current": false,
"max": false,
"min": false,
"show": true,
"total": false,
"values": false
},
"lines": true,
"linewidth": 1,
"links": [],
"nullPointMode": "null",
"percentage": false,
"pointradius": 5,
"points": false,
"renderer": "flot",
"repeatDirection": "h",
"seriesOverrides": [],
"spaceLength": 10,
"stack": false,
"steppedLine": false,
"targets": [
{
"expr": "max(nacos_monitor{name='longPolling'})",
"format": "time_series",
"intervalFactor": 1,
"legendFormat": "",
"refId": "A"
}
],
"thresholds": [
{
"colorMode": "critical",
"fill": true,
"line": true,
"op": "gt",
"value": 5000
}
],
"timeFrom": null,
"timeRegions": [],
"timeShift": null,
"title": "long polling alert",
"tooltip": {
"shared": true,
"sort": 0,
"value_type": "individual"
},
"type": "graph",
"xaxis": {
"buckets": null,
"mode": "time",
"name": null,
"show": true,
"values": []
},
"yaxes": [
{
"format": "short",
"label": "",
"logBase": 1,
"max": null,
"min": null,
"show": true
},
{
"format": "short",
"label": null,
"logBase": 1,
"max": null,
"min": null,
"show": true
}
],
"yaxis": {
"align": false,
"alignLevel": null
}
},
{
"alert": {
"conditions": [
{
"evaluator": {
"params": [
1
],
"type": "gt"
},
"operator": {
"type": "and"
},
"query": {
"params": [
"A",
"1m",
"now"
]
},
"reducer": {
"params": [],
"type": "avg"
},
"type": "query"
}
],
"executionErrorState": "keep_state",
"frequency": "60s",
"handler": 1,
"name": "config unhealth exception alert",
"noDataState": "ok",
"notifications": []
},
"aliasColors": {},
"bars": false,
"dashLength": 10,
"dashes": false,
"datasource": "prometheus",
"fill": 1,
"gridPos": {
"h": 5,
"w": 8,
"x": 16,
"y": 47
},
"id": 56,
"legend": {
"avg": false,
"current": false,
"max": false,
"min": false,
"show": true,
"total": false,
"values": false
},
"lines": true,
"linewidth": 1,
"links": [],
"nullPointMode": "null",
"percentage": false,
"pointradius": 5,
"points": false,
"renderer": "flot",
"seriesOverrides": [],
"spaceLength": 10,
"stack": false,
"steppedLine": false,
"targets": [
{
"expr": "sum(rate(nacos_exception_total{name='unhealth'}[1m])) * 60",
"format": "time_series",
"intervalFactor": 1,
"refId": "A"
}
],
"thresholds": [
{
"colorMode": "critical",
"fill": true,
"line": true,
"op": "gt",
"value": 1
}
],
"timeFrom": null,
"timeRegions": [],
"timeShift": null,
"title": "config unhealth exception alert",
"tooltip": {
"shared": true,
"sort": 0,
"value_type": "individual"
},
"type": "graph",
"xaxis": {
"buckets": null,
"mode": "time",
"name": null,
"show": true,
"values": []
},
"yaxes": [
{
"format": "short",
"label": null,
"logBase": 1,
"max": null,
"min": null,
"show": true
},
{
"format": "short",
"label": null,
"logBase": 1,
"max": null,
"min": null,
"show": true
}
],
"yaxis": {
"align": false,
"alignLevel": null
}
},
{
"alert": {
"conditions": [
{
"evaluator": {
"params": [
1
],
"type": "gt"
},
"operator": {
"type": "and"
},
"query": {
"params": [
"A",
"1m",
"now"
]
},
"reducer": {
"params": [],
"type": "avg"
},
"type": "query"
}
],
"executionErrorState": "keep_state",
"frequency": "60s",
"handler": 1,
"name": "db exception alert",
"noDataState": "ok",
"notifications": []
},
"aliasColors": {},
"bars": false,
"dashLength": 10,
"dashes": false,
"datasource": "prometheus",
"fill": 1,
"gridPos": {
"h": 5,
"w": 8,
"x": 0,
"y": 52
},
"id": 54,
"legend": {
"avg": false,
"current": false,
"max": false,
"min": false,
"show": true,
"total": false,
"values": false
},
"lines": true,
"linewidth": 1,
"links": [],
"nullPointMode": "null",
"percentage": false,
"pointradius": 5,
"points": false,
"renderer": "flot",
"seriesOverrides": [],
"spaceLength": 10,
"stack": false,
"steppedLine": false,
"targets": [
{
"expr": "sum(rate(nacos_exception_total{name='db'}[1m])) * 60",
"format": "time_series",
"intervalFactor": 1,
"refId": "A"
}
],
"thresholds": [
{
"colorMode": "critical",
"fill": true,
"line": true,
"op": "gt",
"value": 1
}
],
"timeFrom": null,
"timeRegions": [],
"timeShift": null,
"title": "db exception alert",
"tooltip": {
"shared": true,
"sort": 0,
"value_type": "individual"
},
"type": "graph",
"xaxis": {
"buckets": null,
"mode": "time",
"name": null,
"show": true,
"values": []
},
"yaxes": [
{
"format": "short",
"label": null,
"logBase": 1,
"max": null,
"min": null,
"show": true
},
{
"format": "short",
"label": null,
"logBase": 1,
"max": null,
"min": null,
"show": true
}
],
"yaxis": {
"align": false,
"alignLevel": null
}
},
{
"alert": {
"conditions": [
{
"evaluator": {
"params": [
1
],
"type": "gt"
},
"operator": {
"type": "and"
},
"query": {
"params": [
"A",
"1m",
"now"
]
},
"reducer": {
"params": [],
"type": "avg"
},
"type": "query"
}
],
"executionErrorState": "keep_state",
"frequency": "60s",
"handler": 1,
"name": "failedPush alert",
"noDataState": "ok",
"notifications": []
},
"aliasColors": {},
"bars": false,
"dashLength": 10,
"dashes": false,
"datasource": "prometheus",
"fill": 1,
"gridPos": {
"h": 5,
"w": 8,
"x": 8,
"y": 52
},
"id": 51,
"legend": {
"avg": false,
"current": false,
"max": false,
"min": false,
"show": true,
"total": false,
"values": false
},
"lines": true,
"linewidth": 1,
"links": [],
"nullPointMode": "null",
"percentage": false,
"pointradius": 5,
"points": false,
"renderer": "flot",
"seriesOverrides": [],
"spaceLength": 10,
"stack": false,
"steppedLine": false,
"targets": [
{
"expr": "sum(nacos_monitor{name='failedPush'})",
"format": "time_series",
"intervalFactor": 1,
"refId": "A"
}
],
"thresholds": [
{
"colorMode": "critical",
"fill": true,
"line": true,
"op": "gt",
"value": 1
}
],
"timeFrom": null,
"timeRegions": [],
"timeShift": null,
"title": "failed push alert",
"tooltip": {
"shared": true,
"sort": 0,
"value_type": "individual"
},
"type": "graph",
"xaxis": {
"buckets": null,
"mode": "time",
"name": null,
"show": true,
"values": []
},
"yaxes": [
{
"format": "short",
"label": null,
"logBase": 1,
"max": null,
"min": null,
"show": true
},
{
"format": "short",
"label": null,
"logBase": 1,
"max": null,
"min": null,
"show": true
}
],
"yaxis": {
"align": false,
"alignLevel": null
}
},
{
"alert": {
"conditions": [
{
"evaluator": {
"params": [
1
],
"type": "gt"
},
"operator": {
"type": "and"
},
"query": {
"params": [
"A",
"1m",
"now"
]
},
"reducer": {
"params": [],
"type": "avg"
},
"type": "query"
}
],
"executionErrorState": "keep_state",
"frequency": "60s",
"handler": 1,
"name": "illegalArgument exception alert",
"noDataState": "ok",
"notifications": []
},
"aliasColors": {},
"bars": false,
"dashLength": 10,
"dashes": false,
"datasource": "prometheus",
"fill": 1,
"gridPos": {
"h": 5,
"w": 8,
"x": 16,
"y": 52
},
"id": 59,
"legend": {
"avg": false,
"current": false,
"max": false,
"min": false,
"show": true,
"total": false,
"values": false
},
"lines": true,
"linewidth": 1,
"links": [],
"nullPointMode": "null",
"percentage": false,
"pointradius": 5,
"points": false,
"renderer": "flot",
"seriesOverrides": [],
"spaceLength": 10,
"stack": false,
"steppedLine": false,
"targets": [
{
"expr": "sum(rate(nacos_exception_total{name='illegalArgument'}[1m])) * 60",
"format": "time_series",
"intervalFactor": 1,
"refId": "A"
}
],
"thresholds": [
{
"colorMode": "critical",
"fill": true,
"line": true,
"op": "gt",
"value": 1
}
],
"timeFrom": null,
"timeRegions": [],
"timeShift": null,
"title": "illegalArgument exception alert",
"tooltip": {
"shared": true,
"sort": 0,
"value_type": "individual"
},
"type": "graph",
"xaxis": {
"buckets": null,
"mode": "time",
"name": null,
"show": true,
"values": []
},
"yaxes": [
{
"format": "short",
"label": null,
"logBase": 1,
"max": null,
"min": null,
"show": true
},
{
"format": "short",
"label": null,
"logBase": 1,
"max": null,
"min": null,
"show": true
}
],
"yaxis": {
"align": false,
"alignLevel": null
}
},
{
"alert": {
"conditions": [
{
"evaluator": {
"params": [
1
],
"type": "gt"
},
"operator": {
"type": "and"
},
"query": {
"params": [
"A",
"5m",
"now"
]
},
"reducer": {
"params": [],
"type": "avg"
},
"type": "query"
}
],
"executionErrorState": "keep_state",
"frequency": "60s",
"handler": 1,
"name": "naming disk exception alert",
"noDataState": "ok",
"notifications": []
},
"aliasColors": {},
"bars": false,
"dashLength": 10,
"dashes": false,
"datasource": "prometheus",
"fill": 1,
"gridPos": {
"h": 5,
"w": 8,
"x": 0,
"y": 57
},
"id": 57,
"legend": {
"avg": false,
"current": false,
"max": false,
"min": false,
"show": true,
"total": false,
"values": false
},
"lines": true,
"linewidth": 1,
"links": [],
"nullPointMode": "null",
"percentage": false,
"pointradius": 5,
"points": false,
"renderer": "flot",
"seriesOverrides": [],
"spaceLength": 10,
"stack": false,
"steppedLine": false,
"targets": [
{
"expr": "sum(rate(nacos_exception_total{name='disk'}[1m])) * 60",
"format": "time_series",
"intervalFactor": 1,
"refId": "A"
}
],
"thresholds": [
{
"colorMode": "critical",
"fill": true,
"line": true,
"op": "gt",
"value": 1
}
],
"timeFrom": null,
"timeRegions": [],
"timeShift": null,
"title": "naming disk exception alert",
"tooltip": {
"shared": true,
"sort": 0,
"value_type": "individual"
},
"type": "graph",
"xaxis": {
"buckets": null,
"mode": "time",
"name": null,
"show": true,
"values": []
},
"yaxes": [
{
"format": "short",
"label": null,
"logBase": 1,
"max": null,
"min": null,
"show": true
},
{
"format": "short",
"label": null,
"logBase": 1,
"max": null,
"min": null,
"show": true
}
],
"yaxis": {
"align": false,
"alignLevel": null
}
},
{
"alert": {
"conditions": [
{
"evaluator": {
"params": [
1
],
"type": "gt"
},
"operator": {
"type": "and"
},
"query": {
"params": [
"A",
"1m",
"now"
]
},
"reducer": {
"params": [],
"type": "avg"
},
"type": "query"
}
],
"executionErrorState": "keep_state",
"frequency": "60s",
"handler": 1,
"name": "config notify exception alert",
"noDataState": "ok",
"notifications": []
},
"aliasColors": {},
"bars": false,
"dashLength": 10,
"dashes": false,
"datasource": "prometheus",
"fill": 1,
"gridPos": {
"h": 5,
"w": 8,
"x": 8,
"y": 57
},
"id": 55,
"legend": {
"avg": false,
"current": false,
"max": false,
"min": false,
"show": true,
"total": false,
"values": false
},
"lines": true,
"linewidth": 1,
"links": [],
"nullPointMode": "null",
"percentage": false,
"pointradius": 5,
"points": false,
"renderer": "flot",
"seriesOverrides": [],
"spaceLength": 10,
"stack": false,
"steppedLine": false,
"targets": [
{
"expr": "sum(rate(nacos_exception_total{name='configNotify'}[1m])) * 60",
"format": "time_series",
"intervalFactor": 1,
"refId": "A"
}
],
"thresholds": [
{
"colorMode": "critical",
"fill": true,
"line": true,
"op": "gt",
"value": 1
}
],
"timeFrom": null,
"timeRegions": [],
"timeShift": null,
"title": "config notify exception alert",
"tooltip": {
"shared": true,
"sort": 0,
"value_type": "individual"
},
"type": "graph",
"xaxis": {
"buckets": null,
"mode": "time",
"name": null,
"show": true,
"values": []
},
"yaxes": [
{
"format": "short",
"label": null,
"logBase": 1,
"max": null,
"min": null,
"show": true
},
{
"format": "short",
"label": null,
"logBase": 1,
"max": null,
"min": null,
"show": true
}
],
"yaxis": {
"align": false,
"alignLevel": null
}
},
{
"alert": {
"conditions": [
{
"evaluator": {
"params": [
1
],
"type": "gt"
},
"operator": {
"type": "and"
},
"query": {
"params": [
"A",
"1m",
"now"
]
},
"reducer": {
"params": [],
"type": "avg"
},
"type": "query"
}
],
"executionErrorState": "keep_state",
"frequency": "60s",
"handler": 1,
"name": "naming leader send beat failed exception alert",
"noDataState": "ok",
"notifications": []
},
"aliasColors": {},
"bars": false,
"dashLength": 10,
"dashes": false,
"datasource": "prometheus",
"fill": 1,
"gridPos": {
"h": 5,
"w": 8,
"x": 16,
"y": 57
},
"id": 58,
"legend": {
"avg": false,
"current": false,
"max": false,
"min": false,
"show": true,
"total": false,
"values": false
},
"lines": true,
"linewidth": 1,
"links": [],
"nullPointMode": "null",
"percentage": false,
"pointradius": 5,
"points": false,
"renderer": "flot",
"seriesOverrides": [],
"spaceLength": 10,
"stack": false,
"steppedLine": false,
"targets": [
{
"expr": "sum(rate(nacos_exception_total{name='leaderSendBeatFailed'}[1m])) * 60",
"format": "time_series",
"intervalFactor": 1,
"refId": "A"
}
],
"thresholds": [
{
"colorMode": "critical",
"fill": true,
"line": true,
"op": "gt",
"value": 1
}
],
"timeFrom": null,
"timeRegions": [],
"timeShift": null,
"title": "naming leader send beat failed exception alert",
"tooltip": {
"shared": true,
"sort": 0,
"value_type": "individual"
},
"type": "graph",
"xaxis": {
"buckets": null,
"mode": "time",
"name": null,
"show": true,
"values": []
},
"yaxes": [
{
"format": "short",
"label": null,
"logBase": 1,
"max": null,
"min": null,
"show": true
},
{
"format": "short",
"label": null,
"logBase": 1,
"max": null,
"min": null,
"show": true
}
],
"yaxis": {
"align": false,
"alignLevel": null
}
},
{
"alert": {
"conditions": [
{
"evaluator": {
"params": [
1
],
"type": "gt"
},
"operator": {
"type": "and"
},
"query": {
"params": [
"A",
"1m",
"now"
]
},
"reducer": {
"params": [],
"type": "avg"
},
"type": "query"
}
],
"executionErrorState": "keep_state",
"frequency": "60s",
"handler": 1,
"name": "nacos_exception alert",
"noDataState": "ok",
"notifications": []
},
"aliasColors": {},
"bars": false,
"dashLength": 10,
"dashes": false,
"datasource": "prometheus",
"fill": 1,
"gridPos": {
"h": 5,
"w": 8,
"x": 0,
"y": 62
},
"id": 60,
"legend": {
"avg": false,
"current": false,
"max": false,
"min": false,
"show": true,
"total": false,
"values": false
},
"lines": true,
"linewidth": 1,
"links": [],
"nullPointMode": "null",
"percentage": false,
"pointradius": 5,
"points": false,
"renderer": "flot",
"seriesOverrides": [],
"spaceLength": 10,
"stack": false,
"steppedLine": false,
"targets": [
{
"expr": "sum(rate(nacos_exception_total{name='nacos'}[1m])) * 60",
"format": "time_series",
"intervalFactor": 1,
"refId": "A"
}
],
"thresholds": [
{
"colorMode": "critical",
"fill": true,
"line": true,
"op": "gt",
"value": 1
}
],
"timeFrom": null,
"timeRegions": [],
"timeShift": null,
"title": "nacos exception alert",
"tooltip": {
"shared": true,
"sort": 0,
"value_type": "individual"
},
"type": "graph",
"xaxis": {
"buckets": null,
"mode": "time",
"name": null,
"show": true,
"values": []
},
"yaxes": [
{
"format": "short",
"label": null,
"logBase": 1,
"max": null,
"min": null,
"show": true
},
{
"format": "short",
"label": null,
"logBase": 1,
"max": null,
"min": null,
"show": true
}
],
"yaxis": {
"align": false,
"alignLevel": null
}
}
],
"refresh": false,
"schemaVersion": 16,
"style": "dark",
"tags": [],
"templating": {
"list": [
{
"allValue": ".*:8848",
"current": {
"selected": true,
"text": "All",
"value": "$__all"
},
"datasource": "prometheus",
"definition": "label_values(instance)",
"hide": 0,
"includeAll": true,
"label": "instance",
"multi": false,
"name": "instance",
"options": [],
"query": "label_values(instance)",
"refresh": 2,
"regex": "/.*:8848/",
"skipUrlSync": false,
"sort": 0,
"tagValuesQuery": "",
"tags": [],
"tagsQuery": "",
"type": "query",
"useTags": false
}
]
},
"time": {
"from": "now-5m",
"to": "now"
},
"timepicker": {
"refresh_intervals": [
"5s",
"10s",
"30s",
"1m",
"5m",
"15m",
"30m",
"1h",
"2h",
"1d"
],
"time_options": [
"5m",
"15m",
"1h",
"6h",
"12h",
"24h",
"2d",
"7d",
"30d"
]
},
"timezone": "",
"title": "Nacos",
"uid": "Bz_QALEiz1",
"version": 38
}3.2 数据源
模板默认数据源的名称为prometheus
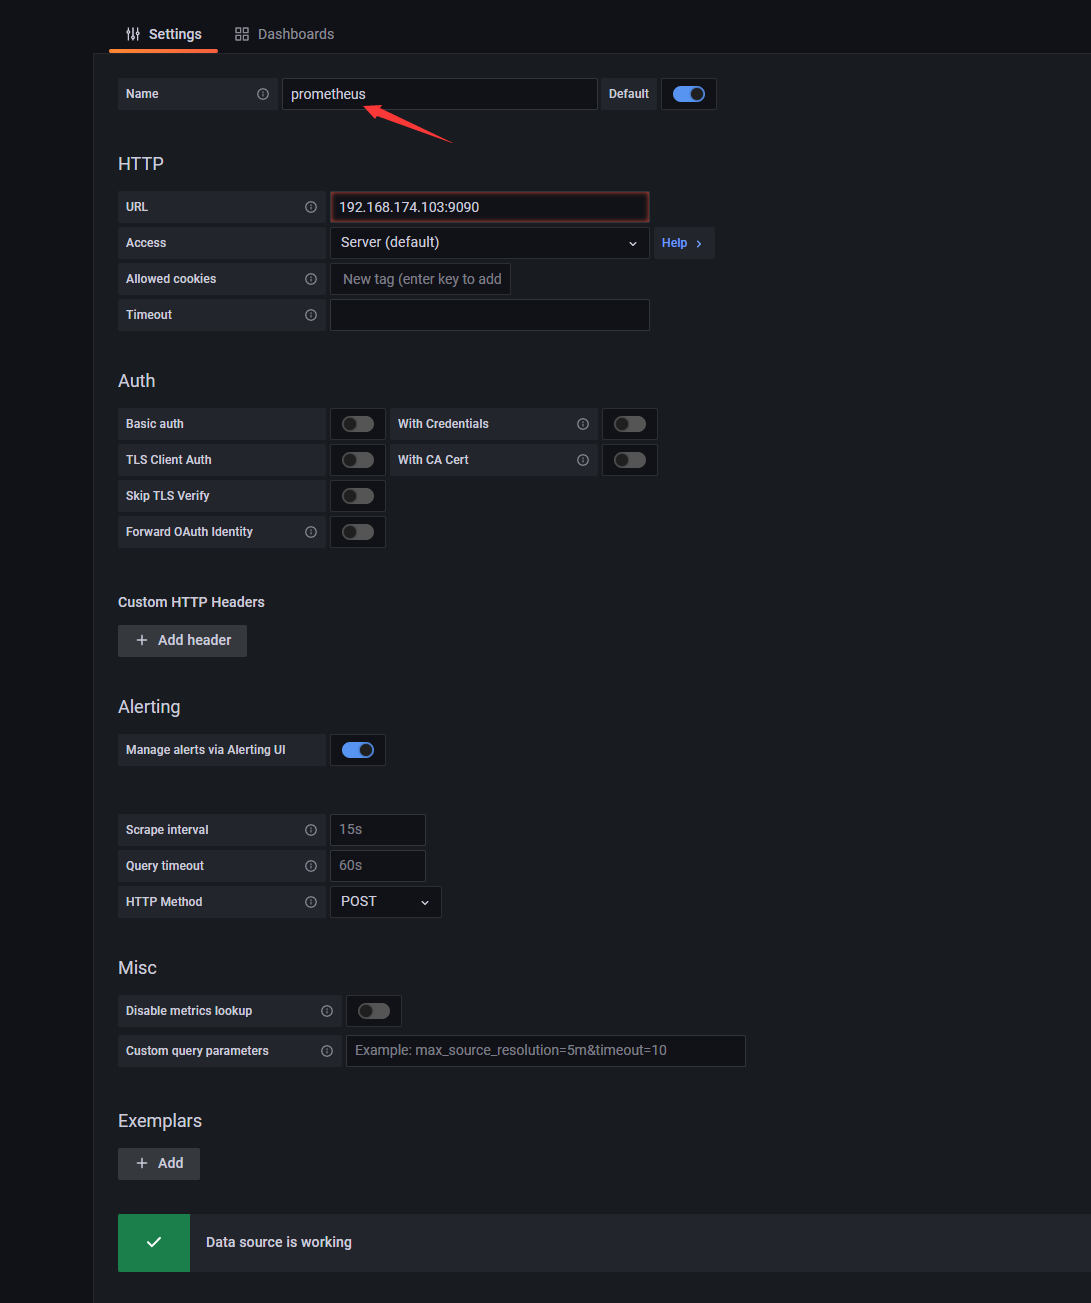
3.3 导入模板信息
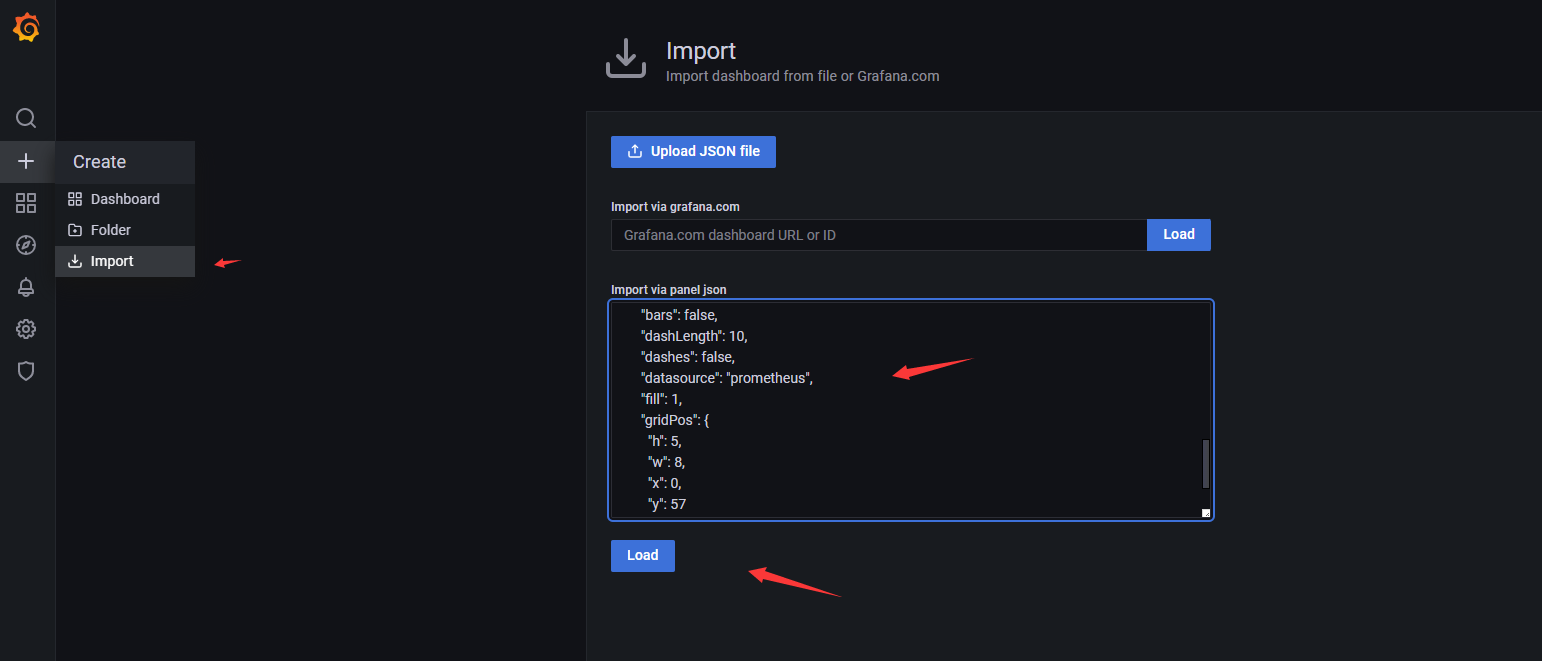
3.4 验证模板监控信息
3.4.1 nacos monitor核心监控项
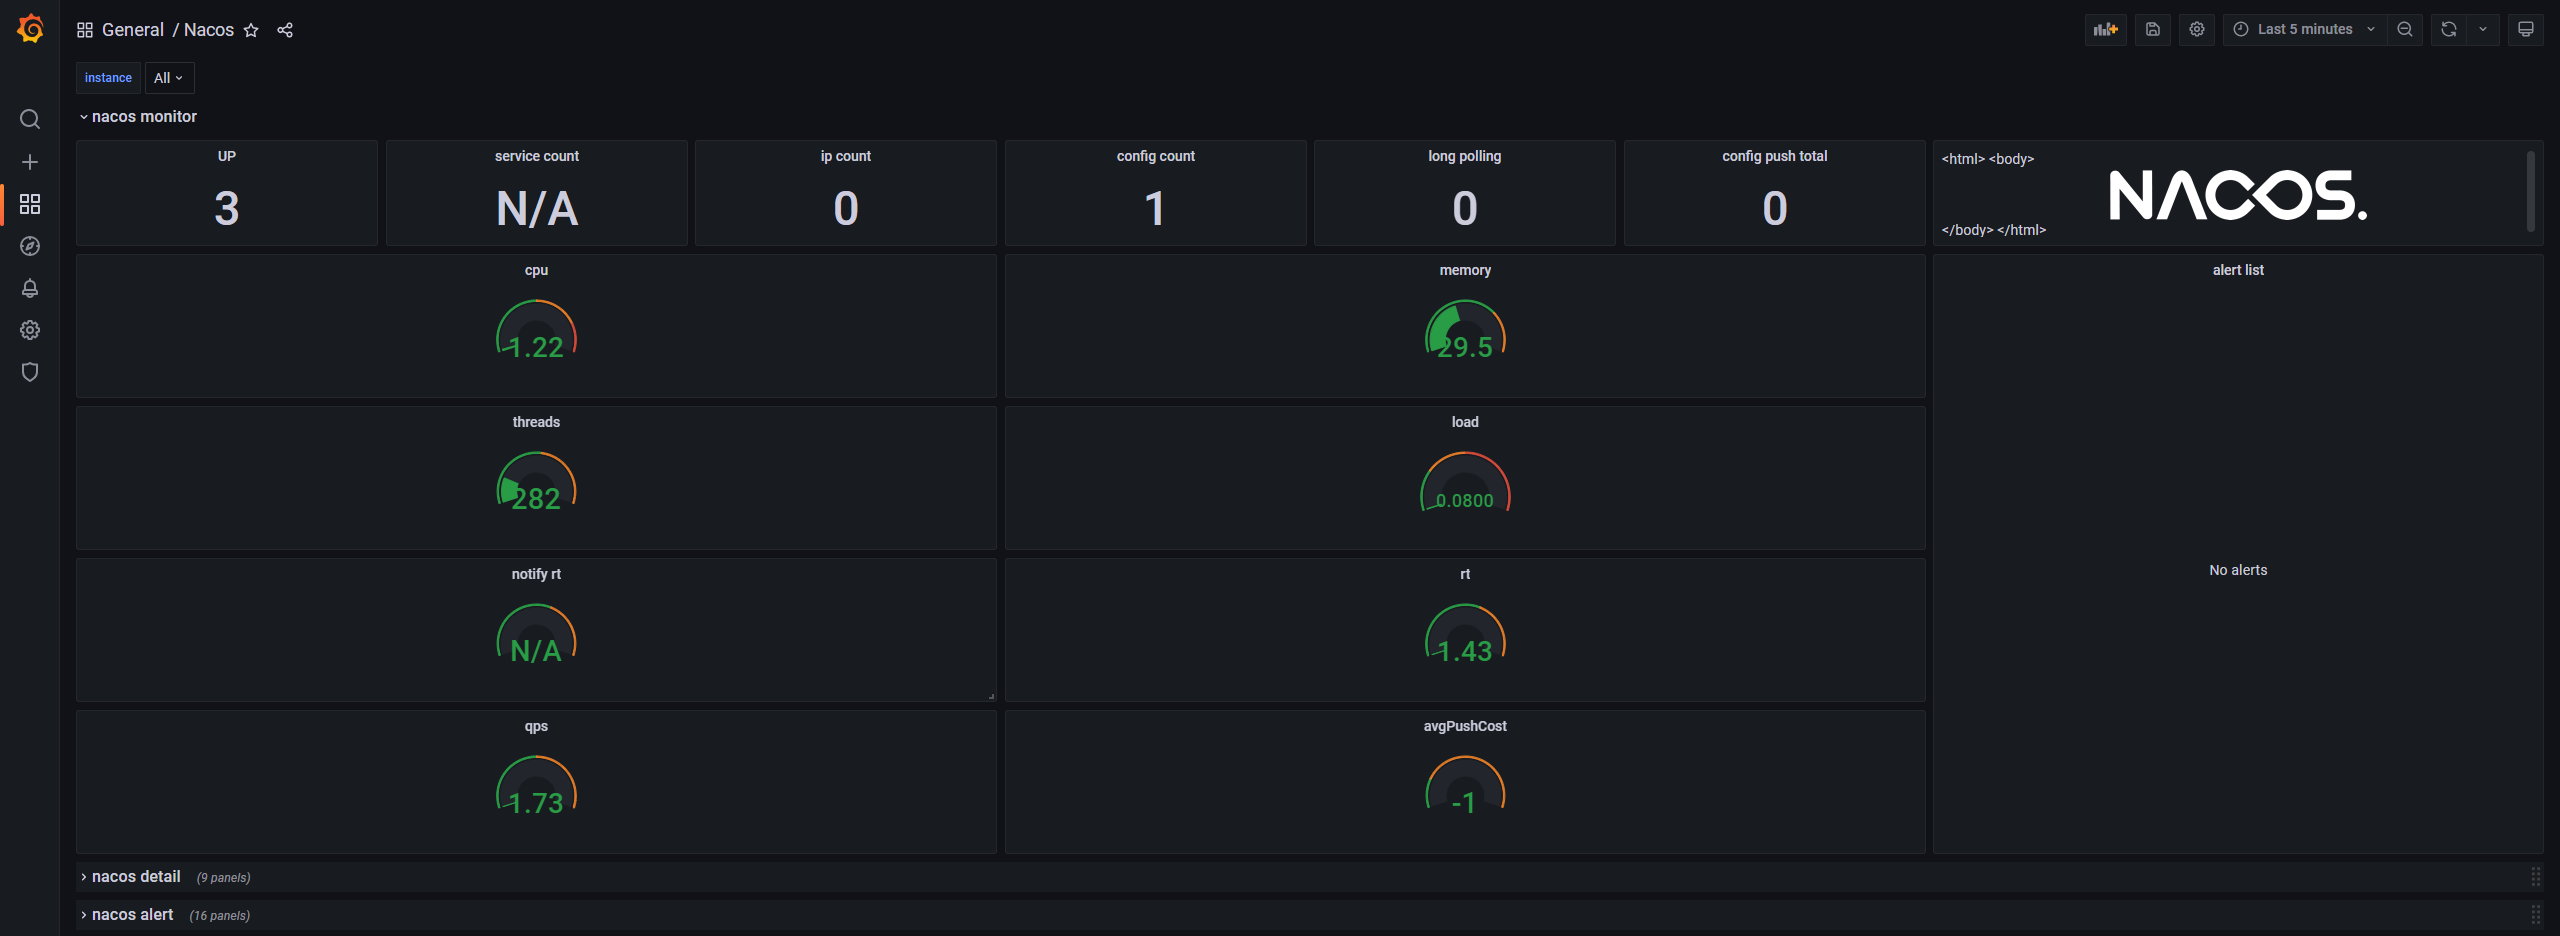
3.4.2 nacos detail展示指标的变化曲线
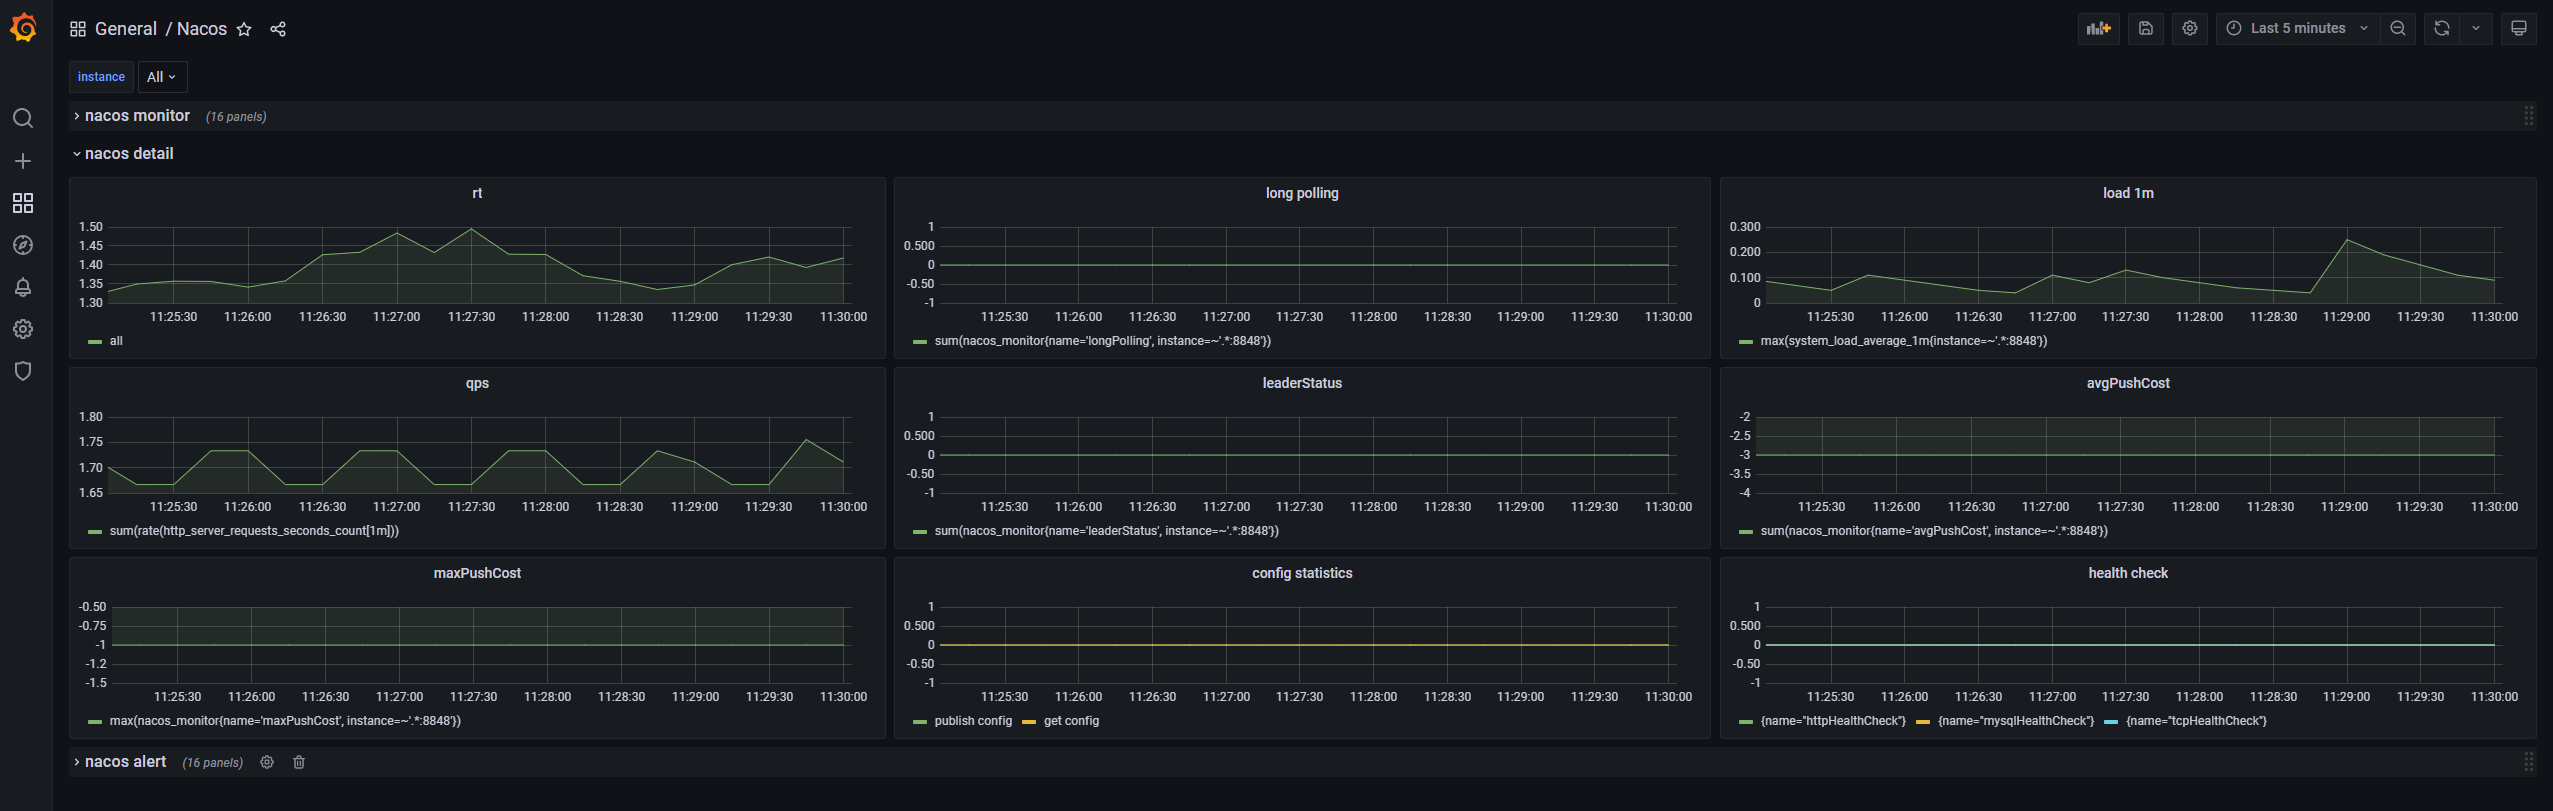
3.4.3 nacos alert 告警项
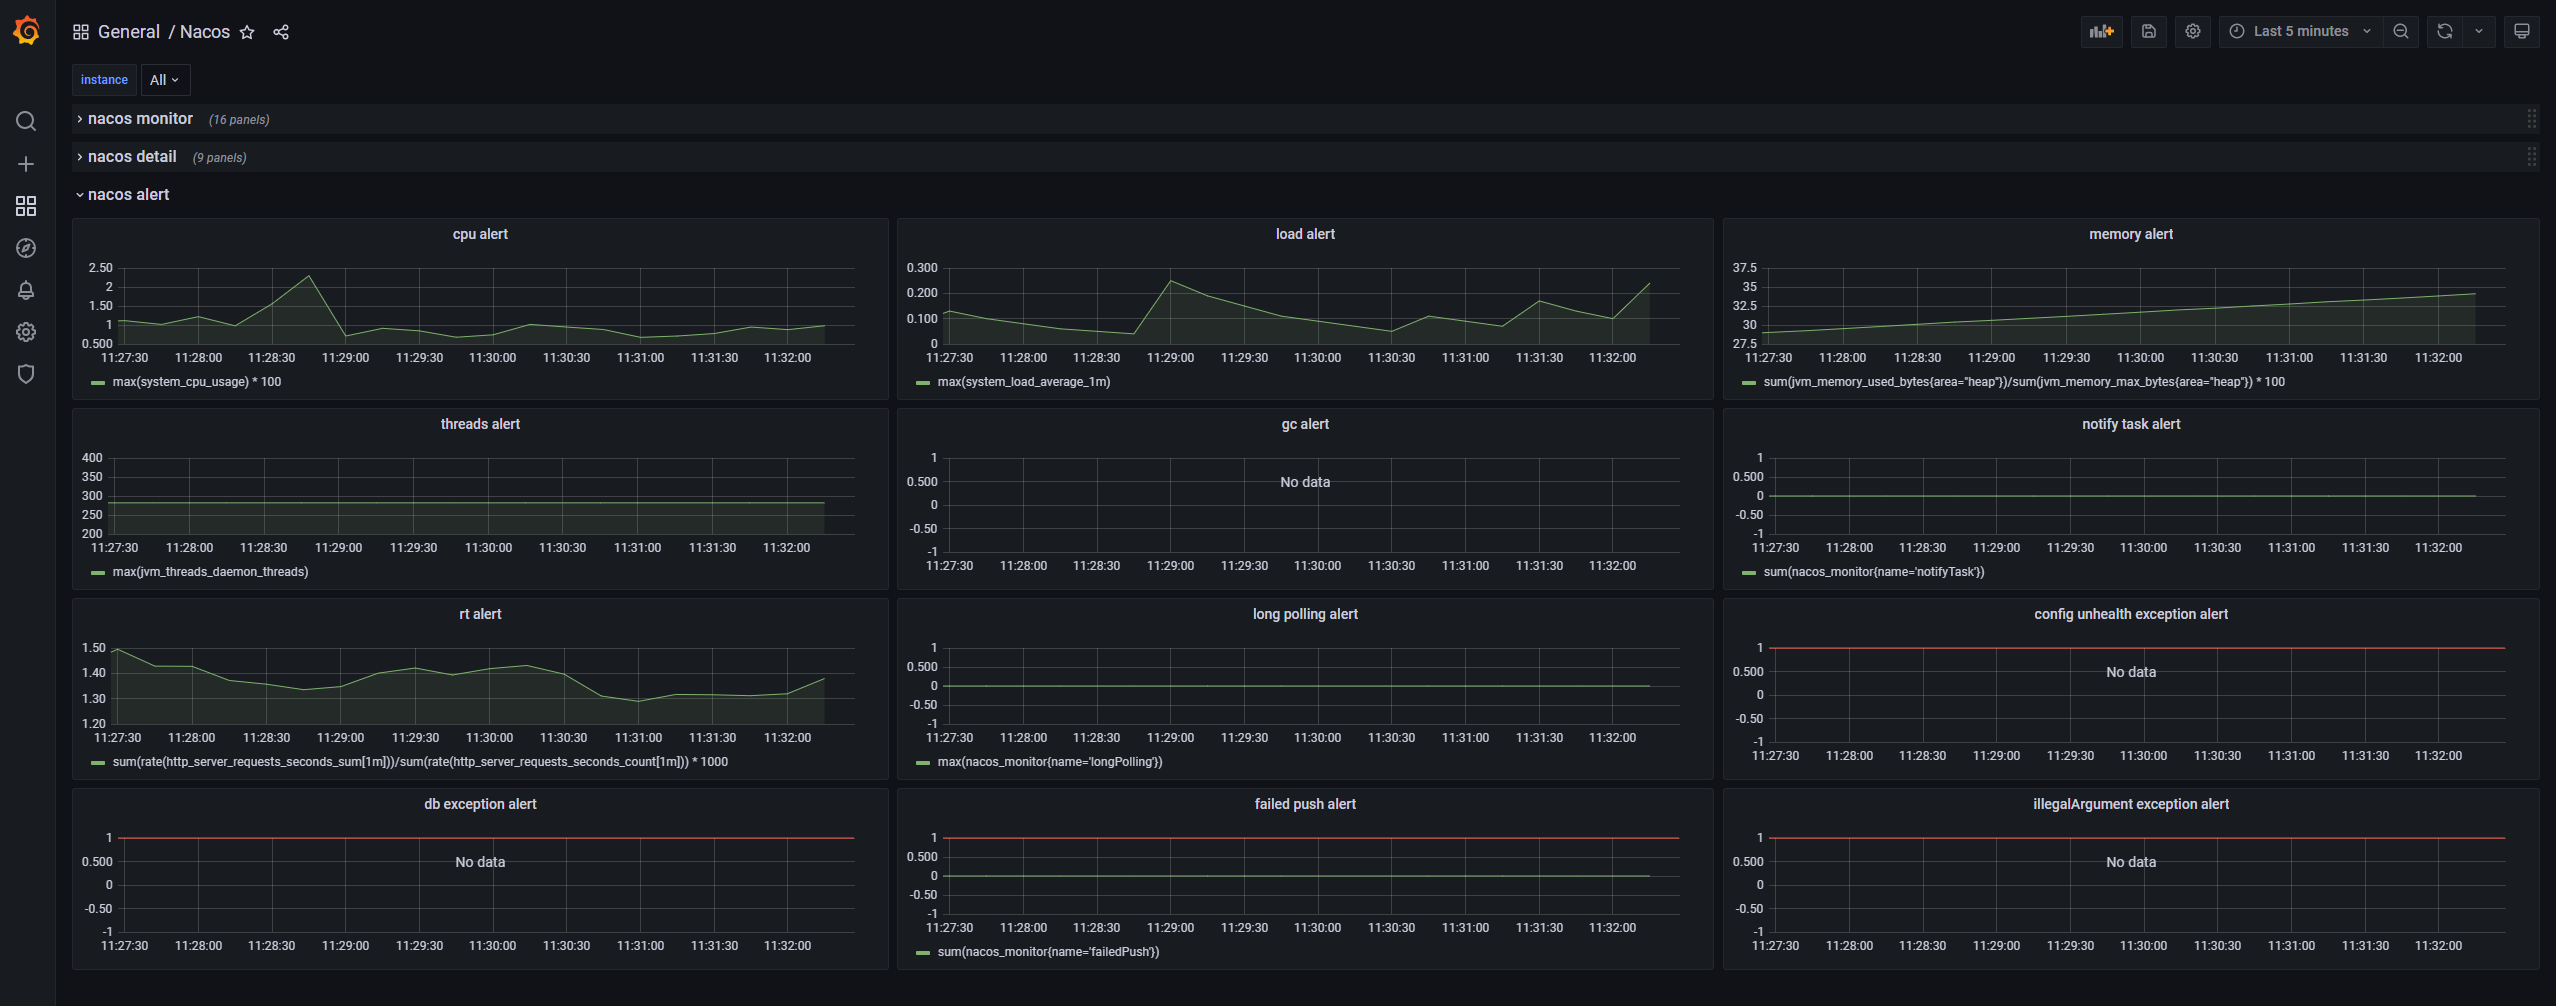

 浙公网安备 33010602011771号