Prometheus之主机告警rules配置
prometheus.yml
# my global config
global:
  scrape_interval: 15s # Set the scrape interval to every 15 seconds. Default is every 1 minute.
  evaluation_interval: 15s # Evaluate rules every 15 seconds. The default is every 1 minute.
  # scrape_timeout is set to the global default (10s).

# Alertmanager configuration
alerting:
  alertmanagers:
    - static_configs:
        - targets:
           - 10.0.9.15:9093

# Load rules once and periodically evaluate them according to the global 'evaluation_interval'.
rule_files:
  # - "first_rules.yml"
  # - "second_rules.yml"
  - "rules/*.yaml"
  - "alert_rules/*.yaml"


# A scrape configuration containing exactly one endpoint to scrape:
# Here it's Prometheus itself.
scrape_configs:
  # The job name is added as a label `job=<job_name>` to any timeseries scraped from this config.
  - job_name: "prometheus"

    # metrics_path defaults to '/metrics'
    # scheme defaults to 'http'.

    static_configs:
      - targets: ["localhost:9090"]

  - job_name: "node"
    static_configs:
      - targets: ["localhost:9100"]
        labels:
          appname: "prometheus-01"
hosts.yaml
/usr/local/prometheus/rules/hosts.yaml
groups:
- name: Host
rules:
- alert: HostMemory Usage
expr: (node_memory_MemTotal_bytes - (node_memory_MemFree_bytes + node_memory_Buffers_bytes + node_memory_Cached_bytes)) / node_memory_MemTotal_bytes * 100 > 90
for: 1m
labels:
name: Memory
severity: Warning
annotations:
summary: " {{ $labels.appname }} "
description: "宿主机内存使用率超过90%."
value: "{{ $value }}%"
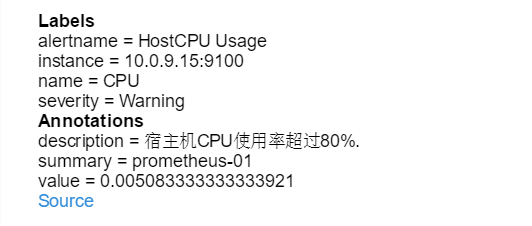
- alert: HostCPU Usage
expr: sum(avg without (cpu)(irate(node_cpu_seconds_total{mode!='idle'}[5m]))) by (instance,appname) > 0.8
for: 1m
labels:
name: CPU
severity: Warning
annotations:
summary: " {{ $labels.appname }} "
description: "宿主机CPU使用率超过80%."
value: "{{ $value }}%"
- alert: HostLoad
expr: node_load5 > 20
for: 1m
labels:
name: Load
severity: Warning
annotations:
summary: "{{ $labels.appname }} "
description: " 主机负载5分钟超过20."
value: "{{ $value }}"
- alert: HostFilesystem Usage
expr: (node_filesystem_size_bytes-node_filesystem_free_bytes)/node_filesystem_size_bytes*100>80
for: 1m
labels:
name: Disk
severity: Warning
annotations:
summary: " {{ $labels.appname }} "
description: " 宿主机 [ {{ $labels.mountpoint }} ]分区使用超过80%."
value: "{{ $value }}%"
- alert: HostDiskio writes
expr: irate(node_disk_writes_completed_total{job=~"Host"}[1m]) > 10
for: 1m
labels:
name: Diskio
severity: Warning
annotations:
summary: " {{ $labels.appname }} "
description: " 宿主机 [{{ $labels.device }}]磁盘1分钟平均写入IO负载较高."
value: "{{ $value }}iops"
- alert: HostDiskio reads
expr: irate(node_disk_reads_completed_total{job=~"Host"}[1m]) > 10
for: 1m
labels:
name: Diskio
severity: Warning
annotations:
summary: " {{ $labels.appname }} "
description: " 宿主机 [{{ $labels.device }}]磁盘1分钟平均读取IO负载较高."
value: "{{ $value }}iops"
- alert: HostNetwork_receive
expr: irate(node_network_receive_bytes_total{device!~"lo|bond[0-9]|cbr[0-9]|veth.*|virbr.*|ovs-system"}[5m]) / 1048576 > 10
for: 1m
labels:
name: Network_receive
severity: Warning
annotations:
summary: " {{ $labels.appname }} "
description: " 宿主机 [{{ $labels.device }}] 网卡5分钟平均接收流量超过10Mbps."
value: "{{ $value }}3Mbps"
- alert: hostNetwork_transmit
expr: irate(node_network_transmit_bytes_total{device!~"lo|bond[0-9]|cbr[0-9]|veth.*|virbr.*|ovs-system"}[5m]) / 1048576 > 10
for: 1m
labels:
name: Network_transmit
severity: Warning
annotations:
summary: " {{ $labels.appname }} "
description: " 宿主机 [{{ $labels.device }}] 网卡5分钟内平均发送流量超过10Mbps."
value: "{{ $value }}10Mbps"告警实例
示例
groups:

- name: NodeExporter

  rules:
    - alert: HostOutOfMemory
      expr: 'node_memory_MemAvailable_bytes / node_memory_MemTotal_bytes * 100 < 5'
      for: 1h
      labels:
        severity: warning
      annotations:
        summary: Host out of memory (instance {{ $labels.instance }})
        description: "Node memory is filling up (< 5% left)\n  VALUE = {{ $value }}\n  LABELS = {{ $labels }}"


    - alert: HostOutOfDiskSpace < 20% left
    #  expr: '(node_filesystem_avail_bytes * 100) / node_filesystem_size_bytes < 20 and ON (instance, device, mountpoint) node_filesystem_readonly == 0'
      expr: |
        (
            (node_filesystem_avail_bytes{instance!="21.40.80.240:9100"} * 100) / node_filesystem_size_bytes{instance!="21.40.80.240:9100"} < 20 or
            (node_filesystem_avail_bytes{module!="ZCM"} * 100) / node_filesystem_size_bytes{module!="ZCM"} < 20
        ) and ON (instance, device, mountpoint) (node_filesystem_readonly{instance!="21.40.80.240:9100"} == 0 and node_filesystem_readonly{module!="ZCM"} == 0)
      for: 2m
      labels:
        severity: warning
      annotations:
        summary: Host out of disk space (instance {{ $labels.instance }})
        description: "Disk is almost full (< 20% left)\n  VALUE = {{ $value }}\n  LABELS = {{ $labels }}"


    - alert: HostOutOfDiskSpace < 10% left
    #  expr: '(node_filesystem_avail_bytes * 100) / node_filesystem_size_bytes < 20 and ON (instance, device, mountpoint) node_filesystem_readonly == 0'
      expr: |
          (node_filesystem_avail_bytes{module="ZCM"} * 100) / node_filesystem_size_bytes{module="ZCM"} < 10
          and ON (instance, device, mountpoint) node_filesystem_readonly{module="ZCM"} ==0
      for: 2m
      labels:
        severity: warning
      annotations:
        summary: Host out of disk space (instance {{ $labels.instance }})
        description: "Disk is almost full (< 10% left)\n  VALUE = {{ $value }}\n  LABELS = {{ $labels }}"


    - alert: HostOutOfInodes
      expr: 'node_filesystem_files_free / node_filesystem_files * 100 < 20 and ON (instance, device, mountpoint) node_filesystem_readonly == 0'
      for: 2m
      labels:
        severity: warning
      annotations:
        summary: Host out of inodes (instance {{ $labels.instance }})
        description: "Disk is almost running out of available inodes (< 20% left)\n  VALUE = {{ $value }}\n  LABELS = {{ $labels }}"

    - alert: HostHighCpuLoad
      expr: '100 - (avg by(instance) (rate(node_cpu_seconds_total{mode="idle"}[2m])) * 100) > 80'
      for: 5m
      labels:
        severity: warning
      annotations:
        summary: Host high CPU load (instance {{ $labels.instance }})
        description: "CPU load is > 80%\n  VALUE = {{ $value }}\n  LABELS = {{ $labels }}"


    - alert: HostCpuStealNoisyNeighbor
      expr: 'avg by(instance) (rate(node_cpu_seconds_total{mode="steal"}[5m])) * 100 > 10'
      for: 0m
      labels:
        severity: warning
      annotations:
        summary: Host CPU steal noisy neighbor (instance {{ $labels.instance }})
        description: "CPU steal is > 10%. A noisy neighbor is killing VM performances or a spot instance may be out of credit.\n  VALUE = {{ $value }}\n  LABELS = {{ $labels }}"


    - alert: HostSystemdServiceCrashed
      expr: 'node_systemd_unit_state{state="failed"} == 1'
      for: 2m
      labels:
        severity: warning
      annotations:
        summary: Host systemd service crashed (instance {{ $labels.instance }})
        description: "systemd service crashed\n  VALUE = {{ $value }}\n  LABELS = {{ $labels }}"

    - alert: HostNodeOvertemperatureAlarm
      expr: 'node_hwmon_temp_crit_alarm_celsius == 1'
      for: 5m
      labels:
        severity: critical
      annotations:
        summary: Host node overtemperature alarm (instance {{ $labels.instance }})
        description: "Physical node temperature alarm triggered\n  VALUE = {{ $value }}\n  LABELS = {{ $labels }}"

    - alert: HostRaidArrayGotInactive
      expr: 'node_md_state{state="inactive"} > 0'
      for: 5m
      labels:
        severity: critical
      annotations:
        summary: Host RAID array got inactive (instance {{ $labels.instance }})
        description: "RAID array {{ $labels.device }} is in degraded state due to one or more disks failures. Number of spare drives is insufficient to fix issue automatically.\n  VALUE = {{ $value }}\n  LABELS = {{ $labels }}"

    - alert: HostRaidDiskFailure
      expr: 'node_md_disks{state="failed"} > 0'
      for: 2m
      labels:
        severity: warning
      annotations:
        summary: Host RAID disk failure (instance {{ $labels.instance }})
        description: "At least one device in RAID array on {{ $labels.instance }} failed. Array {{ $labels.md_device }} needs attention and possibly a disk swap\n  VALUE = {{ $value }}\n  LABELS = {{ $labels }}"

    - alert: HostRaidMembersDiskRemoveOrOtherError
      expr: node_md_disks{state="active"}%2==1
      for: 5m
      labels:
        severity: critical
      annotations:
        summary: Host RAID disk remove or other error (instance {{ $labels.instance }})
        description: "At least one device in RAID array on {{ $labels.instance }} failed. Array {{ $labels.md_device }} needs attention and possibly a disk swap\n  VALUE = {{ $value }}\n  LABELS = {{ $labels }}"

    - alert: HostOomKillDetected
      expr: 'increase(node_vmstat_oom_kill[1m]) > 0'
      for: 2m
      labels:
        severity: warning
      annotations:
        summary: Host OOM kill detected (instance {{ $labels.instance }})
        description: "OOM kill detected\n  VALUE = {{ $value }}\n  LABELS = {{ $labels }}"

    - alert: HostEdacCorrectableErrorsDetected
      expr: 'increase(node_edac_correctable_errors_total[1m]) > 5'
      for: 5m
      labels:
        severity: info
      annotations:
        summary: Host EDAC Correctable Errors detected (instance {{ $labels.instance }})
        description: "Host {{ $labels.instance }} has had {{ printf \"%.0f\" $value }} correctable memory errors reported by EDAC in the last 5 minutes.\n  VALUE = {{ $value }}\n  LABELS = {{ $labels }}"

    - alert: HostEdacUncorrectableErrorsDetected
      expr: 'node_edac_uncorrectable_errors_total > 0'
      for: 5m
      labels:
        severity: warning
      annotations:
        summary: Host EDAC Uncorrectable Errors detected (instance {{ $labels.instance }})
        description: "Host {{ $labels.instance }} has had {{ printf \"%.0f\" $value }} uncorrectable memory errors reported by EDAC in the last 5 minutes.\n  VALUE = {{ $value }}\n  LABELS = {{ $labels }}"

    - alert: HostNetworkReceiveErrors
      expr: 'rate(node_network_receive_errs_total[5m]) / rate(node_network_receive_packets_total[5m]) > 0.01'
      for: 5m
      labels:
        severity: warning
      annotations:
        summary: Host Network Receive Errors (instance {{ $labels.instance }})
        description: "Host {{ $labels.instance }} interface {{ $labels.device }} has encountered {{ printf \"%.0f\" $value }} receive errors in the last 5 minutes.\n  VALUE = {{ $value }}\n  LABELS = {{ $labels }}"

    - alert: HostNetworkTransmitErrors
      expr: 'rate(node_network_transmit_errs_total[5m]) / rate(node_network_transmit_packets_total[5m]) > 0.01'
      for: 5m
      labels:
        severity: warning
      annotations:
        summary: Host Network Transmit Errors (instance {{ $labels.instance }})
        description: "Host {{ $labels.instance }} interface {{ $labels.device }} has encountered {{ printf \"%.0f\" $value }} transmit errors in the last 5 minutes.\n  VALUE = {{ $value }}\n  LABELS = {{ $labels }}"

    - alert: HostNetworkReceiveHighUtil
      expr: '100*(rate(node_network_receive_bytes_total{device!~"^tap.*|^vnet.*|^veth.*|^tun.*|^.*\\..*"}[2m]) / (node_network_speed_bytes{device!~"^tap.*|^vnet.*|^veth.*|^tun.*|^.*\\..*"})) > 80'
      for: 5m
      labels:
        severity: warning
      annotations:
        summary: Host unusual network throughput in (instance {{ $labels.instance }})
        description: "Host network interfaces receiving utils > 80%\n  VALUE = {{ $value }}\n  LABELS = {{ $labels }}"

    - alert: HostNetworkTransmitHighUtil
      expr: '100*(rate(node_network_transmit_bytes_total{device!~"^tap.*|^vnet.*|^veth.*|^tun.*|^.*\\..*"}[2m]) / (node_network_speed_bytes{device!~"^tap.*|^vnet.*|^veth.*|^tun.*|^.*\\..*"})) > 80'
      for: 5m
      labels:
        severity: warning
      annotations:
        summary: Host unusual network throughput out (instance {{ $labels.instance }})
        description: "Host network interfaces sending utils > 80%\n  VALUE = {{ $value }}\n  LABELS = {{ $labels }}"

    - alert: HostNetworkBondDegraded
      expr: '(node_bonding_active - node_bonding_slaves) != 0'
      for: 2m
      labels:
        severity: warning
      annotations:
        summary: Host Network Bond Degraded (instance {{ $labels.instance }})
        description: "Bond \"{{ $labels.device }}\" degraded on \"{{ $labels.instance }}\".\n  VALUE = {{ $value }}\n  LABELS = {{ $labels }}"

    - alert: HostNetworkBondMemberMissed
      expr: 'node_bonding_active !=2 or node_bonding_slaves !=2'
      for: 2m
      labels:
        severity: warning
      annotations:
        summary: Host Network Bond Member messed (instance {{ $labels.instance }})
        description: "Bond \"{{ $labels.device }}\" member messed on \"{{ $labels.instance }}\".\n  VALUE = {{ $value }}\n  LABELS = {{ $labels }}"

    - alert: HostConntrackLimit
      expr: 'node_nf_conntrack_entries / node_nf_conntrack_entries_limit > 0.8'
      for: 5m
      labels:
        severity: warning
      annotations:
        summary: Host conntrack limit (instance {{ $labels.instance }})
        description: "The number of conntrack is approaching limit\n  VALUE = {{ $value }}\n  LABELS = {{ $labels }}"

    - alert: HostClockSkew
      expr: '(node_timex_offset_seconds > 0.05 and deriv(node_timex_offset_seconds[5m]) >= 0) or (node_timex_offset_seconds < -0.05 and deriv(node_timex_offset_seconds[5m]) <= 0)'
      for: 2m
      labels:
        severity: warning
      annotations:
        summary: Host clock skew (instance {{ $labels.instance }})
        description: "Clock skew detected. Clock is out of sync. Ensure NTP is configured correctly on this host.\n  VALUE = {{ $value }}\n  LABELS = {{ $labels }}"

    - alert: HostClockNotSynchronising
      expr: 'min_over_time(node_timex_sync_status[1m]) == 0 and node_timex_maxerror_seconds >= 16'
      for: 2m
      labels:
        severity: warning
      annotations:
        summary: Host clock not synchronising (instance {{ $labels.instance }})
        description: "Clock not synchronising. Ensure NTP is configured on this host.\n  VALUE = {{ $value }}\n  LABELS = {{ $labels }}"

    - alert: HostReboot
      expr: '(time() - node_boot_time_seconds) < 86400'
      for: 2m
      labels:
        severity: warning
      annotations:
        summary: Host detect reboot (instance {{ $labels.instance }})
        description: "{{ $labels.instance }} detect reboot < 1 day.\n  VALUE = {{ $value }}\n  LABELS = {{ $labels }}"
zookeeper_exporter_rules.yml
  groups:
  - name: zk-alert-example
    rules:
    - alert: create too many znodes
      expr: znode_count > 1000000
      for: 1m
      labels:
        severity: warning
      annotations:
        summary: "Instance {{ $labels.instance }} create too many znodes"
        description: "{{ $labels.instance }} of job {{$labels.job}} create too many znodes: [{{ $value }}]."

    - alert: create too many connections
      expr: num_alive_connections > 50 # suppose we use the default maxClientCnxns: 60
      for: 1m
      labels:
        severity: warning
      annotations:
        summary: "Instance {{ $labels.instance }} create too many connections"
        description: "{{ $labels.instance }} of job {{$labels.job}} create too many connections: [{{ $value }}]."

    - alert: znode total occupied memory is too big
      expr: approximate_data_size /1024 /1024 > 1 * 1024 # more than 1024 MB(1 GB)
      for: 1m
      labels:
        severity: warning
      annotations:
        summary: "Instance {{ $labels.instance }} znode total occupied memory is too big"
        description: "{{ $labels.instance }} of job {{$labels.job}} znode total occupied memory is too big: [{{ $value }}] MB."

    - alert: set too many watch
      expr: watch_count > 30000
      for: 1m
      labels:
        severity: warning
      annotations:
        summary: "Instance {{ $labels.instance }} set too many watch"
        description: "{{ $labels.instance }} of job {{$labels.job}} set too many watch: [{{ $value }}]."

    - alert: a leader election happens
      expr: increase(election_time_count[5m]) > 0
      for: 1m
      labels:
        severity: warning
      annotations:
        summary: "Instance {{ $labels.instance }} a leader election happens"
        description: "{{ $labels.instance }} of job {{$labels.job}} a leader election happens: [{{ $value }}]."

    - alert: open too many files
      expr: open_file_descriptor_count > 300
      for: 1m
      labels:
        severity: warning
      annotations:
        summary: "Instance {{ $labels.instance }} open too many files"
        description: "{{ $labels.instance }} of job {{$labels.job}} open too many files: [{{ $value }}]."

    - alert: fsync time is too long
      expr: rate(fsynctime_sum[1m]) > 100
      for: 1m
      labels:
        severity: warning
      annotations:
        summary: "Instance {{ $labels.instance }} fsync time is too long"
        description: "{{ $labels.instance }} of job {{$labels.job}} fsync time is too long: [{{ $value }}]."

    - alert: take snapshot time is too long
      expr: rate(snapshottime_sum[5m]) > 100
      for: 1m
      labels:
        severity: warning
      annotations:
        summary: "Instance {{ $labels.instance }} take snapshot time is too long"
        description: "{{ $labels.instance }} of job {{$labels.job}} take snapshot time is too long: [{{ $value }}]."

    - alert: avg latency is too high
      expr: avg_latency > 100
      for: 1m
      labels:
        severity: warning
      annotations:
        summary: "Instance {{ $labels.instance }} avg latency is too high"
        description: "{{ $labels.instance }} of job {{$labels.job}} avg latency is too high: [{{ $value }}]."

    - alert: JvmMemoryFillingUp
      expr: jvm_memory_bytes_used / jvm_memory_bytes_max{area="heap"} > 0.8
      for: 5m
      labels:
        severity: warning
      annotations:
        summary: "JVM memory filling up (instance {{ $labels.instance }})"
        description: "JVM memory is filling up (> 80%)\n labels: {{ $labels }}  value = {{ $value }}\n"
kafka_exporter_rules.yml
groups:

- name: PrometheusCommunityKafkaExporter-kafka

  rules:

    - alert: kafka消费积压告警
      expr: |
           sum(kafka_consumergroup_lag{instance=~"xxxx:9308",topic=~"xxx",job="kafka_exporter",module="日志",consumergroup="syslog-consumer"}) by (consumergroup, topic) > 100000
      for: 5m
      labels:
        severity: warning
      annotations:
        summary: kafka消费积压 topic(syslog)消费积压 (instance {{ $labels.instance }})
        description: "日志中心kafka消费积压 topic(syslog)消费积压 >= 100000\n  VALUE = {{ $value }}\n  LABELS = {{ $labels }}"
elasticsearch_exporter_rules.yml
groups:

- name: PrometheusCommunityElasticsearchExporter-my

  rules:

    - alert: ElasticsearchThreadPoolQueueCountHigh
      expr: |
            sum(elasticsearch_thread_pool_queue_count{cluster=~"ilog_cluster", type=~"search"}) by (name) >= 600
            unless
            absent(elasticsearch_thread_pool_queue_count{cluster=~"ilog_cluster", type=~"search"})
      for: 2m
      labels:
        severity: warning
      annotations:
        summary: Elasticsearch Thread Pool Queue Count Too High (instance {{ $labels.instance }})
        description: "The thread pool queue count >= 300\n  VALUE = {{ $value }}\n  LABELS = {{ $labels }}"

 浙公网安备 33010602011771号