Prometheus之blackbox exporter实现端口监控
端口监控配置
prometheus.yml
- job_name: "prot_status"
    metrics_path: /probe
    params:
      module: [tcp_connect]
    file_sd_configs:
    - files:
      - targets/port-status.yaml
      refresh_interval: 2m
    relabel_configs:
      - source_labels: [__address__]
        target_label: __param_target
      - source_labels: [__param_target]
        target_label: ip
      - target_label: __address__
        replacement: 172.16.6.46:9115
port-status.yaml
- targets:
  - 172.16.10.41:1883
  labels:
    appname: "rel-emqx01"
    env: "测试环境"
    hostname: "rel-web01"
    instance: "172.16.10.41"
- targets:
  - 172.16.3.114:1883
  labels:
    appname: "prod-emqx01"
    env: "生产环境"
    hostname: "web010"
    instance: "172.16.3.114"
检查文件
# /usr/local/prometheus/promtool check config /usr/local/prometheus/prometheus.yml
Checking /usr/local/prometheus/prometheus.yml
  SUCCESS: 1 rule files found

Checking /usr/local/prometheus/alert_rules/instance_up.yaml
  SUCCESS: 1 rules found
重启Prometheus服务
# systemctl restart prometheusPrometheus dashboard
targets
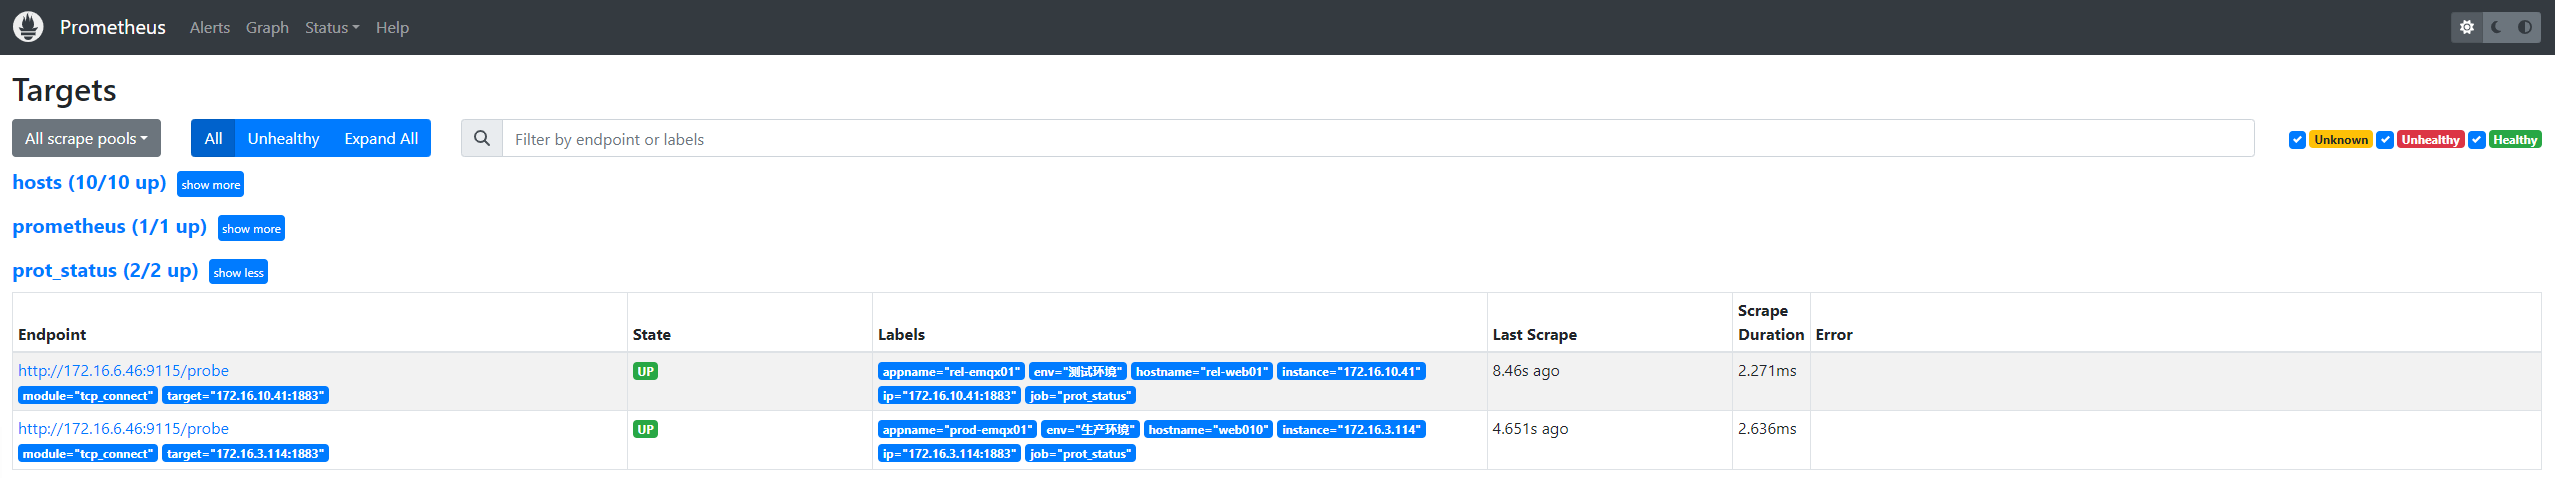
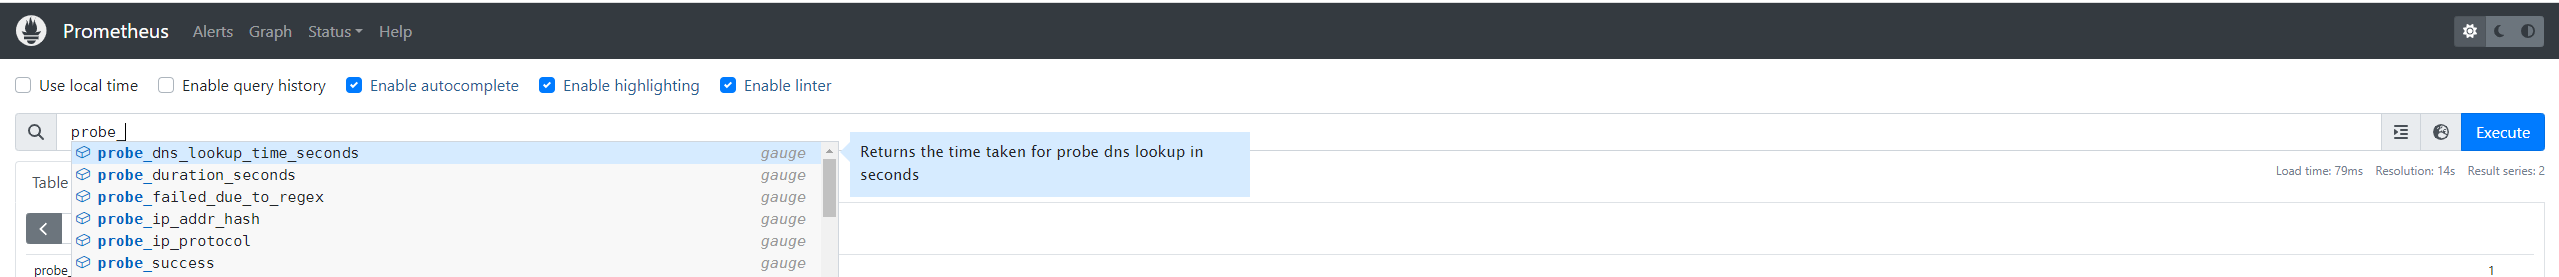
Metrics
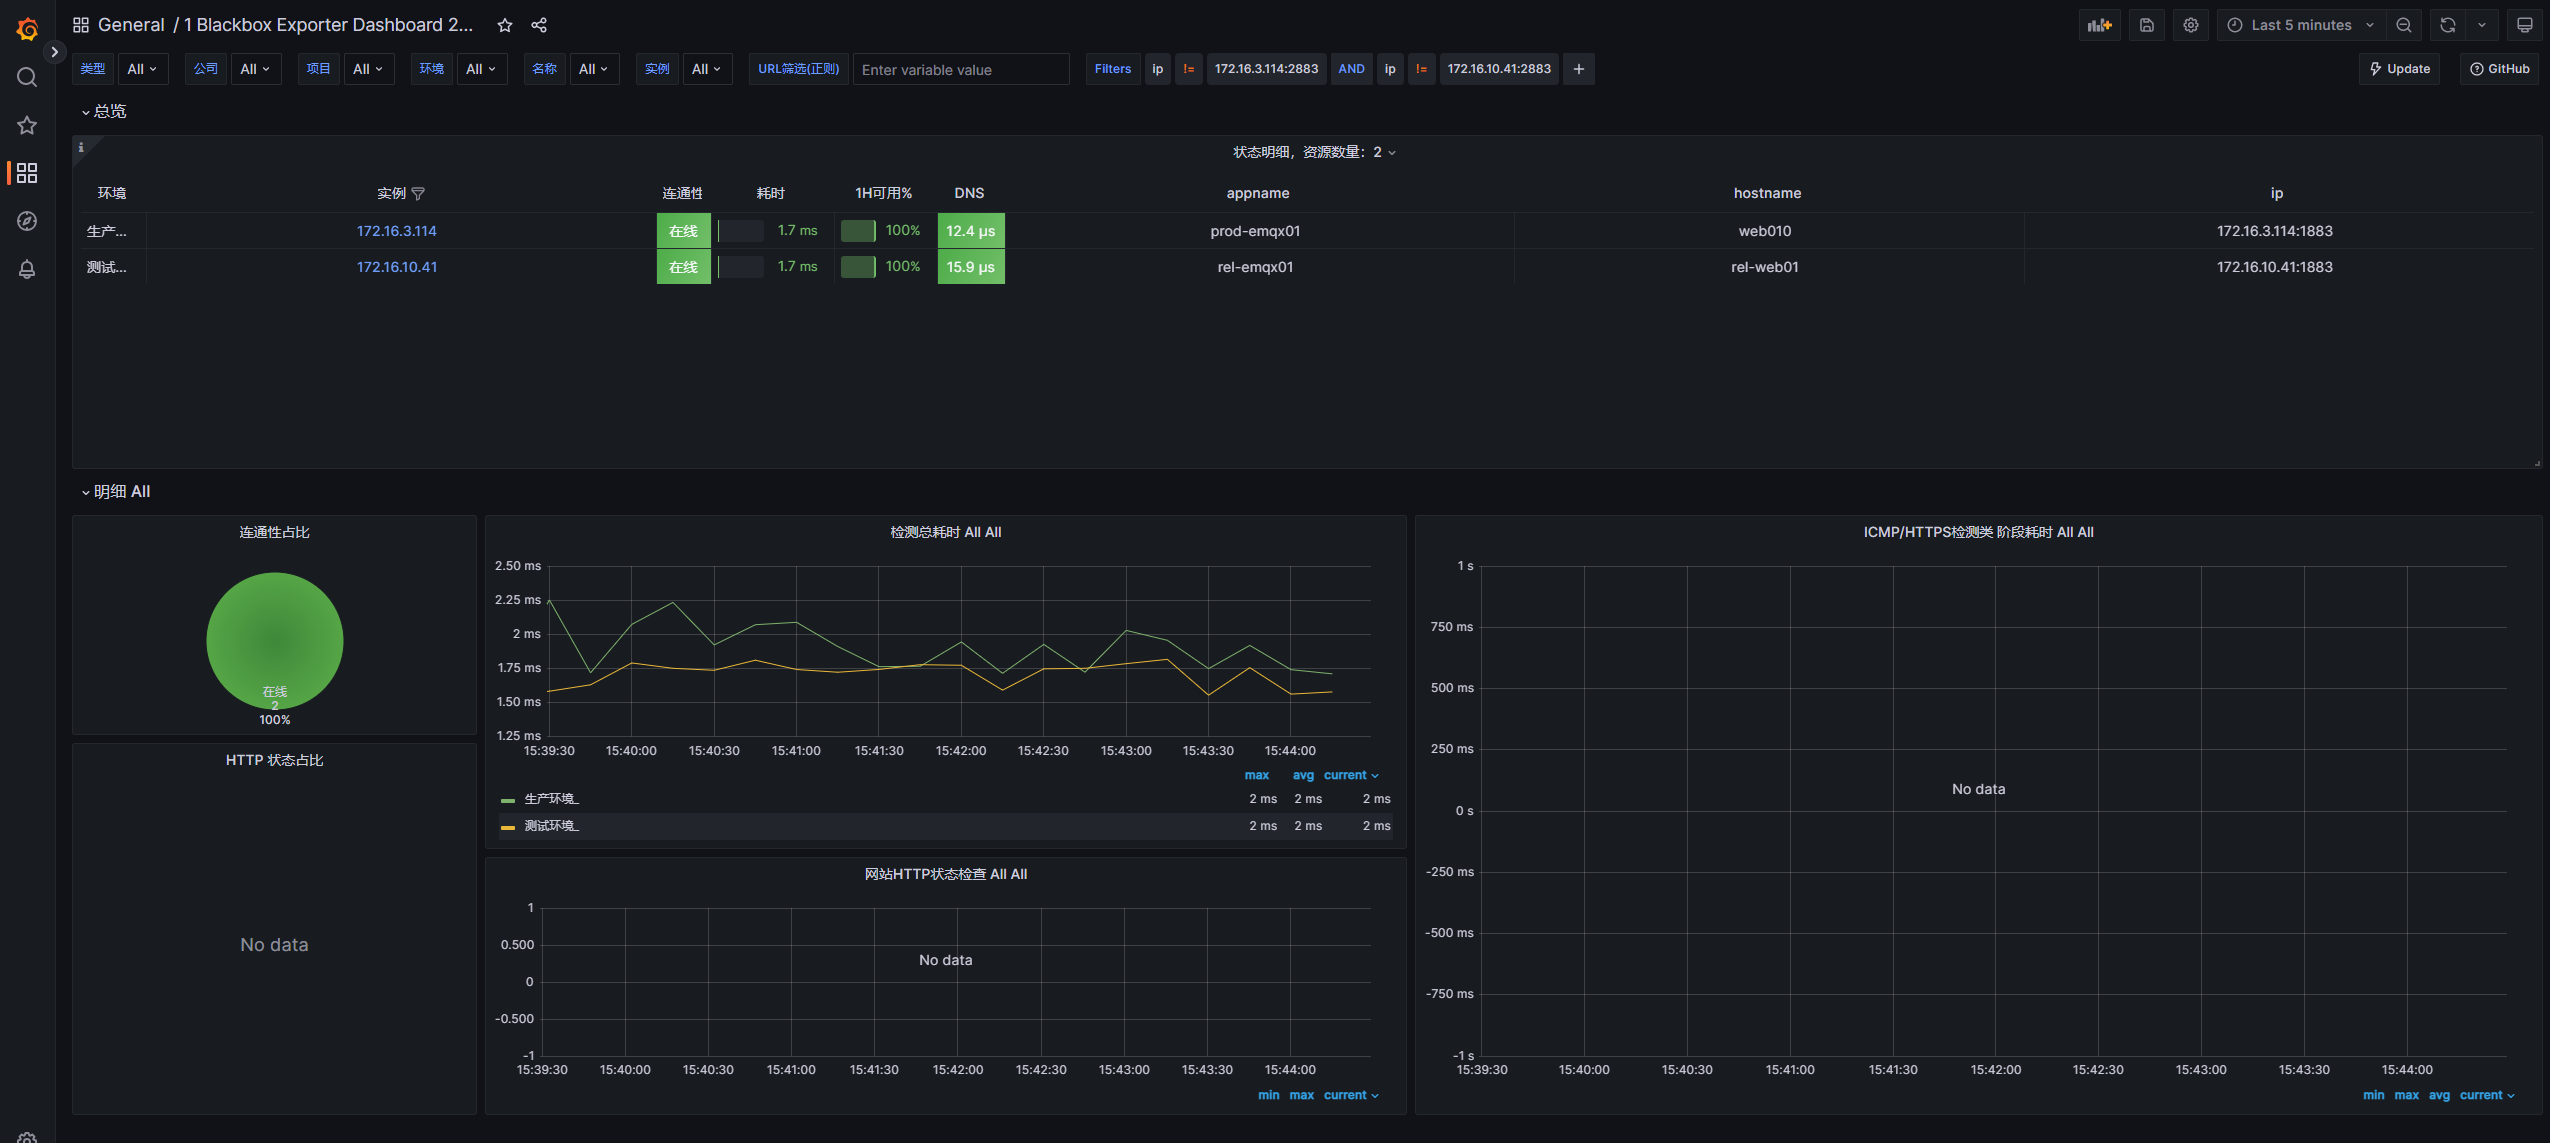
blackbox exporter dashboard
Probes
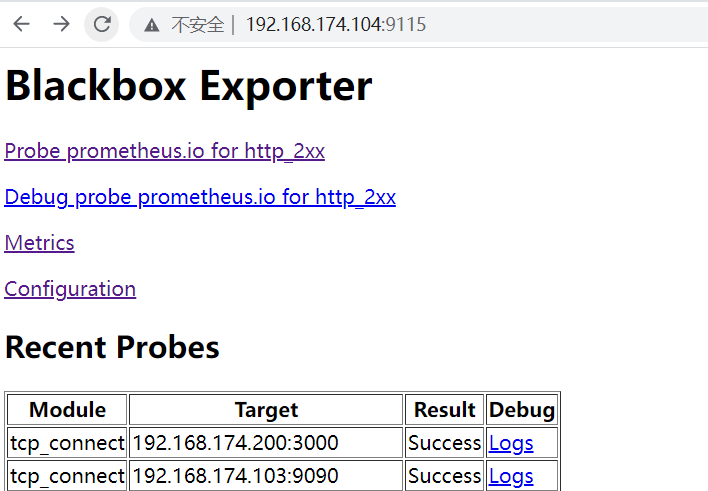
Metrics
Metrics that would have been returned:
# HELP probe_dns_lookup_time_seconds Returns the time taken for probe dns lookup in seconds
# TYPE probe_dns_lookup_time_seconds gauge
probe_dns_lookup_time_seconds 9.688e-06
# HELP probe_duration_seconds Returns how long the probe took to complete in seconds
# TYPE probe_duration_seconds gauge
probe_duration_seconds 0.001560476
# HELP probe_failed_due_to_regex Indicates if probe failed due to regex
# TYPE probe_failed_due_to_regex gauge
probe_failed_due_to_regex 0
# HELP probe_ip_addr_hash Specifies the hash of IP address. It's useful to detect if the IP address changes.
# TYPE probe_ip_addr_hash gauge
probe_ip_addr_hash 2.21480232e+08
# HELP probe_ip_protocol Specifies whether probe ip protocol is IP4 or IP6
# TYPE probe_ip_protocol gauge
probe_ip_protocol 4
# HELP probe_success Displays whether or not the probe was a success
# TYPE probe_success gauge
probe_success 1
告警配置
port_status.yaml
groups:
- name: probe_success
rules:
- alert: probe_success
expr: probe_success == 0
for: 1m
labels:
severity: critical
annotations:
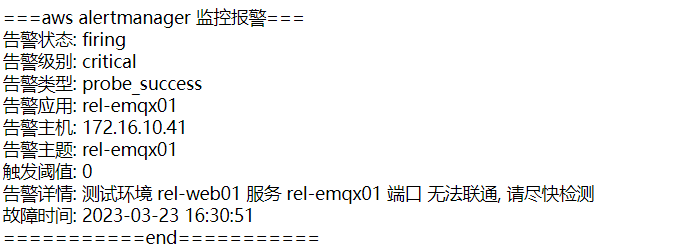
summary: "{{ $labels.appname }}"
description: "{{ $labels.env }} {{ $labels.hostname }} 服务 {{ $labels.appname }} 端口 无法联通, 请尽快检测"
value: "{{ $value }}"prometheus.yml
rule_files:
  - "rules/*.yaml"
  - "alert_rules/*.yaml"
告警信息
dashboard
推荐模板
推荐模板ID 9965
查看dashboard

 浙公网安备 33010602011771号