Prometheus之blackbox exporter实现URL监控
URL监控配置
prometheus.yml
- job_name: "http_status"
    metrics_path: /probe
    params:
      module: [http_2xx]   # Look for a HTTP 200 response.
    file_sd_configs:
    - files:
      - targets/url-status.yaml
      refresh_interval: 2m
    relabel_configs:
      - source_labels: [__address__]
        target_label: __param_target
      - source_labels: [__param_target]
        target_label: url
      - target_label: __address__
        replacement: 172.16.6.46:9115
url-status.yaml
- targets:
  - https://www.smartholder.jp/
  labels:
    name: "smartholder.jp"
    env: "生产环境"
- targets:
  - http://172.16.10.41:8001/service-api/user/ping
  labels:
    appname: "rel_mvp-web"
    env: "测试环境"
    name: "rel-web01"
    instance: "172.16.10.41"
检查文件
# /usr/local/prometheus/promtool check config /usr/local/prometheus/prometheus.yml 重启Prometheus服务
# systemctl restart prometheusPrometheus
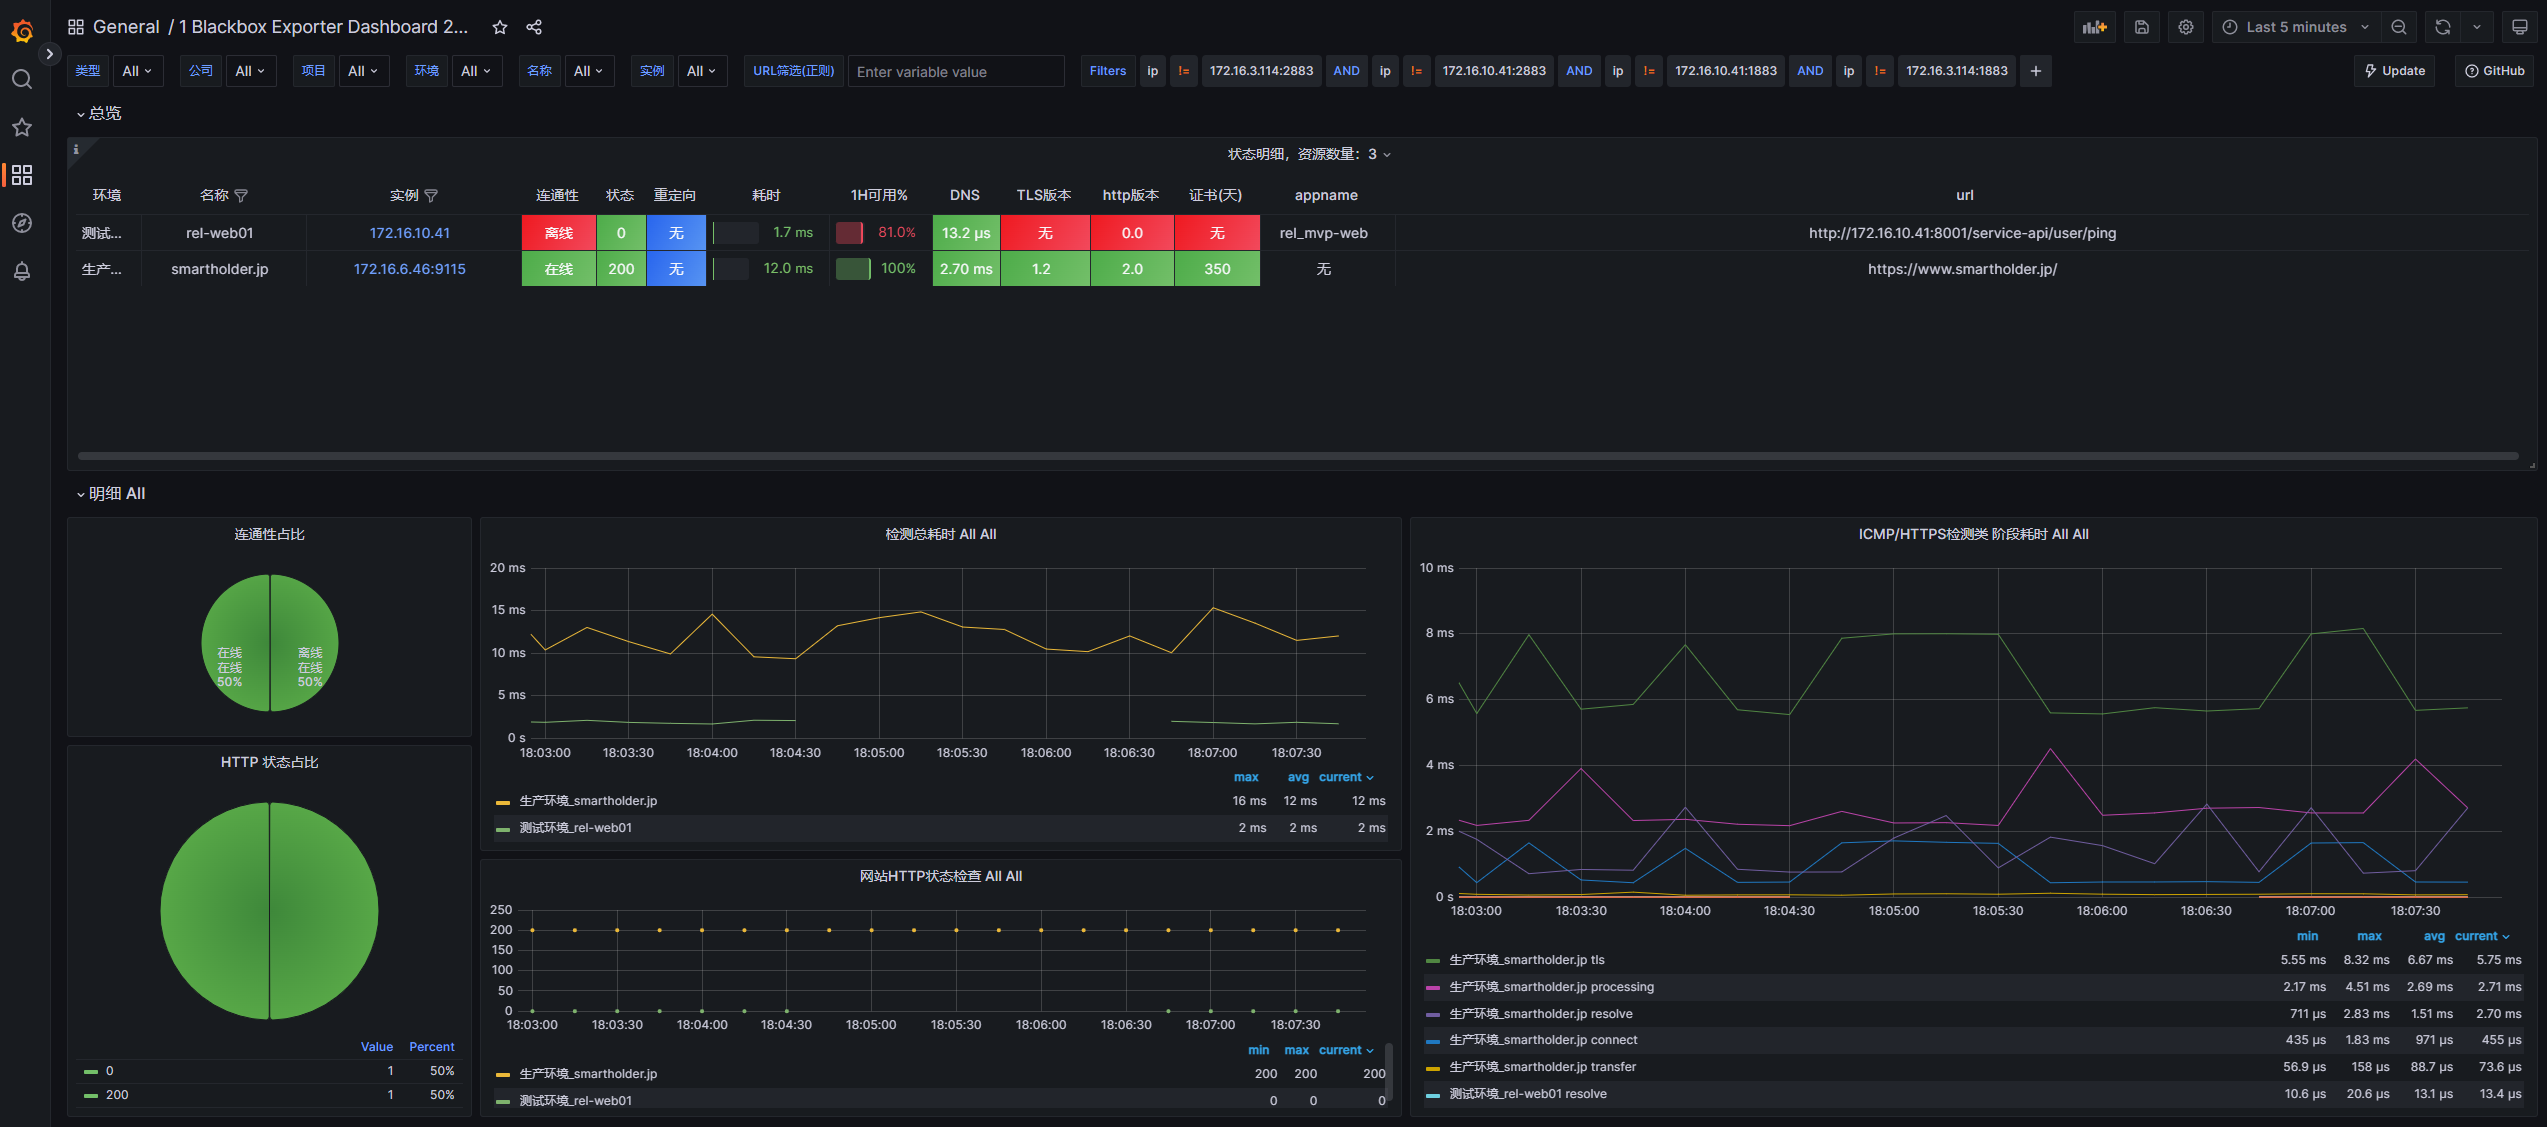
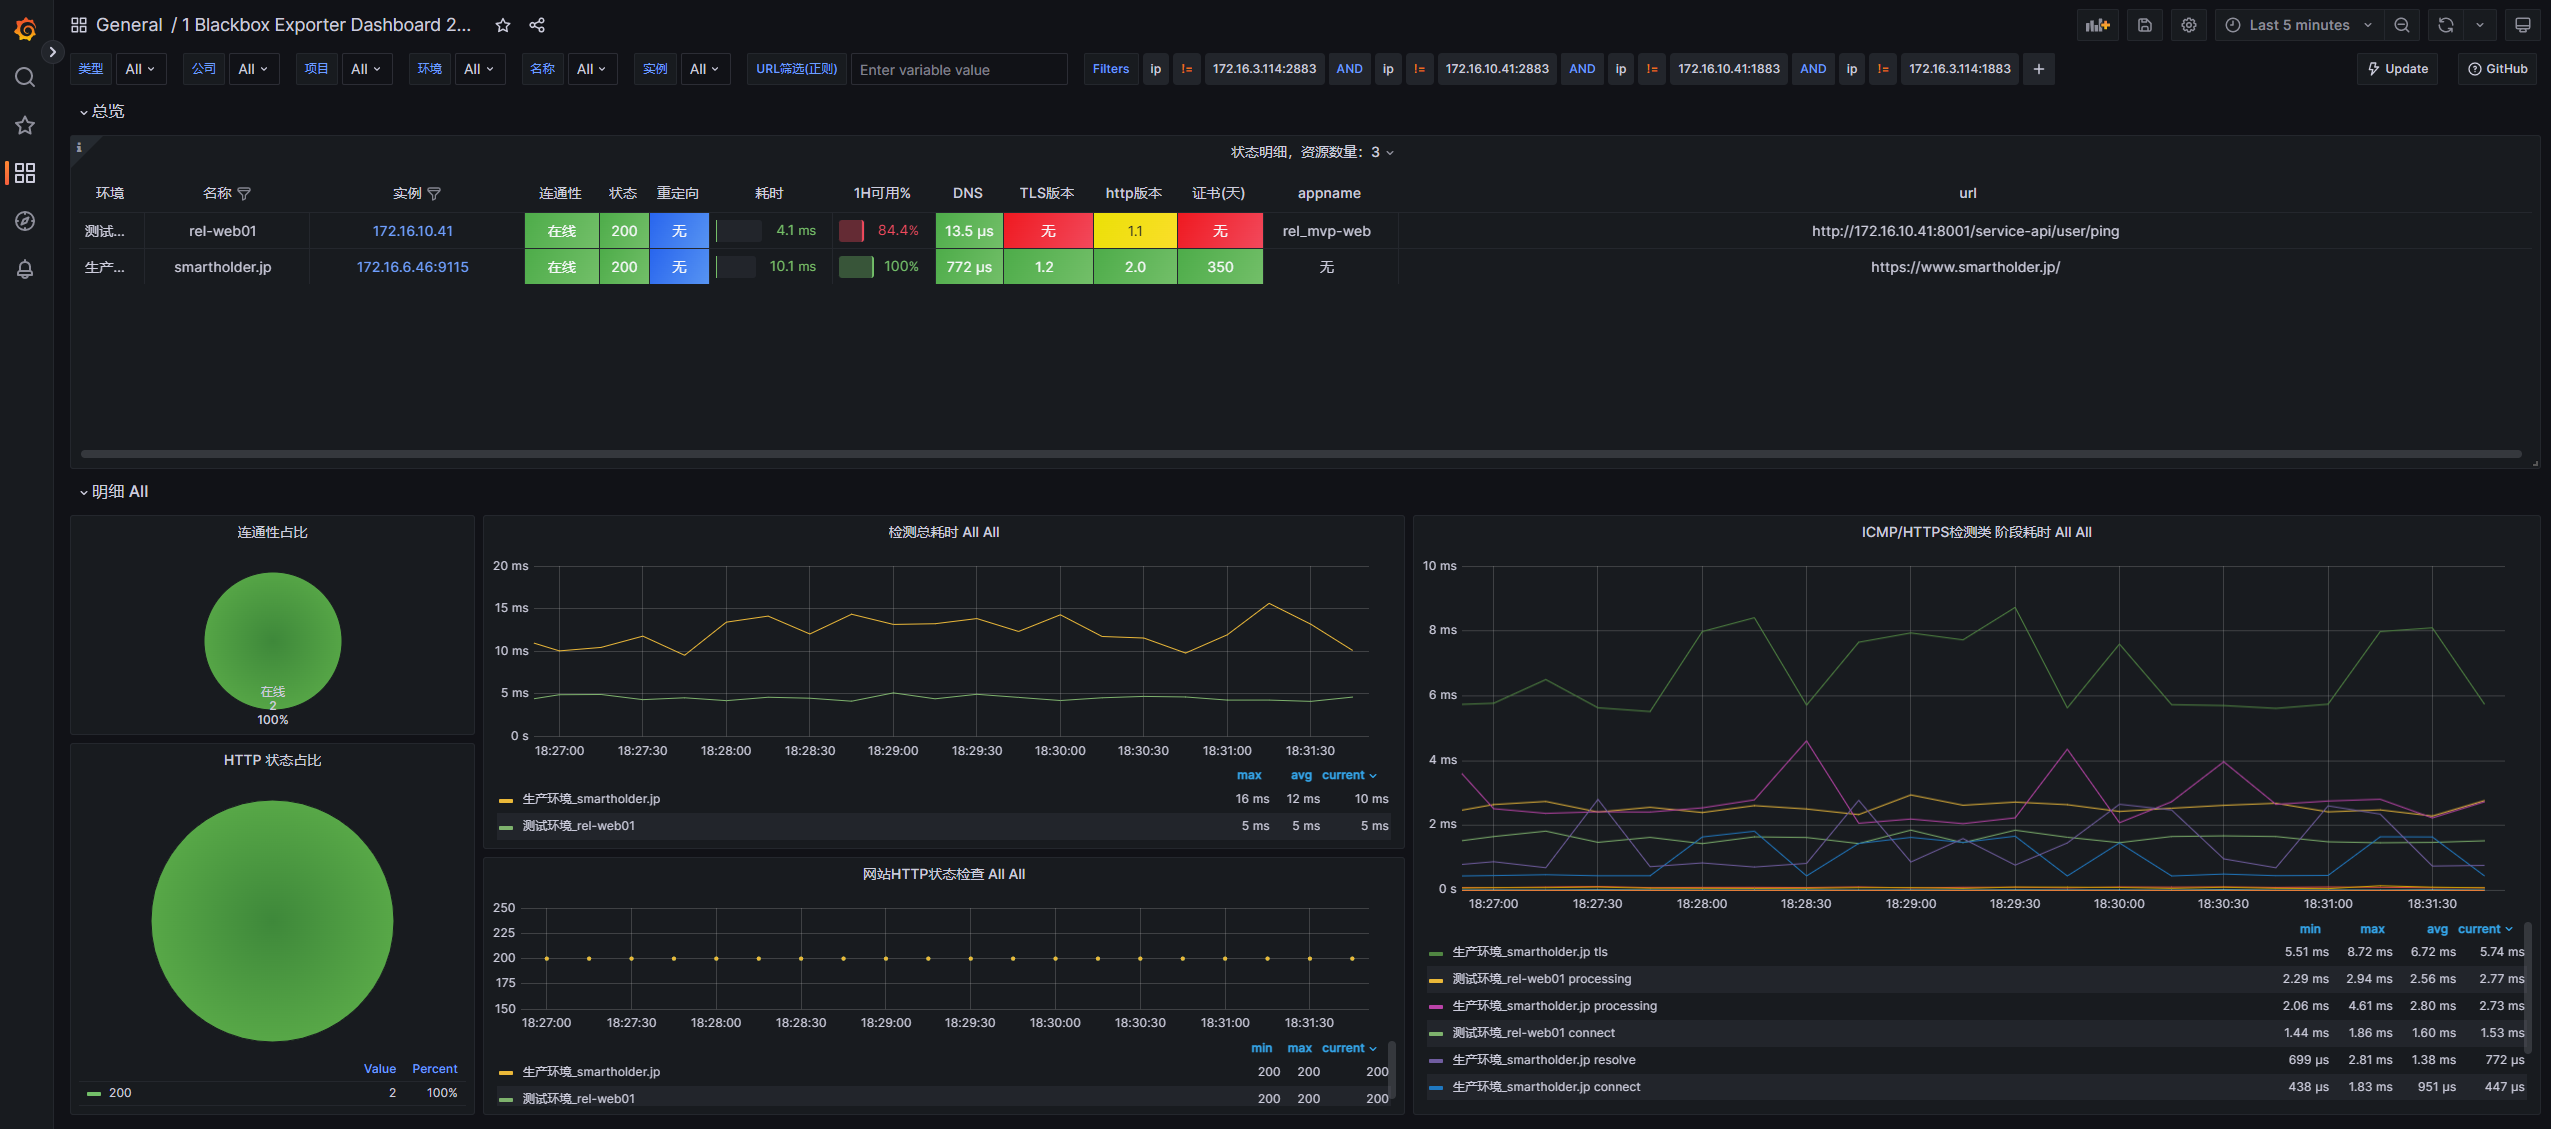
dashboard
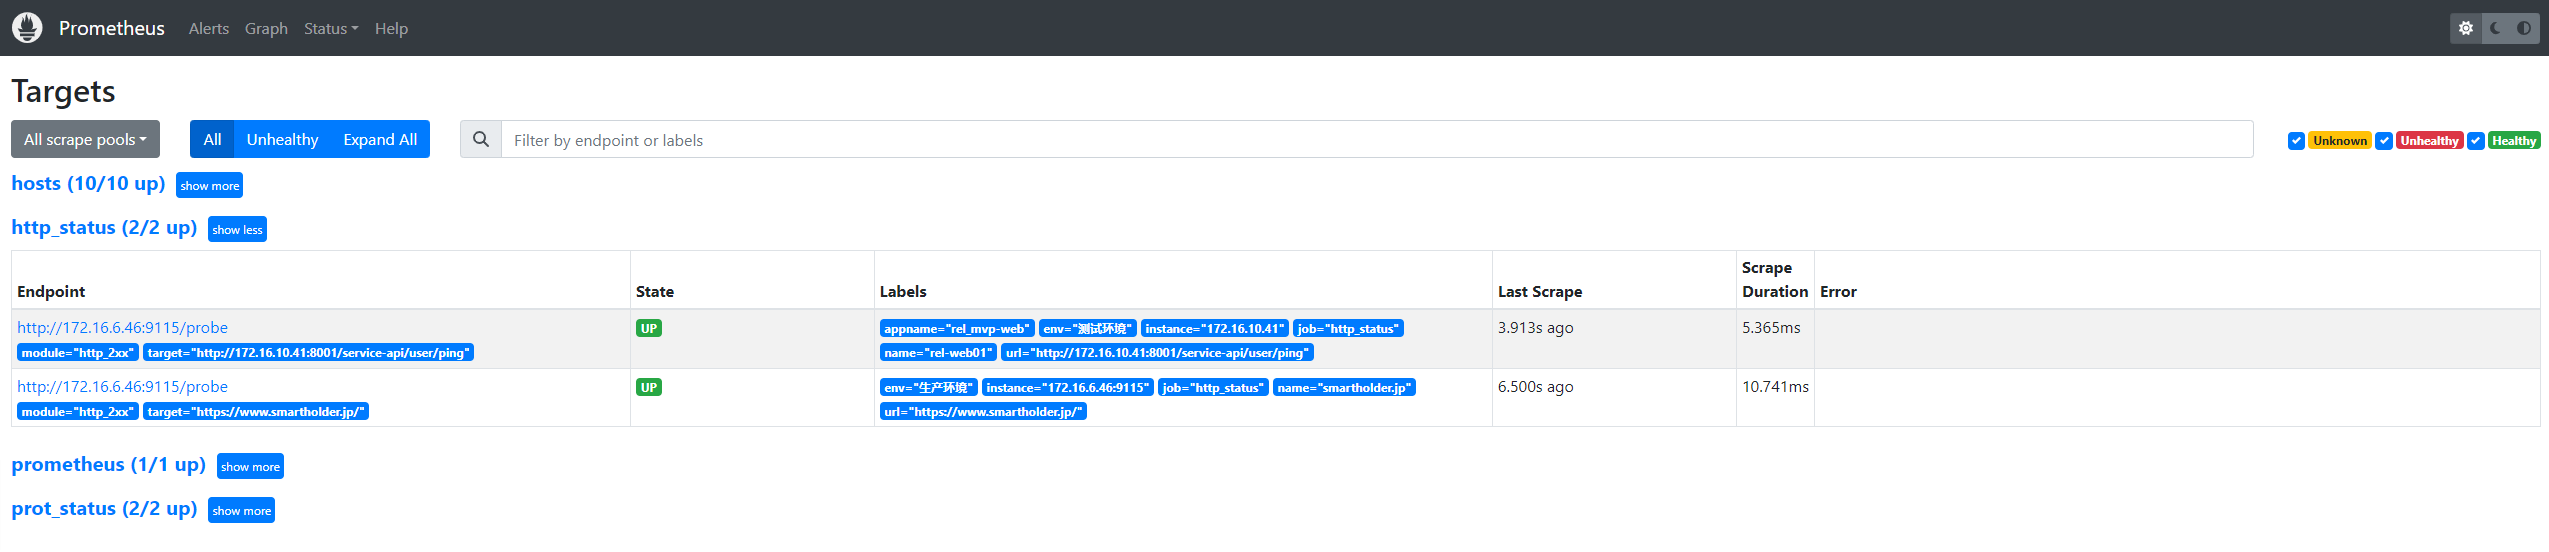
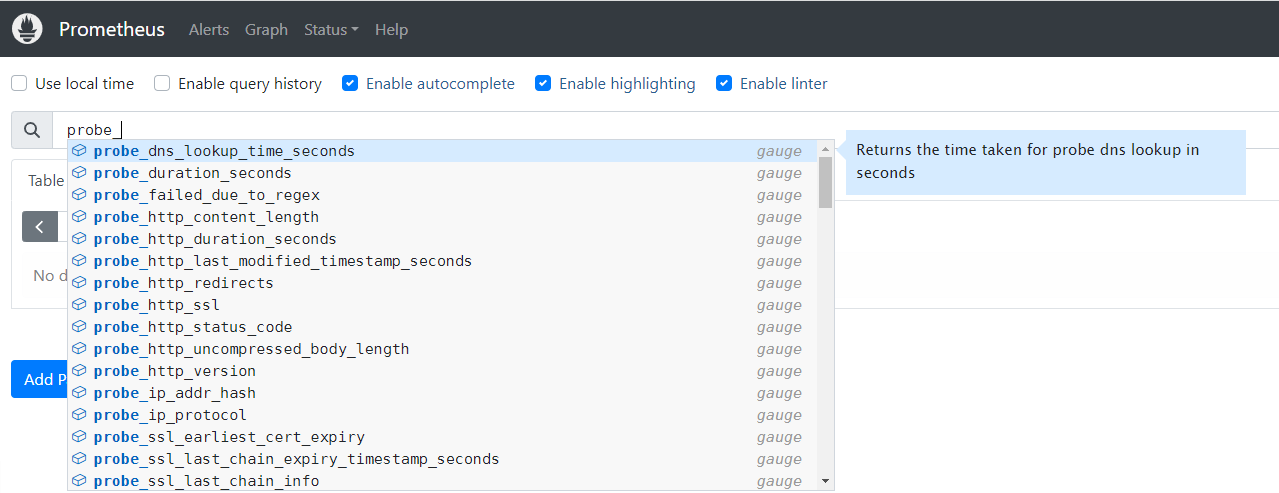
Metrics

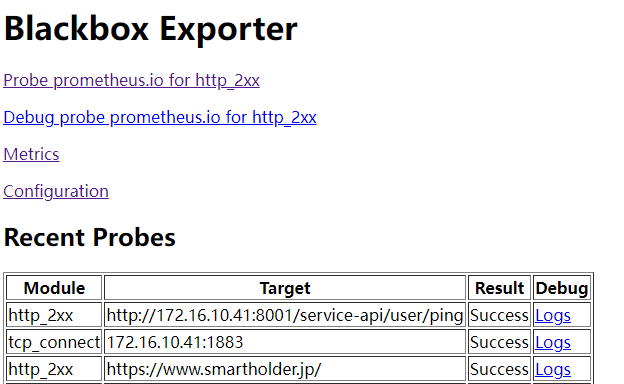
blackbox exporter
dashboard
Metrics
Metrics that would have been returned:
# HELP probe_dns_lookup_time_seconds Returns the time taken for probe dns lookup in seconds
# TYPE probe_dns_lookup_time_seconds gauge
probe_dns_lookup_time_seconds 0.002690504
# HELP probe_duration_seconds Returns how long the probe took to complete in seconds
# TYPE probe_duration_seconds gauge
probe_duration_seconds 0.015748441
# HELP probe_failed_due_to_regex Indicates if probe failed due to regex
# TYPE probe_failed_due_to_regex gauge
probe_failed_due_to_regex 0
# HELP probe_http_content_length Length of http content response
# TYPE probe_http_content_length gauge
probe_http_content_length 635
# HELP probe_http_duration_seconds Duration of http request by phase, summed over all redirects
# TYPE probe_http_duration_seconds gauge
probe_http_duration_seconds{phase="connect"} 0.001851038
probe_http_duration_seconds{phase="processing"} 0.002441911
probe_http_duration_seconds{phase="resolve"} 0.002690504
probe_http_duration_seconds{phase="tls"} 0.008390431
probe_http_duration_seconds{phase="transfer"} 6.379e-05
# HELP probe_http_last_modified_timestamp_seconds Returns the Last-Modified HTTP response header in unixtime
# TYPE probe_http_last_modified_timestamp_seconds gauge
probe_http_last_modified_timestamp_seconds 1.676253416e+09
# HELP probe_http_redirects The number of redirects
# TYPE probe_http_redirects gauge
probe_http_redirects 0
# HELP probe_http_ssl Indicates if SSL was used for the final redirect
# TYPE probe_http_ssl gauge
probe_http_ssl 1
# HELP probe_http_status_code Response HTTP status code
# TYPE probe_http_status_code gauge
probe_http_status_code 200
# HELP probe_http_uncompressed_body_length Length of uncompressed response body
# TYPE probe_http_uncompressed_body_length gauge
probe_http_uncompressed_body_length 635
# HELP probe_http_version Returns the version of HTTP of the probe response
# TYPE probe_http_version gauge
probe_http_version 2
# HELP probe_ip_addr_hash Specifies the hash of IP address. It's useful to detect if the IP address changes.
# TYPE probe_ip_addr_hash gauge
probe_ip_addr_hash 3.715176648e+09
# HELP probe_ip_protocol Specifies whether probe ip protocol is IP4 or IP6
# TYPE probe_ip_protocol gauge
probe_ip_protocol 4
# HELP probe_ssl_earliest_cert_expiry Returns last SSL chain expiry in unixtime
# TYPE probe_ssl_earliest_cert_expiry gauge
probe_ssl_earliest_cert_expiry 1.709769599e+09
# HELP probe_ssl_last_chain_expiry_timestamp_seconds Returns last SSL chain expiry in timestamp
# TYPE probe_ssl_last_chain_expiry_timestamp_seconds gauge
probe_ssl_last_chain_expiry_timestamp_seconds 1.709769599e+09
# HELP probe_ssl_last_chain_info Contains SSL leaf certificate information
# TYPE probe_ssl_last_chain_info gauge
probe_ssl_last_chain_info{fingerprint_sha256="10055046b7b481e3b1a486e1d8e6b6879e3ee384fed747d7091788ca76782af6",issuer="CN=Amazon RSA 2048 M01,O=Amazon,C=US",subject="CN=*.smartholder.jp",subjectalternative="*.smartholder.jp"} 1
# HELP probe_success Displays whether or not the probe was a success
# TYPE probe_success gauge
probe_success 1
# HELP probe_tls_version_info Returns the TLS version used or NaN when unknown
# TYPE probe_tls_version_info gauge
probe_tls_version_info{version="TLS 1.2"} 1
告警配置
url_status.yaml
groups:
- name: http_status
  rules:
  - alert: probe_http_status_code
    expr: probe_http_status_code != 200
    for: 1m
    labels:
      severity: critical
    annotations:
      summary: "{{ $labels.appname }}"
      description: "{{ $labels.env }} {{ $labels.name  }} 服务 {{ $labels.appname }} 异常, 请尽快检测"
      value: "{{ $value }}"
- name: check_ssl_status
  rules:
  - alert: "ssl证书过期警告"
    expr: (probe_ssl_earliest_cert_expiry - time())/86400 <30
    for: 1h
    labels:
      severity: warn
      status: 非常严重
    annotations:
      description: '域名{{$labels.name}}的证书还有{{ printf "%.1f" $value }}天就过期了,请尽快更新证书'
      summary: "ssl证书过期警告"
prometheus.yml
rule_files:
  - "rules/*.yaml"
  - "alert_rules/*.yaml"
告警信息
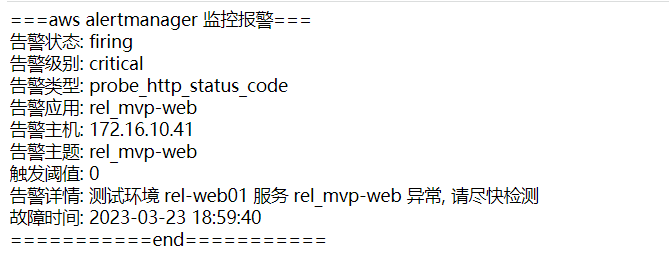
dashboard
推荐模板
推荐模板ID 9965
查看dashboard

 浙公网安备 33010602011771号