Prometheus安装
官方文档:https://prometheus.io/docs/prometheus/latest/installation/
一 使用包管理器下载
root@prometheus-01:~# apt-cache madison prometheus
prometheus | 2.15.2+ds-2 | http://mirrors.aliyun.com/ubuntu focal/universe amd64 Packages
二 使用镜像部署
root@prometheus-01:~# docker run -p 9090:9090 -v /path/to/prometheus.yml:/etc/prometheus/prometheus.yml prom/prometheus三 使用operator部署
github地址:https://github.com/prometheus-operator/kube-prometheus
3.1 下载代码
点击查看代码
root@k8s-master-01:~# root@k8s-master-01:~# git clone -b release-0.9 https://github.com/prometheus-operator/kube-prometheus.git
root@k8s-master-01:~/kube-prometheus/manifests# ls
alertmanager-alertmanager.yaml             grafana-deployment.yaml                              node-exporter-clusterRole.yaml                              prometheus-adapter-serviceAccount.yaml
alertmanager-podDisruptionBudget.yaml      grafana-service.yaml                                 node-exporter-clusterRoleBinding.yaml                       prometheus-adapter-serviceMonitor.yaml
alertmanager-prometheusRule.yaml           grafana-serviceAccount.yaml                          node-exporter-daemonset.yaml                                prometheus-clusterRole.yaml
alertmanager-secret.yaml                   grafana-serviceMonitor.yaml                          node-exporter-prometheusRule.yaml                           prometheus-clusterRoleBinding.yaml
alertmanager-service.yaml                  kube-prometheus-prometheusRule.yaml                  node-exporter-service.yaml                                  prometheus-operator-prometheusRule.yaml
alertmanager-serviceAccount.yaml           kube-state-metrics-clusterRole.yaml                  node-exporter-serviceAccount.yaml                           prometheus-operator-serviceMonitor.yaml
alertmanager-serviceMonitor.yaml           kube-state-metrics-clusterRoleBinding.yaml           node-exporter-serviceMonitor.yaml                           prometheus-podDisruptionBudget.yaml
blackbox-exporter-clusterRole.yaml         kube-state-metrics-deployment.yaml                   prometheus-adapter-apiService.yaml                          prometheus-prometheus.yaml
blackbox-exporter-clusterRoleBinding.yaml  kube-state-metrics-prometheusRule.yaml               prometheus-adapter-clusterRole.yaml                         prometheus-prometheusRule.yaml
blackbox-exporter-configuration.yaml       kube-state-metrics-service.yaml                      prometheus-adapter-clusterRoleAggregatedMetricsReader.yaml  prometheus-roleBindingConfig.yaml
blackbox-exporter-deployment.yaml          kube-state-metrics-serviceAccount.yaml               prometheus-adapter-clusterRoleBinding.yaml                  prometheus-roleBindingSpecificNamespaces.yaml
blackbox-exporter-service.yaml             kube-state-metrics-serviceMonitor.yaml               prometheus-adapter-clusterRoleBindingDelegator.yaml         prometheus-roleConfig.yaml
blackbox-exporter-serviceAccount.yaml      kubernetes-prometheusRule.yaml                       prometheus-adapter-clusterRoleServerResources.yaml          prometheus-roleSpecificNamespaces.yaml
blackbox-exporter-serviceMonitor.yaml      kubernetes-serviceMonitorApiserver.yaml              prometheus-adapter-configMap.yaml                           prometheus-service.yaml
grafana-config.yaml                        kubernetes-serviceMonitorCoreDNS.yaml                prometheus-adapter-deployment.yaml                          prometheus-serviceAccount.yaml
grafana-dashboardDatasources.yaml          kubernetes-serviceMonitorKubeControllerManager.yaml  prometheus-adapter-podDisruptionBudget.yaml                 prometheus-serviceMonitor.yaml
grafana-dashboardDefinitions.yaml          kubernetes-serviceMonitorKubeScheduler.yaml          prometheus-adapter-roleBindingAuthReader.yaml               setup
grafana-dashboardSources.yaml              kubernetes-serviceMonitorKubelet.yaml                prometheus-adapter-service.yaml
3.2 准备无法下载的imge
点击查看代码
root@k8s-master-01:~/kube-prometheus# grep -R "image:" manifests/*
manifests/alertmanager-alertmanager.yaml:  image: quay.io/prometheus/alertmanager:v0.22.2
manifests/blackbox-exporter-deployment.yaml:        image: quay.io/prometheus/blackbox-exporter:v0.19.0
manifests/blackbox-exporter-deployment.yaml:        image: jimmidyson/configmap-reload:v0.5.0
manifests/blackbox-exporter-deployment.yaml:        image: quay.io/brancz/kube-rbac-proxy:v0.11.0
manifests/grafana-deployment.yaml:        image: grafana/grafana:8.1.1
manifests/kube-state-metrics-deployment.yaml:        image: k8s.gcr.io/kube-state-metrics/kube-state-metrics:v2.1.1
manifests/kube-state-metrics-deployment.yaml:        image: quay.io/brancz/kube-rbac-proxy:v0.11.0
manifests/kube-state-metrics-deployment.yaml:        image: quay.io/brancz/kube-rbac-proxy:v0.11.0
manifests/node-exporter-daemonset.yaml:        image: quay.io/prometheus/node-exporter:v1.2.2
manifests/node-exporter-daemonset.yaml:        image: quay.io/brancz/kube-rbac-proxy:v0.11.0
manifests/prometheus-adapter-deployment.yaml:        image: k8s.gcr.io/prometheus-adapter/prometheus-adapter:v0.9.0
manifests/prometheus-prometheus.yaml:  image: quay.io/prometheus/prometheus:v2.29.1
manifests/setup/prometheus-operator-0thanosrulerCustomResourceDefinition.yaml:                    image:
manifests/setup/prometheus-operator-0thanosrulerCustomResourceDefinition.yaml:              image:
manifests/setup/prometheus-operator-0thanosrulerCustomResourceDefinition.yaml:                    image:
manifests/setup/prometheus-operator-0thanosrulerCustomResourceDefinition.yaml:                        image:
manifests/setup/prometheus-operator-deployment.yaml:        image: quay.io/prometheus-operator/prometheus-operator:v0.49.0
manifests/setup/prometheus-operator-deployment.yaml:        image: quay.io/brancz/kube-rbac-proxy:v0.11.0
3.3 Create the monitoring stack
点击查看代码
root@k8s-master-01:~/kube-prometheus# pwd
/root/kube-prometheus

root@k8s-master-01:~/kube-prometheus# kubectl create -f manifests/setup
namespace/monitoring created
customresourcedefinition.apiextensions.k8s.io/alertmanagerconfigs.monitoring.coreos.com created
customresourcedefinition.apiextensions.k8s.io/alertmanagers.monitoring.coreos.com created
customresourcedefinition.apiextensions.k8s.io/podmonitors.monitoring.coreos.com created
customresourcedefinition.apiextensions.k8s.io/probes.monitoring.coreos.com created
customresourcedefinition.apiextensions.k8s.io/prometheuses.monitoring.coreos.com created
customresourcedefinition.apiextensions.k8s.io/prometheusrules.monitoring.coreos.com created
customresourcedefinition.apiextensions.k8s.io/servicemonitors.monitoring.coreos.com created
customresourcedefinition.apiextensions.k8s.io/thanosrulers.monitoring.coreos.com created
clusterrole.rbac.authorization.k8s.io/prometheus-operator created
clusterrolebinding.rbac.authorization.k8s.io/prometheus-operator created
deployment.apps/prometheus-operator created
service/prometheus-operator created
serviceaccount/prometheus-operator created

root@k8s-master-01:~/kube-prometheus# kubectl create -f manifests/
3.4 验证pod
需要自己提前下载好google镜像
点击查看代码
root@k8s-master-01:~/kube-prometheus# kubectl get pod -n monitoring
NAME                                   READY   STATUS             RESTARTS   AGE
alertmanager-main-0                    2/2     Running            0          9m5s
alertmanager-main-1                    2/2     Running            0          9m5s
alertmanager-main-2                    2/2     Running            0          9m5s
blackbox-exporter-6798fb5bb4-mrwv2     3/3     Running            0          9m5s
grafana-7476b4c65b-9wlnp               1/1     Running            0          9m3s
kube-state-metrics-74964b6cd4-hddqc    2/3     ImagePullBackOff   0          9m3s
node-exporter-5wcjb                    2/2     Running            0          9m2s
node-exporter-f4vrh                    2/2     Running            0          9m2s
node-exporter-h662w                    2/2     Running            0          9m2s
node-exporter-lgt2v                    2/2     Running            0          9m2s
node-exporter-mx7xc                    2/2     Running            0          9m2s
node-exporter-n2742                    2/2     Running            0          9m2s
prometheus-adapter-8587b9cf9b-b4scn    0/1     ImagePullBackOff   0          9m
prometheus-adapter-8587b9cf9b-pgkrl    0/1     ErrImagePull       0          9m
prometheus-k8s-0                       2/2     Running            0          9m
prometheus-k8s-1                       2/2     Running            0          8m59s
prometheus-operator-75d9b475d9-kwlwk   2/2     Running            0          11m


root@k8s-master-01:~/kube-prometheus# kubectl get svc -n monitoring
NAME                    TYPE        CLUSTER-IP       EXTERNAL-IP   PORT(S)                      AGE
alertmanager-main       ClusterIP   10.100.110.105   <none>        9093/TCP                     14m
alertmanager-operated   ClusterIP   None             <none>        9093/TCP,9094/TCP,9094/UDP   14m
blackbox-exporter       ClusterIP   10.100.255.101   <none>        9115/TCP,19115/TCP           14m
grafana                 ClusterIP   10.100.169.229   <none>        3000/TCP                     14m
kube-state-metrics      ClusterIP   None             <none>        8443/TCP,9443/TCP            14m
node-exporter           ClusterIP   None             <none>        9100/TCP                     14m
prometheus-adapter      ClusterIP   10.100.150.112   <none>        443/TCP                      14m
prometheus-k8s          ClusterIP   10.100.176.132   <none>        9090/TCP                     14m
prometheus-operated     ClusterIP   None             <none>        9090/TCP                     14m
prometheus-operator     ClusterIP   None             <none>        8443/TCP                     16m
3.5 暴露Prometheus
点击查看代码
root@k8s-master-01:~/kube-prometheus# cat manifests/prometheus-service.yaml
apiVersion: v1
kind: Service
metadata:
labels:
app.kubernetes.io/component: prometheus
app.kubernetes.io/name: prometheus
app.kubernetes.io/part-of: kube-prometheus
app.kubernetes.io/version: 2.29.1
prometheus: k8s
name: prometheus-k8s
namespace: monitoring
spec:
type: NodePort
ports:
- name: web
port: 9090
targetPort: web
nodePort: 39090
selector:
app: prometheus
app.kubernetes.io/component: prometheus
app.kubernetes.io/name: prometheus
app.kubernetes.io/part-of: kube-prometheus
prometheus: k8s
sessionAffinity: ClientIP
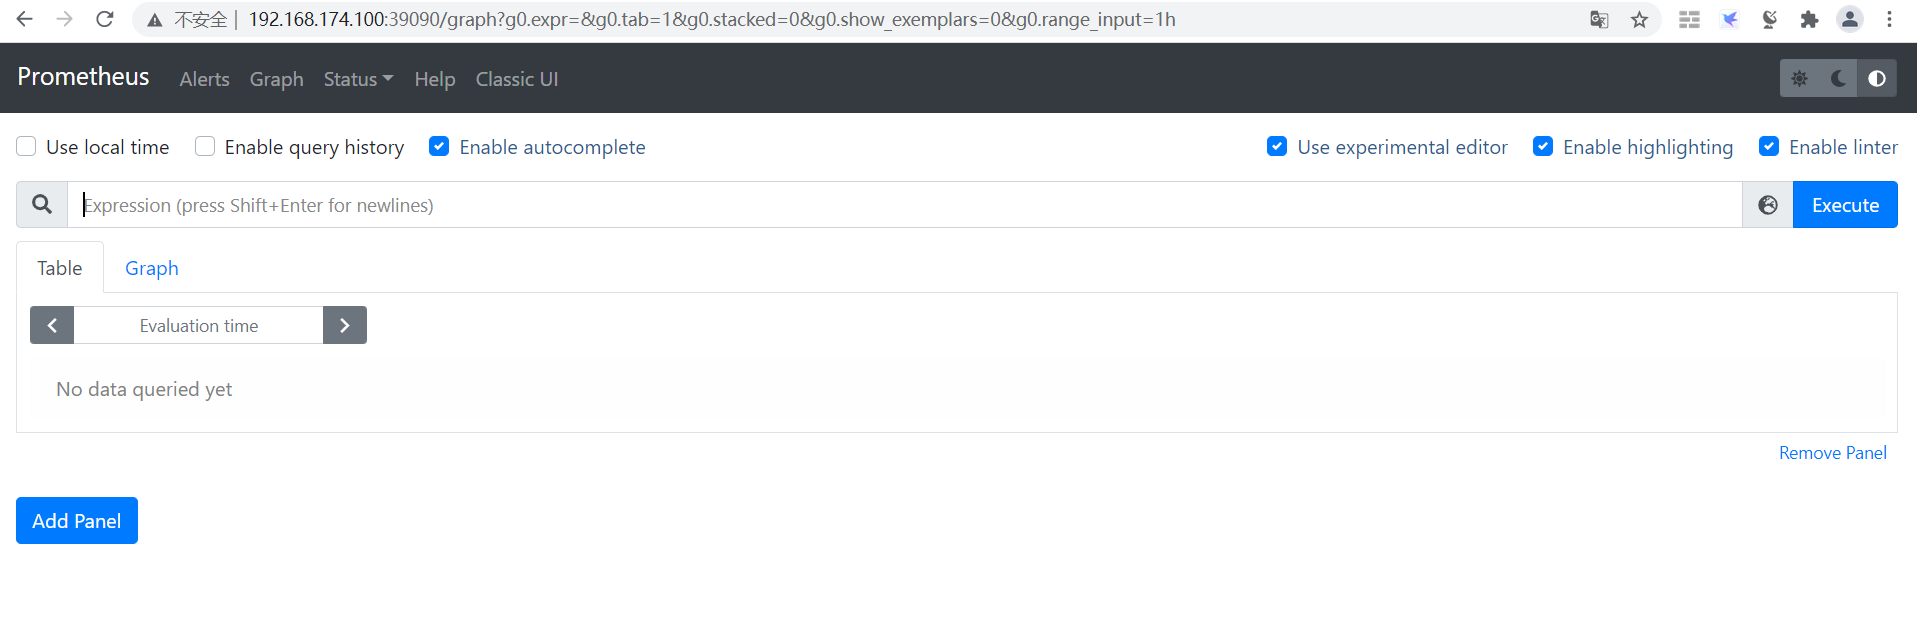
root@k8s-master-01:~/kube-prometheus# kubectl apply -f manifests/prometheus-service.yaml 3.6 访问Prometheus
3.7 暴露grafana
点击查看代码
root@k8s-master-01:~/kube-prometheus# cat manifests/grafana-service.yaml
apiVersion: v1
kind: Service
metadata:
labels:
app.kubernetes.io/component: grafana
app.kubernetes.io/name: grafana
app.kubernetes.io/part-of: kube-prometheus
app.kubernetes.io/version: 8.1.1
name: grafana
namespace: monitoring
spec:
type: NodePort
ports:
- name: http
port: 3000
nodePort: 33000
targetPort: http
selector:
app.kubernetes.io/component: grafana
app.kubernetes.io/name: grafana
app.kubernetes.io/part-of: kube-prometheus
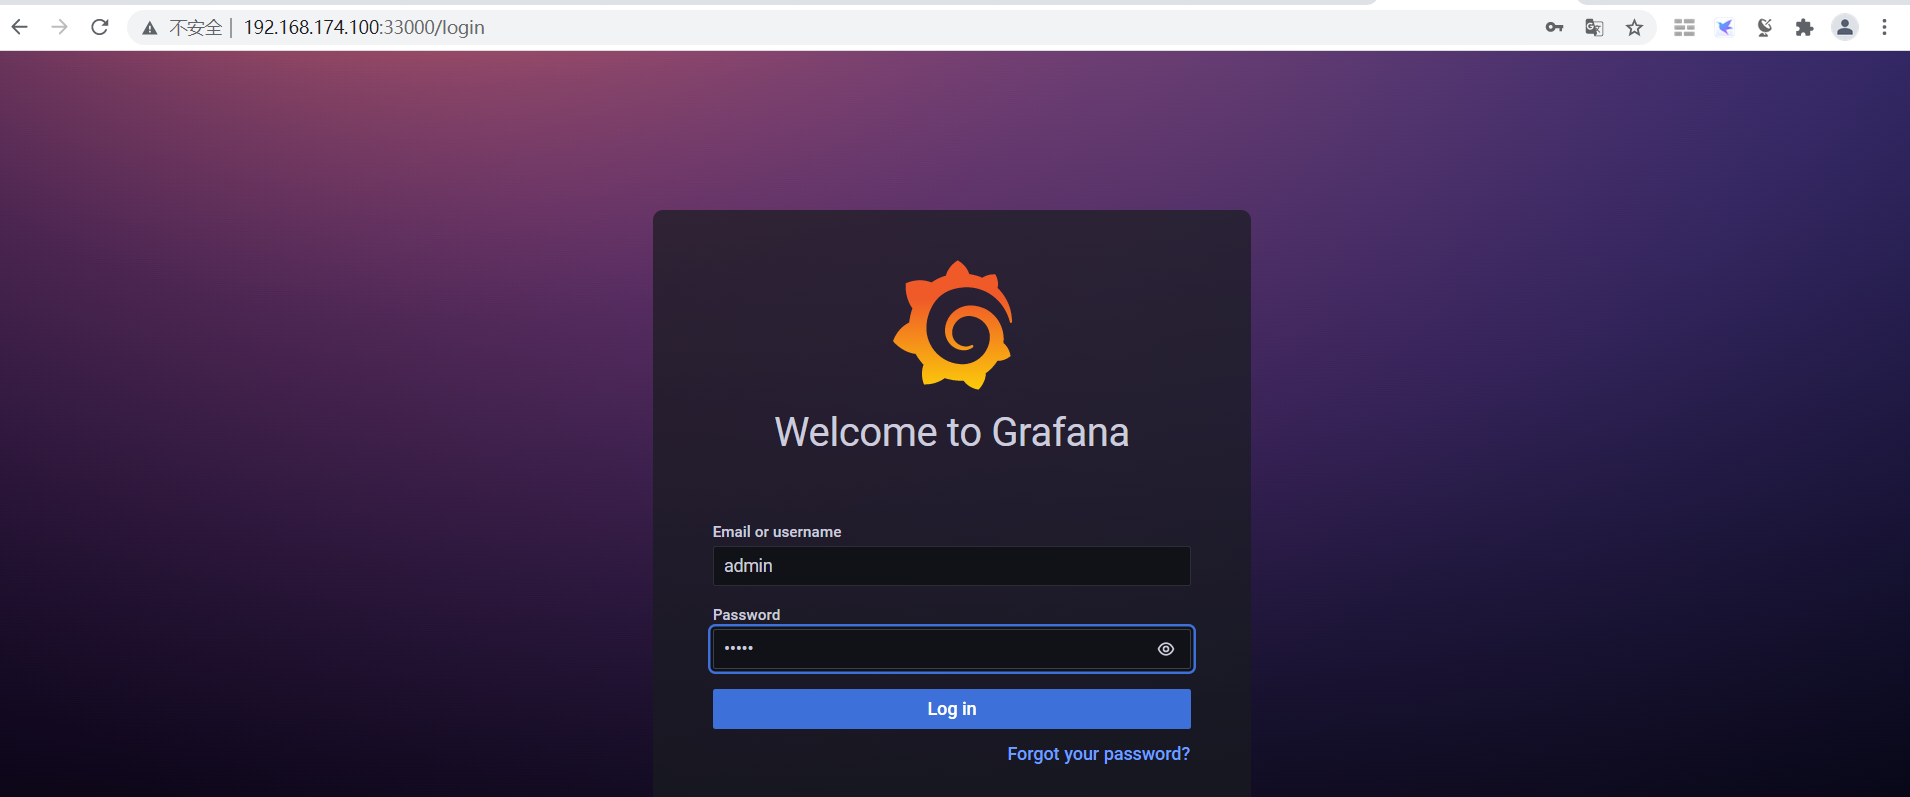
root@k8s-master-01:~/kube-prometheus# kubectl apply -f manifests/grafana-service.yaml 3.8 访问grafana
用户名:admin 密码:admin
3.9 修改grafana模板
3.9.1 查看configmap
点击查看代码
root@k8s-master-01:~/kube-prometheus# kubectl get configmap -n monitoring
NAME                                                  DATA   AGE
adapter-config                                        1      30m
blackbox-exporter-configuration                       1      30m
grafana-dashboard-alertmanager-overview               1      30m
grafana-dashboard-apiserver                           1      30m
grafana-dashboard-cluster-total                       1      30m
grafana-dashboard-controller-manager                  1      30m
grafana-dashboard-k8s-resources-cluster               1      30m
grafana-dashboard-k8s-resources-namespace             1      30m
grafana-dashboard-k8s-resources-node                  1      30m
grafana-dashboard-k8s-resources-pod                   1      30m
grafana-dashboard-k8s-resources-workload              1      30m
grafana-dashboard-k8s-resources-workloads-namespace   1      30m
grafana-dashboard-kubelet                             1      30m
grafana-dashboard-namespace-by-pod                    1      30m
grafana-dashboard-namespace-by-workload               1      30m
grafana-dashboard-node-cluster-rsrc-use               1      30m
grafana-dashboard-node-rsrc-use                       1      30m
grafana-dashboard-nodes                               1      30m
grafana-dashboard-persistentvolumesusage              1      30m
grafana-dashboard-pod-total                           1      30m
grafana-dashboard-prometheus                          1      30m
grafana-dashboard-prometheus-remote-write             1      30m
grafana-dashboard-proxy                               1      30m
grafana-dashboard-scheduler                           1      30m
grafana-dashboard-workload-total                      1      30m
grafana-dashboards                                    1      30m
kube-root-ca.crt                                      1      33m
prometheus-k8s-rulefiles-0                            7      30m
3.9.2 修改configmap
root@k8s-master-01:~/kube-prometheus# kubectl edit configmap blackbox-exporter-configuration -n monitoring3.10 删除Prometheus
root@k8s-master-01:~/kube-prometheus# kubectl delete --ignore-not-found=true -f manifests/ -f manifests/setup四 二进制部署
4.1 下载Prometheus
下载地址:https://prometheus.io/download/
root@prometheus-01:~# wget https://github.com/prometheus/prometheus/releases/download/v2.31.1/prometheus-2.31.1.linux-amd64.tar.gz4.2 安装Prometheus
/usr/local/prometheus/prometheus.yml #配置文件
/usr/local/prometheus/prometheus #prometheus服务可执行程序
/usr/local/prometheus/promtool #测试工具,用于检测配置prometheus配置文件、检测metrics数据等。
/usr/local/prometheus/data #默认存放数据目录
root@prometheus-01:~# tar xf prometheus-2.31.1.linux-amd64.tar.gz -C /usr/local
root@prometheus-01:~# ln -sv /usr/local/prometheus-2.31.1.linux-amd64/ /usr/local/prometheus
'/usr/local/prometheus' -> '/usr/local/prometheus-2.31.1.linux-amd64/'
4.3 验证Prometheus版本信息
root@prometheus-01:~# /usr/local/prometheus/prometheus --version
prometheus, version 2.31.1 (branch: HEAD, revision: 411021ada9ab41095923b8d2df9365b632fd40c3)
  build user:       root@9419c9c2d4e0
  build date:       20211105-20:35:02
  go version:       go1.17.3
  platform:         linux/amd64
4.4 添加prometheus.service文件
cat >> /lib/systemd/system/prometheus.service << EOF
[Unit]
Descripton=prometheus server
Documentation=https://prometheus.io/docs/introduction/overview/
After=network.target

[Service]
Restart=on-failure
WorkingDirectory=/usr/local/prometheus
ExecStart=/usr/local/prometheus/prometheus --config.file=/usr/local/prometheus/prometheus.yml

[Install]
WantedBy=multi-user.target
EOF
4.5 设置开机启动
点击查看代码
root@prometheus-01:~# systemctl enable prometheus
Created symlink /etc/systemd/system/multi-user.target.wants/prometheus.service → /lib/systemd/system/prometheus.service.
root@prometheus-01:~# systemctl start prometheus
root@prometheus-01:~# systemctl status prometheus
● prometheus.service
Loaded: loaded (/lib/systemd/system/prometheus.service; enabled; vendor preset: enabled)
Active: active (running) since Mon 2021-11-15 23:44:03 CST; 3s ago
Docs: https://prometheus.io/docs/introduction/overview/
Main PID: 5590 (prometheus)
Tasks: 7 (limit: 2245)
Memory: 18.2M
CGroup: /system.slice/prometheus.service
└─5590 /usr/local/prometheus/prometheus --config.file=/usr/local/prometheus/prometheus.yml
Nov 15 23:44:04 prometheus-01 prometheus[5590]: ts=2021-11-15T15:44:04.215Z caller=head.go:479 level=info component=tsdb msg=>
Nov 15 23:44:04 prometheus-01 prometheus[5590]: ts=2021-11-15T15:44:04.215Z caller=head.go:513 level=info component=tsdb msg=>
Nov 15 23:44:04 prometheus-01 prometheus[5590]: ts=2021-11-15T15:44:04.215Z caller=head.go:519 level=info component=tsdb msg=>
Nov 15 23:44:04 prometheus-01 prometheus[5590]: ts=2021-11-15T15:44:04.216Z caller=head.go:590 level=info component=tsdb msg=>
Nov 15 23:44:04 prometheus-01 prometheus[5590]: ts=2021-11-15T15:44:04.216Z caller=head.go:596 level=info component=tsdb msg=>
Nov 15 23:44:04 prometheus-01 prometheus[5590]: ts=2021-11-15T15:44:04.225Z caller=main.go:866 level=info fs_type=EXT4_SUPER_>
Nov 15 23:44:04 prometheus-01 prometheus[5590]: ts=2021-11-15T15:44:04.225Z caller=main.go:869 level=info msg="TSDB started"
Nov 15 23:44:04 prometheus-01 prometheus[5590]: ts=2021-11-15T15:44:04.225Z caller=main.go:996 level=info msg="Loading config>
Nov 15 23:44:04 prometheus-01 prometheus[5590]: ts=2021-11-15T15:44:04.235Z caller=main.go:1033 level=info msg="Completed loa>
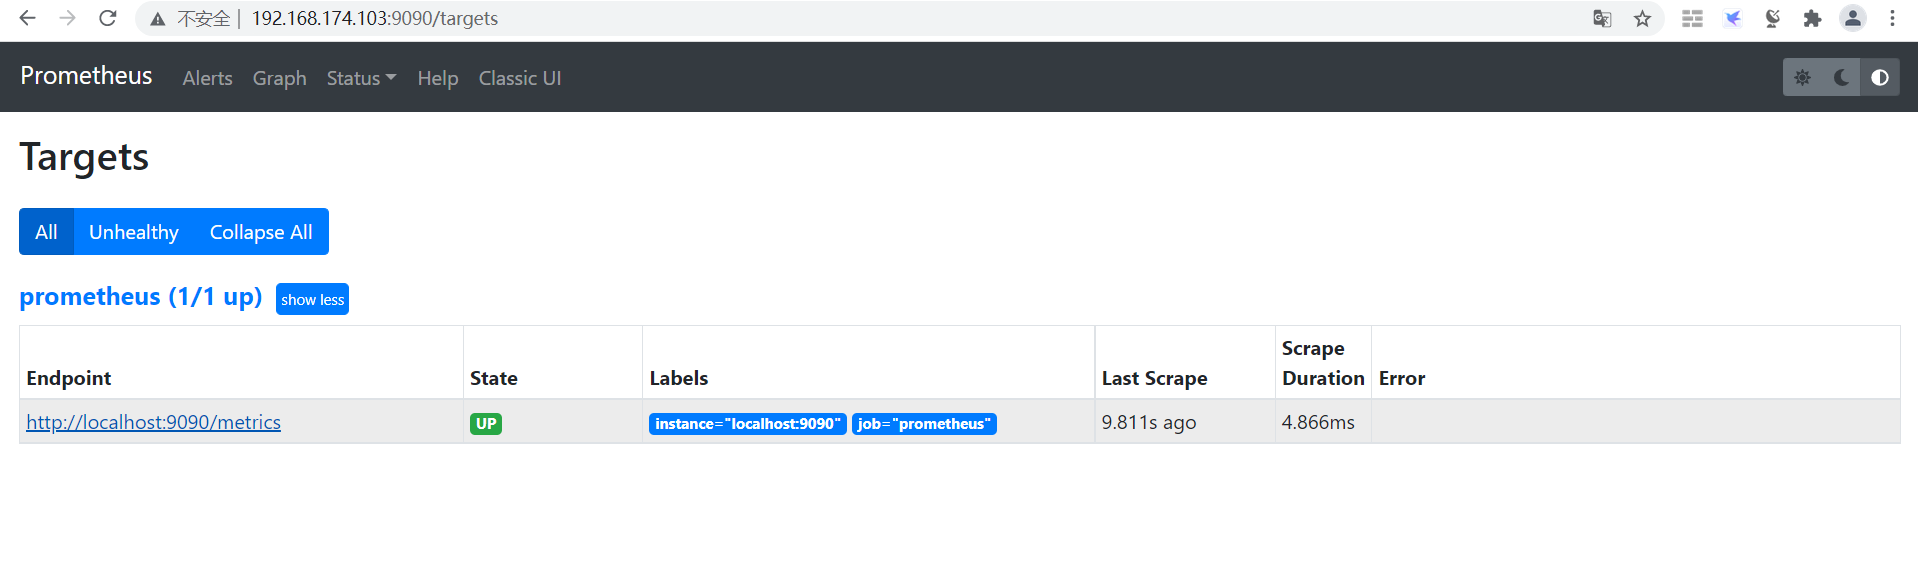
Nov 15 23:44:04 prometheus-01 prometheus[5590]: ts=2021-11-15T15:44:04.235Z caller=main.go:811 level=info msg="Server is read>4.6 访问Prometheus web界面