
blackbox
blackbox 是go 语言编写,通过http https icmp dns tcp 来探测端点并返回指标给promethues
第一步:安装blackbox
blackbox 默认配置blackbox.yml可以不做任何修改,具体监控项在prometheus.yml中。下载
-
下载
wget https://github.com/prometheus/blackbox_exporter/releases/download/v0.24.0/blackbox_exporter-0.24.0.linux-amd64.tar.gztar xf blackbox_exporter-0.24.0.linux-amd64.tar.gz -
修改配置
注释:prober 英文释义 探测器
默认配置文件 cat blackbox.yml
modules: http_2xx: prober: http http: preferred_ip_protocol: "ip4" http_post_2xx: prober: http http: method: POST tcp_connect: prober: tcp pop3s_banner: prober: tcp tcp: query_response: - expect: "^+OK" tls: true tls_config: insecure_skip_verify: false grpc: prober: grpc grpc: tls: true preferred_ip_protocol: "ip4" grpc_plain: prober: grpc grpc: tls: false service: "service1" ssh_banner: prober: tcp tcp: query_response: - expect: "^SSH-2.0-" - send: "SSH-2.0-blackbox-ssh-check" irc_banner: prober: tcp tcp: query_response: - send: "NICK prober" - send: "USER prober prober prober :prober" - expect: "PING :([^ ]+)" send: "PONG ${1}" - expect: "^:[^ ]+ 001" icmp: prober: icmp icmp_ttl5: prober: icmp timeout: 5s icmp: ttl: 5 -
启动blackbox
# 监听:9155 ./blackbox_exporter -
功能验证,
probe_success 1表示探测成功curl -s http://10.4.7.251:9115/probe?module=http_2xx&target=www.baidu.com|grep -i "probe_success"probe_success 1
第二步: 在prometheus中添加监控
prometheus.yml事例中以http_2xx和 icmp 模块为例
  - job_name: 'blackbox-http'
    metrics_path: /probe
    params:
      module: [http_2xx]  # 指定模块
    static_configs:
      - targets:
        - http://prometheus.io    # Target to probe with http.
        - https://prometheus.io   # Target to probe with https.
        - http://example.com:8080 # Target to probe with http on port 8080.
        - https://www.baidu.com
    relabel_configs:
      - source_labels: [__address__]
        target_label: __param_target
      - source_labels: [__param_target]
        target_label: instance
      - target_label: __address__
        replacement: 10.4.7.50:9115
  - job_name: 'blackbox-icmp'
    metrics_path: /probe
    params:
      module: [icmp]  # 指定模块
    static_configs:
      - targets:
        - 8.8.8.8
        - 10.4.7.254
        - 10.4.7.11
    relabel_configs:
      - source_labels: [__address__]
        target_label: __param_target
      - source_labels: [__param_target]
        target_label: instance
      - target_label: __address__
        replacement: 10.4.7.50:9115
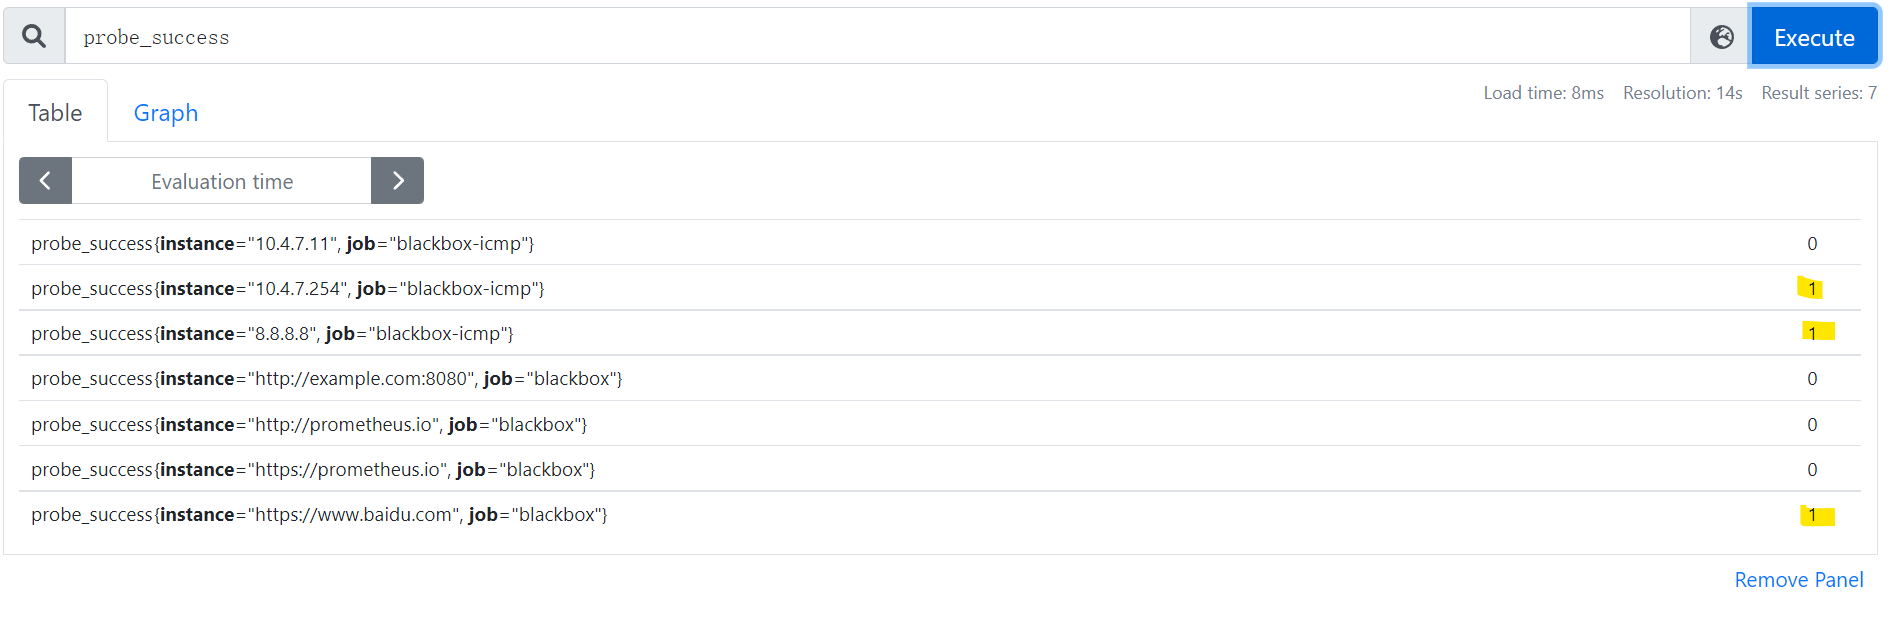
第三步: 在prometheus中查看监控项,probe_success=1 表示在线
| 主要指标 | 解释 | |
|---|---|---|
probe_dns_lookup_time_seconds |
dns解析耗时 | |
probe_duration_seconds |
探测耗时 | |
probe_http_status_code |
解析状态码 | 200 |
probe_success |
探测是否成功 |

 浙公网安备 33010602011771号