Filebeat收集日志
Filebeat收集日志
Filebeat介绍
Filebeat附带预构建的模块,这些模块包含收集、解析、充实和可视化各种日志文件格式数据所需的配置,每个Filebeat模块由一个或多个文件集组成,这些文件集包含摄取节点管道、Elasticsearch模板、Filebeat勘探者配置和Kibana仪表盘。
Filebeat模块很好的入门,它是轻量级单用途的日志收集工具,用于在没有安装java的服务器上专门收集日志,可以将日志转发到logstash、elasticsearch或redis等场景中进行下一步处理。
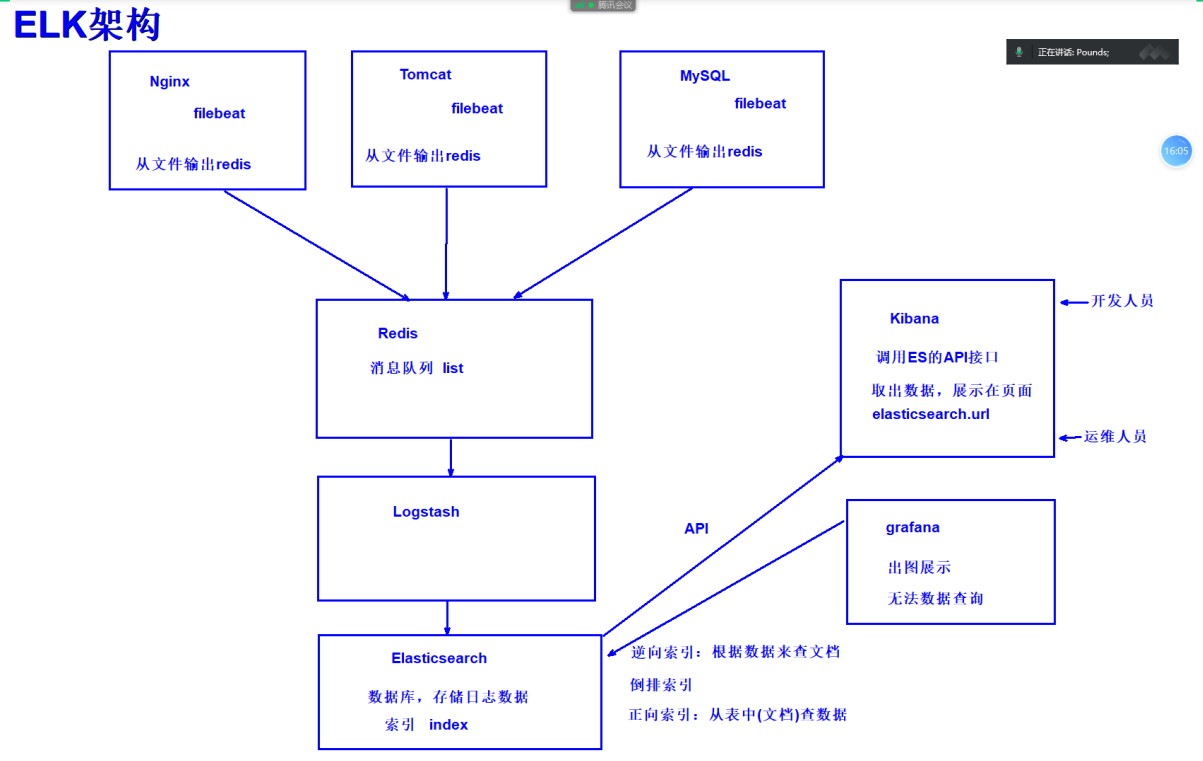
ELK架构
insert into mysql.user values (‘localhost’,’root’,PASSWORD(‘123’),
‘Y’,
‘Y’,
‘Y’,
‘Y’,
‘Y’,
‘Y’,
‘Y’,
‘Y’,
‘Y’,
‘Y’,
‘Y’,
‘Y’,
‘Y’,
‘Y’,
‘Y’,
‘Y’,
‘Y’,
’Y’,
’Y’,
’Y’,
’Y’,
’Y’,
’Y’,
’Y’,
’Y’,
’Y’,
’Y’,
’Y’,
’Y’,
’’,
’’,
’’,
’’,0,0,0,0,’mysql_native_password’,’’,’N’);
filebeat安装部署
官网下载地址:https://www.elastic.co/downloads/beats/filebeat
# 1.下载

# 2.安装
[root@elkstack03 ~]# yum localinstall -y filebeat-5.6.16-x86_64.rpm

# 3.备份原有配置文件
[root@elkstack03 ~]# cp /etc/filebeat/filebeat.yml{,.bak}
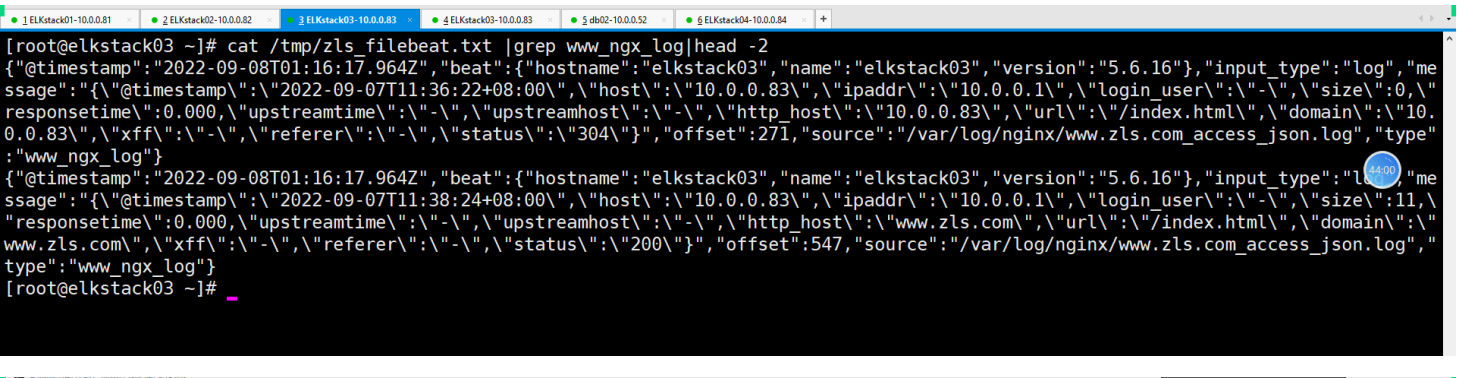
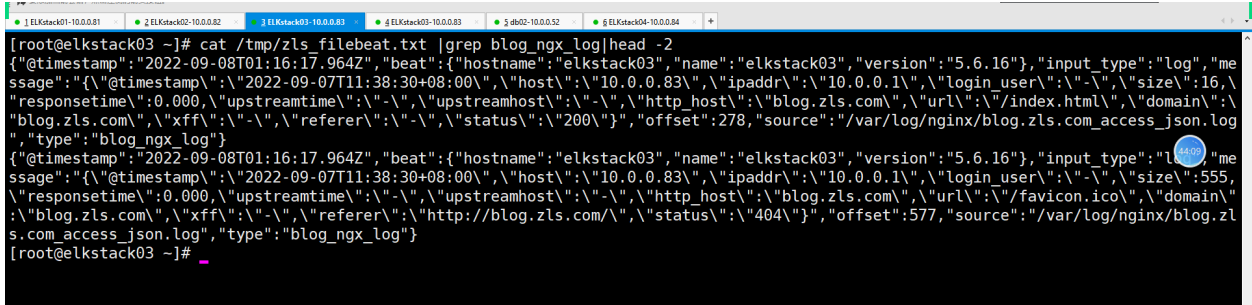
filebeat收集日志输出到文件
[root@elkstack03 ~]# vim /etc/filebeat/filebeat.yml
filebeat.prospectors:
- input_type: log
  paths:
    - /var/log/nginx/blog.zls.com_access_json.log
#不收集的行
  exclude_lines: ["^DBG","^$"]
#日志类型
  document_type: blog_ngx_log

- input_type: log
  paths:
    - /var/log/nginx/www.zls.com_access_json.log
#不收集的行
  exclude_lines: ["^DBG","^$"]
#日志类型
  document_type: www_ngx_log


output.file:
  path: "/tmp"
  filename: "zls_filebeat.txt"

# 启动filebeat
[root@elkstack03 ~]# systemctl start filebeat
filebeat从文件输出到Logstash
filebeat配置
[root@elkstack03 ~]# vi /etc/filebeat/filebeat.yml
filebeat.prospectors:
- input_type: log
  paths:
    - /var/log/nginx/blog.zls.com_access_json.log
  exclude_lines: ["^DBG","^$"]
  document_type: ngx_zls

output.logstash:
#logstash 服务器地址,可以是多个
  hosts: ["10.0.0.84:6666"]
#是否开启输出至logstash,默认即为true
  enabled: true
#工作线程数
  worker: 1
#压缩级别
  compression_level: 3
#多个输出的时候开启负载
#  loadbalance: true

[root@elkstack03 ~]# systemctl start filebeat
[root@elkstack03 ~]# ps -ef|grep filebeat
root      27833      1  0 09:39 ?        00:00:00 /usr/share/filebeat/bin/filebeat -c /etc/filebeat/filebeat.yml -path.home /usr/sharefilebeat -path.config /etc/filebeat -path.data /var/lib/filebeat -path.logs /var/log/filebeat
Logstash配置
[root@elkstack04 ~]# vim /etc/logstash/conf.d/beats_es.conf
input{
        beats{
                port => "6666"
                codec => "json"
        }
}

filter{
        json{
                source =>  "message"
                remove_field => "message"
        }
}

output{
        elasticsearch{
                hosts => ["10.0.0.81:9200"]
                index => "%{type}-%{+yyyy.MM.dd}"
                codec => "json"
        }
}

[root@elkstack04 ~]# echo 'PATH="/usr/share/logstash/bin:$PATH"' > /etc/profile.d/logstash.sh
[root@elkstack04 ~]# source /etc/profile
[root@elkstack04 ~]# logstash -f /etc/logstash/conf.d/beats_es.conf
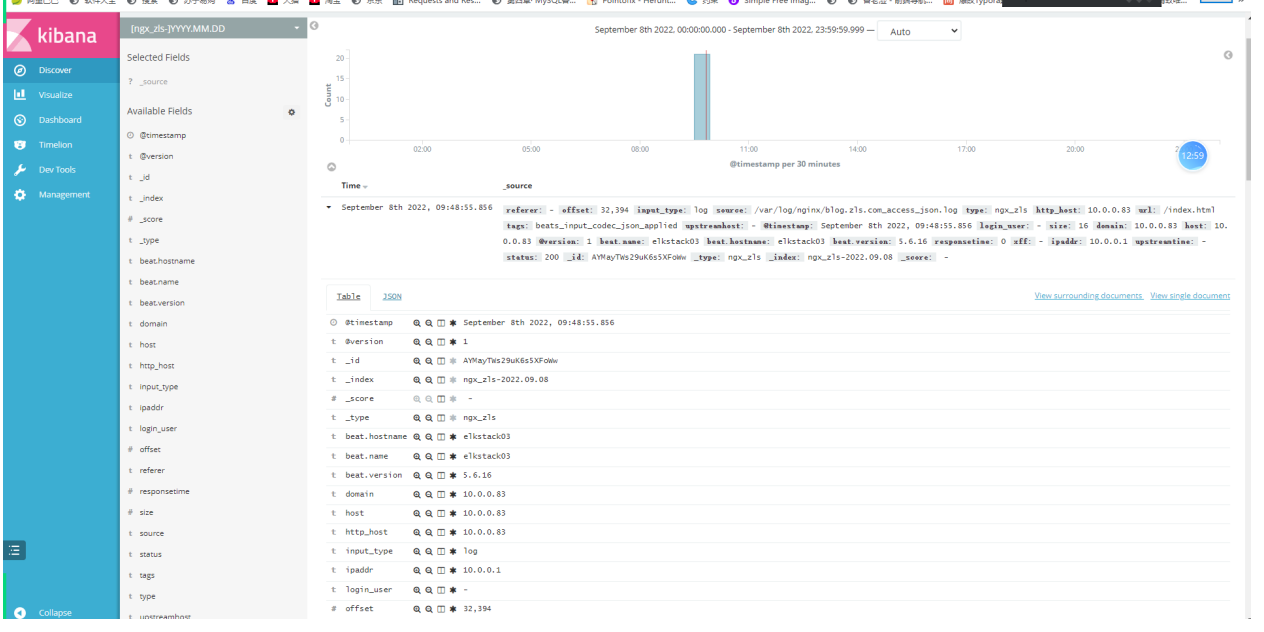
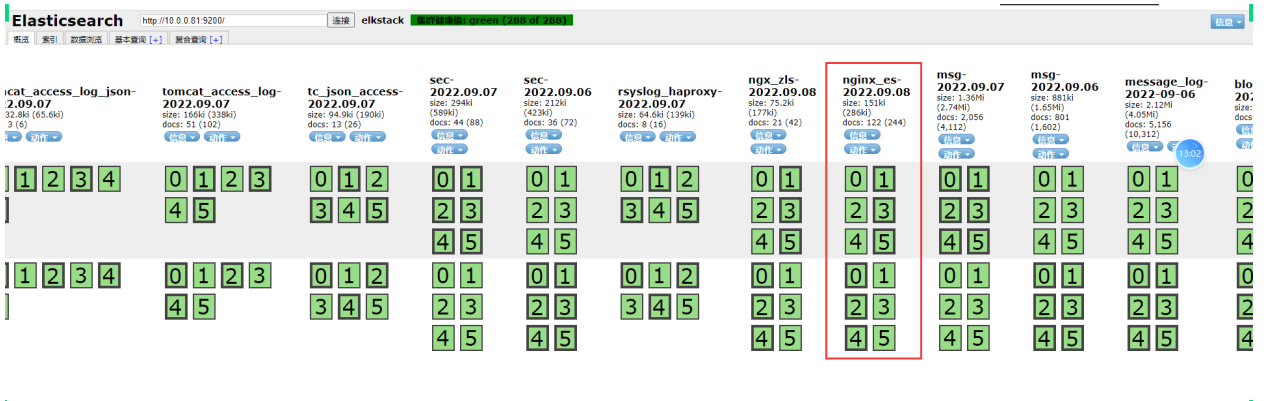
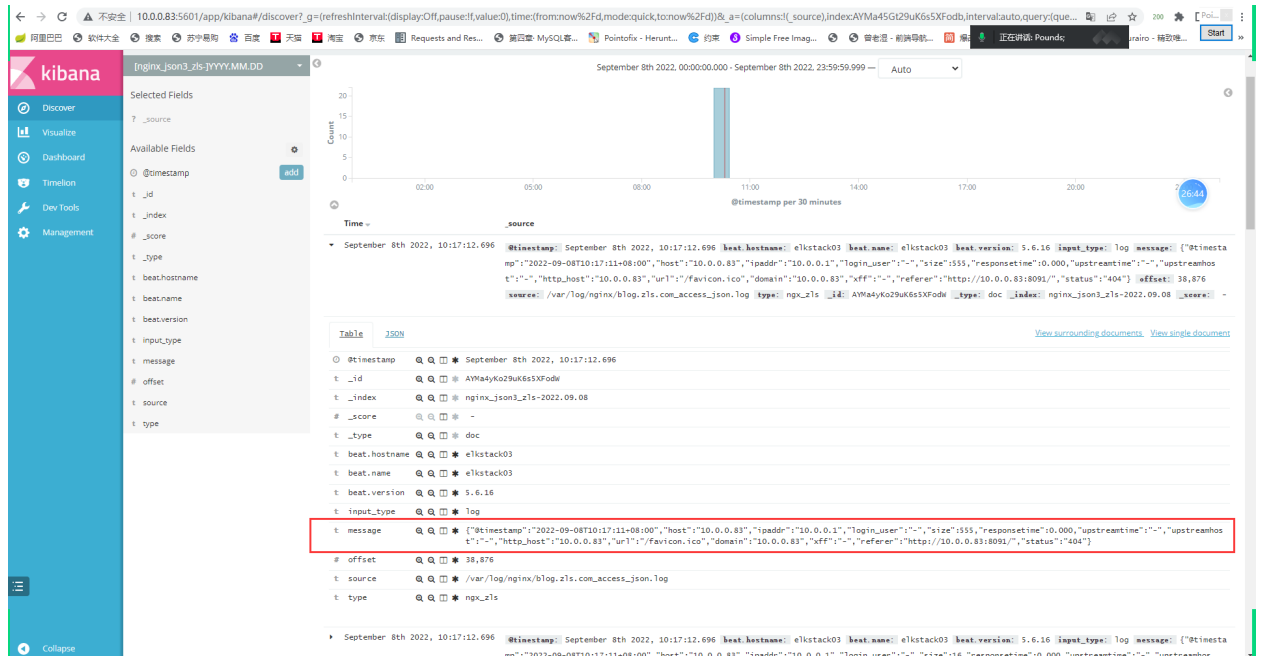
filebeat输出日志到ES
[root@elkstack03 ~]# vim /etc/filebeat/filebeat.yml
filebeat.prospectors:
- input_type: log
  paths:
    - /var/log/nginx/blog.zls.com_access_json.log
  exclude_lines: ["^DBG","^$"]
  document_type: ngx_zls

output.elasticsearch:
  hosts: ["10.0.0.81:9200"]
  index: "nginx_es-%{+yyyy.MM.dd}"


## filebeat从头开始收集日志
# 1.停止filebeat服务
[root@elkstack03 ~]# systemctl stop filebeat
# 2.删除registry文件
[root@elkstack03 ~]# rm -f /var/lib/filebeat/registry
# 3.启动filebeat
[root@elkstack03 ~]# systemctl start filebeat
使用fliebeat将日志从文件输出到redis
filebeat配置
[root@elkstack03 ~]# vi /etc/filebeat/filebeat.yml
filebeat.prospectors:
- input_type: log
  paths:
    - /var/log/nginx/blog.zls.com_access_json.log
  exclude_lines: ["^DBG","^$"]
  document_type: blog.zls.com_json

- input_type: log
  paths:
    - /var/log/nginx/www.zls.com_access_json.log
  exclude_lines: ["^DBG","^$"]
  document_type: www.zls.com_json


output.redis:
  hosts: ["10.0.0.52:6379"]
#Redis中的key名称
  key: "nginx_log"
#使用6库
  db: 6
#设置超时时间
  timeout: 5
#redis密码
# password: zls

[root@elkstack03 ~]# systemctl stop filebeat
[root@elkstack03 ~]# rm -f /var/lib/filebeat/registry
[root@elkstack03 ~]# systemctl start filebeat
logstash配置
[root@elkstack04 ~]# vim /etc/logstash/conf.d/ngx_redis_es.conf
input{
        redis{
                data_type => "list"
                key => "nginx_log"
                host => "10.0.0.52"
                port => "6379"
                db => "6"
                codec => "json"
        }
}

filter{
        json{
                source => "message"
                remove_field => ["message"]
        }
}

output{
        elasticsearch{
                hosts => ["10.0.0.82:9200"]
                index => "%{type}-%{+yyyy.MM.dd}"
        }
}
[root@elkstack04 ~]# logstash -f /etc/logstash/conf.d/ngx_redis_es.conf
filebeat收集日志输出到多个目标
[root@elkstack03 conf.d]# vim /etc/filebeat/filebeat.yml
filebeat.prospectors:
- input_type: log
  paths:
    - /usr/local/nginx/logs/access_json.log
#不收集的行
  exclude_lines: ["^DBG","^$"]
#日志类型
  document_type: ngx_log

- input_type: log
  paths:
    - /usr/local/tomcat/logs/tomcat_access_log.*.log
#不收集的行
  exclude_lines: ["^DBG","^$"]
#日志类型
  document_type: tc_log

output.redis:
#redis 服务器地址,可以是多个
  hosts: ["10.0.0.54:6379"]
  key: "tn"
  db: 2
  timeout: 5
  password: zls

output.file:
  path: "/tmp"
  filename: "zls.txt"
#工作线程数
  worker: 1
#压缩级别
  compression_level: 3
#多个输出的时候开启负载
  loadbalance: true

 浙公网安备 33010602011771号