zabbix API 寡妇
Zabbix API
模拟用户登录获取token
[root@sb_wzj ~]# curl -s -X POST -H 'Content-Type:application/json' -d '
{
    "jsonrpc": "2.0",
    "method": "user.login",
    "params": {
        "user": "Admin",
        "password": "zabbix"
    },
    "id": 1,
    "auth": null
}' http://zabbix.zls.com/api_jsonrpc.php
{"jsonrpc":"2.0","result":"8d2f2cca0340c16f2c1c8c894c762232","id":1}
添加主机
## 获取主机组ID
curl -s -X POST -H 'Content-Type:application/json-rpc ' -d '
{
    "jsonrpc": "2.0",
    "method": "hostgroup.get",
    "params": {
        "output": "extend",
        "filter": {
            "name": [
                "Linux servers"
            ]
        }
    },
    "auth": "8d2f2cca0340c16f2c1c8c894c762232",
    "id": 1
}' http://zabbix.zls.com/api_jsonrpc.php


## 获取模板的id
curl -s -X POST -H 'Content-Type:application/json-rpc ' -d '
{
    "jsonrpc": "2.0",
    "method": "template.get",
    "params": {
        "output": "extend",
        "filter": {
            "host": [
                "diy item by zls"
            ]
        }
    },
    "auth": "8d2f2cca0340c16f2c1c8c894c762232",
    "id": 1
}' http://zabbix.zls.com/api_jsonrpc.php


curl -s -X POST -H 'Content-Type:application/json-rpc ' -d '
{
    "jsonrpc": "2.0",
    "method": "host.create",
    "params": {
        "host": "zls_xxx",
        "interfaces": [
            {
                "type": 1,
                "main": 1,
                "useip": 1,
                "ip": "172.16.1.77",
                "dns": "",
                "port": "10050"
            }
        ],
        "groups": [
            {
                "groupid": "2"
            }
        ],
        "templates": [
            {
                "templateid": "10438"
            }
        ],
        "inventory_mode": 0,
        "inventory": {
            "macaddress_a": "01234",
            "macaddress_b": "56768"
        }
    },
    "auth": "8d2f2cca0340c16f2c1c8c894c762232",
    "id": 1
}' http://zabbix.zls.com/api_jsonrpc.php
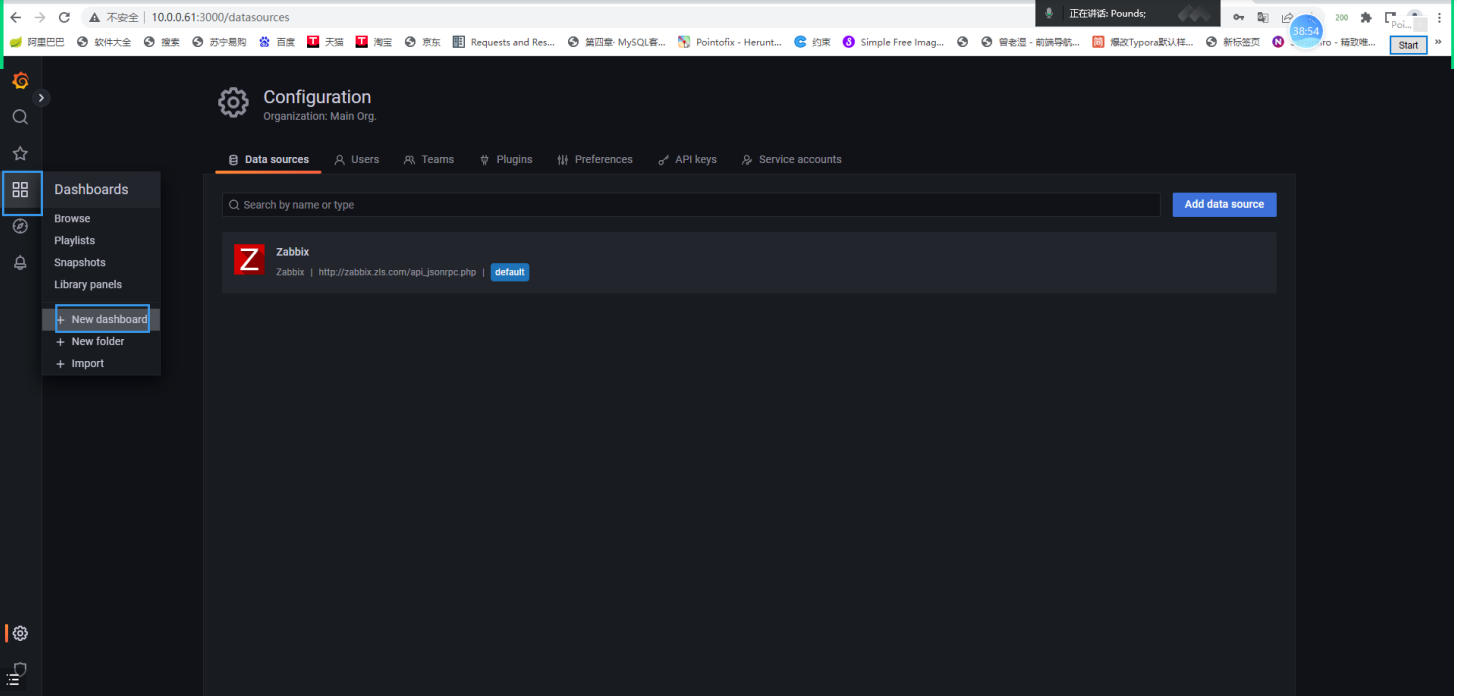
zabbix集成寡妇
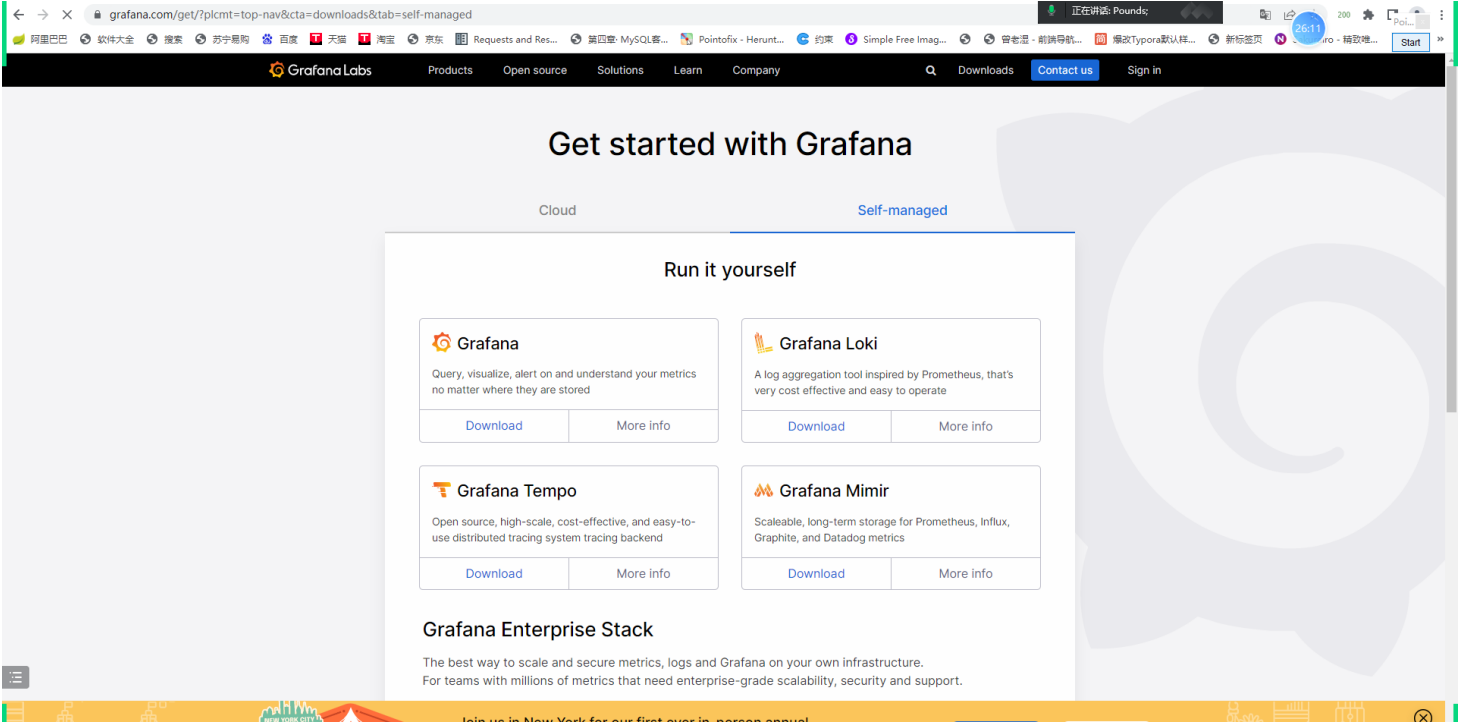
# 1.安装grafana
[root@web01-zbx ~]# yum install -y https://dl.grafana.com/enterprise/release/grafana-enterprise-9.1.1-1.x86_64.rpm

# 2.启动grafana
[root@web01-zbx ~]# systemctl start grafana-server

# 3.端口
[root@web01-zbx ~]# netstat -lntup|grep 3000
tcp6       0      0 :::3000                 :::*                    LISTEN      39779/grafana-serve
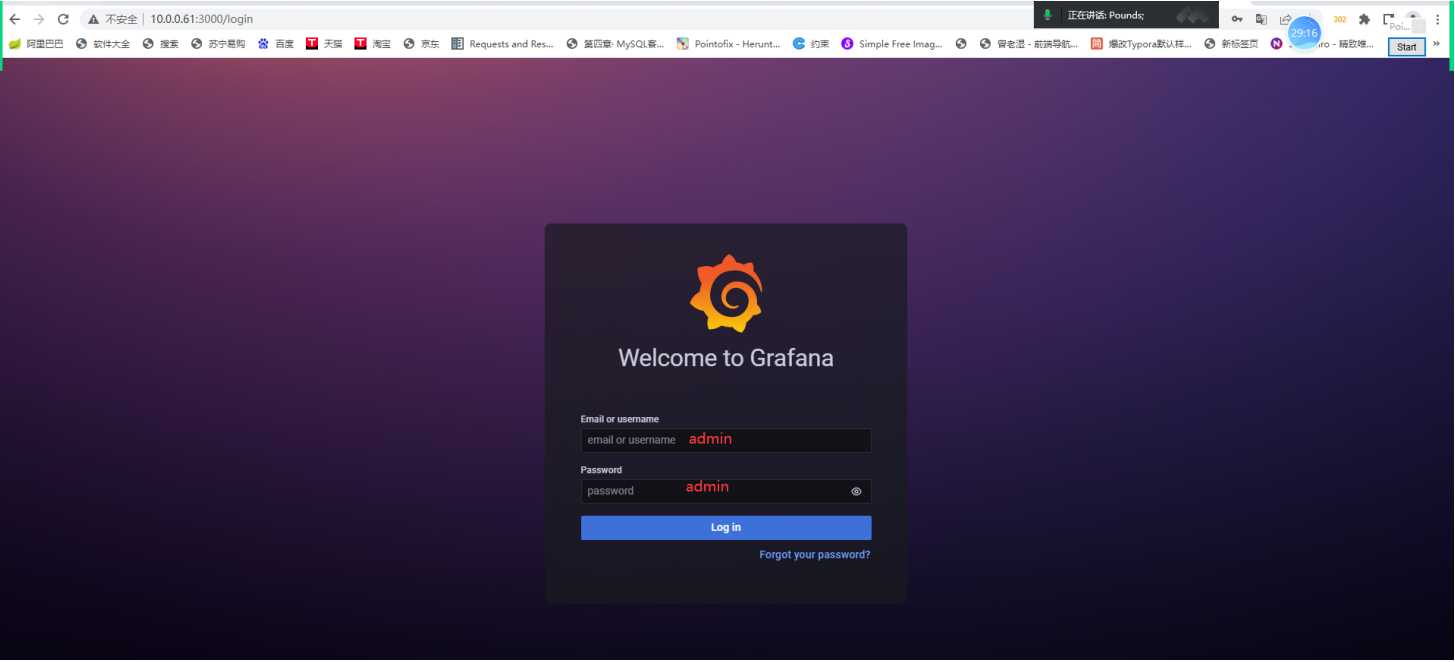
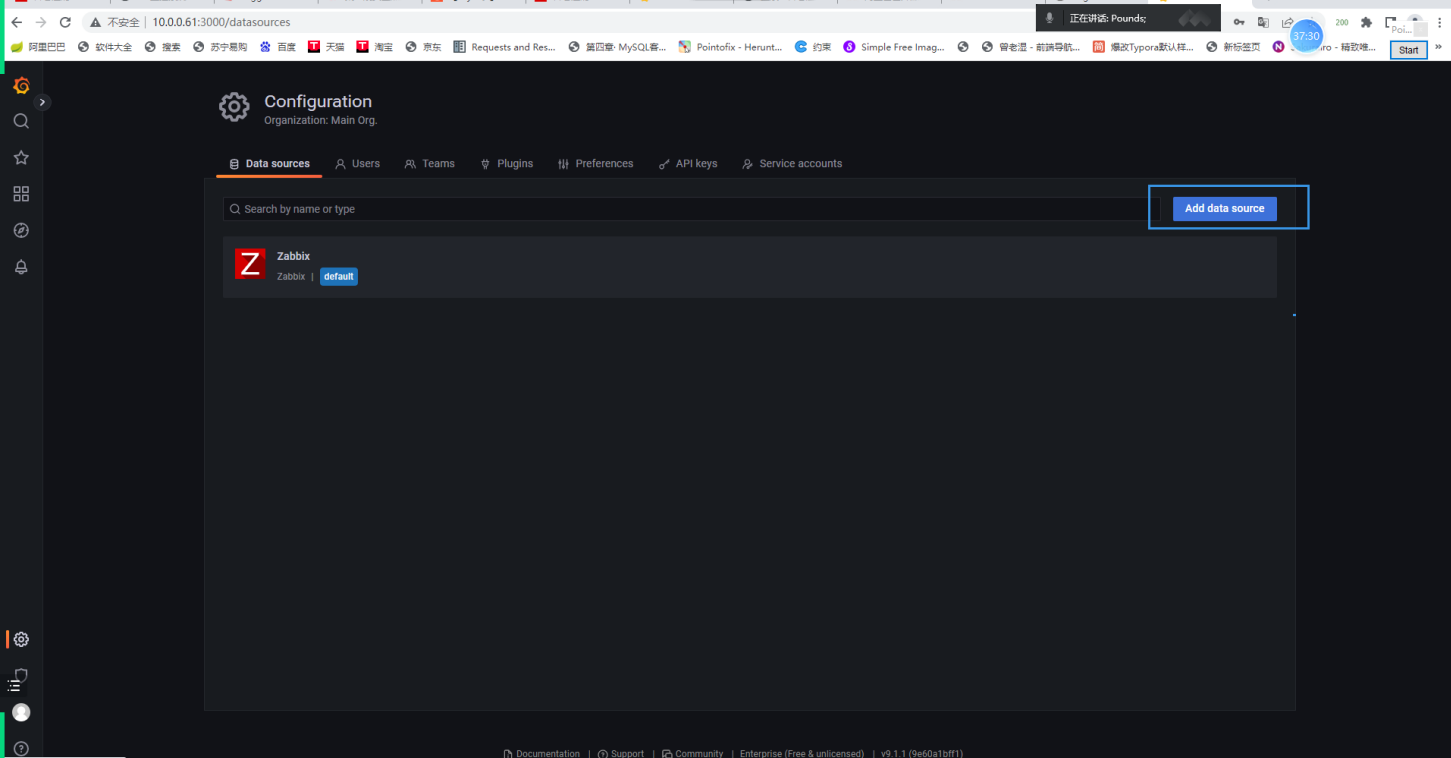
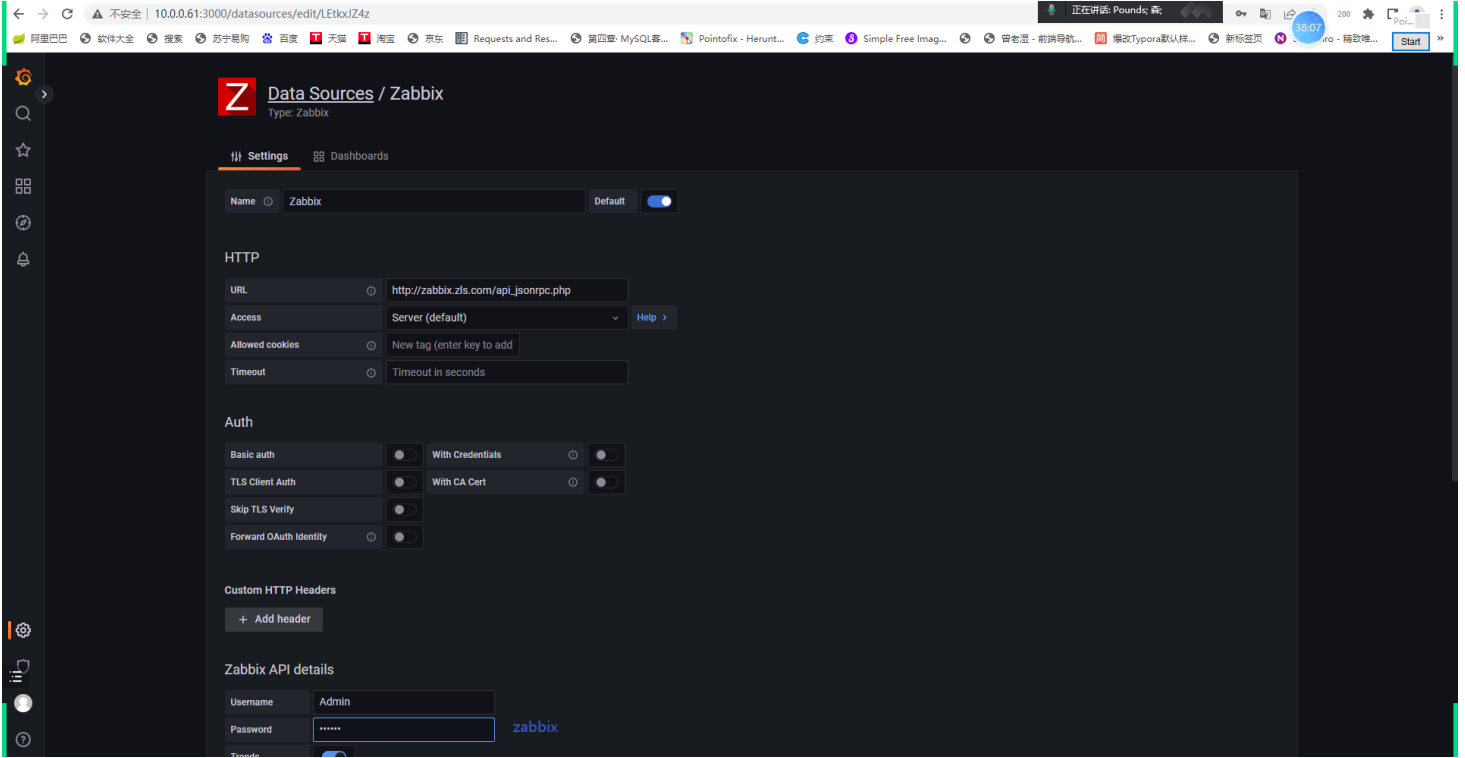
打开浏览器访问:http://10.0.0.61:3000/
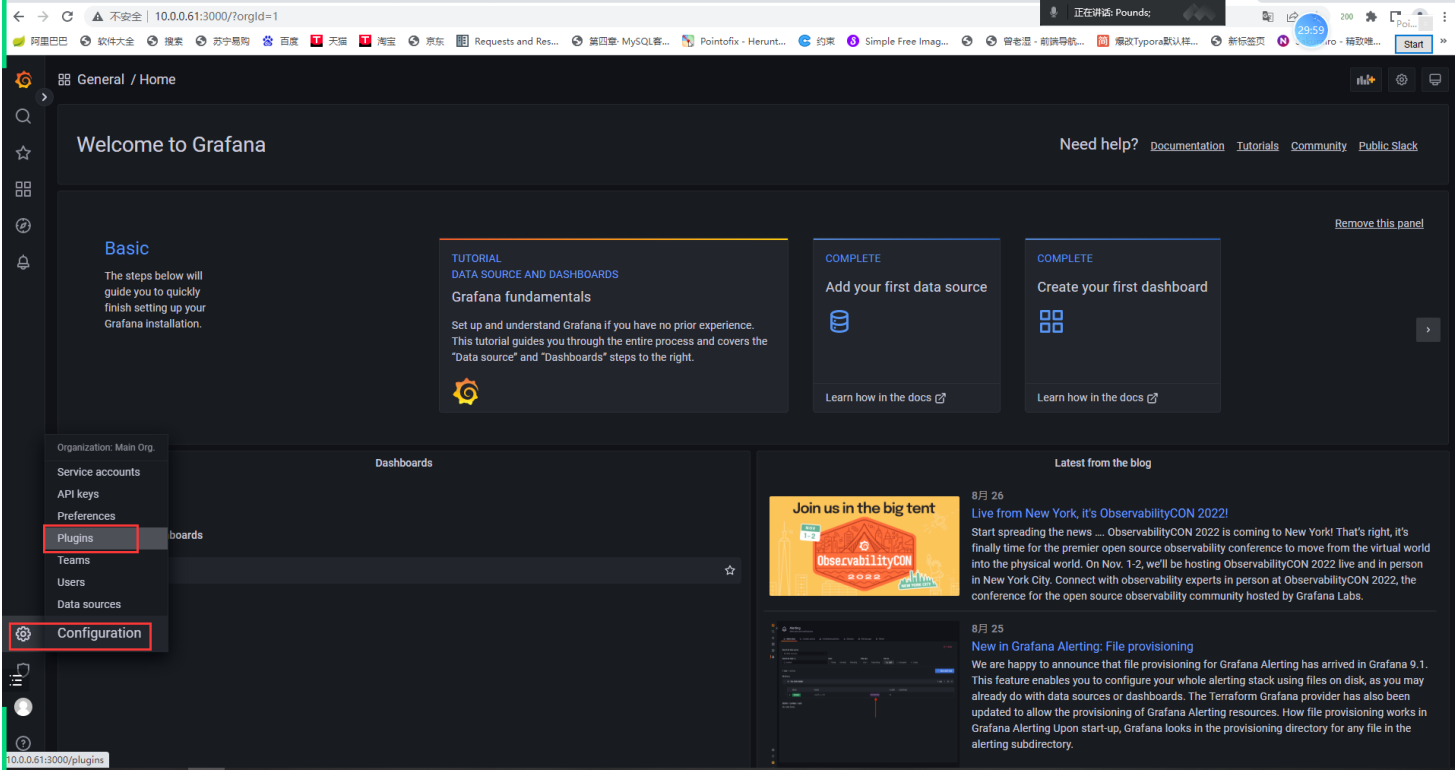
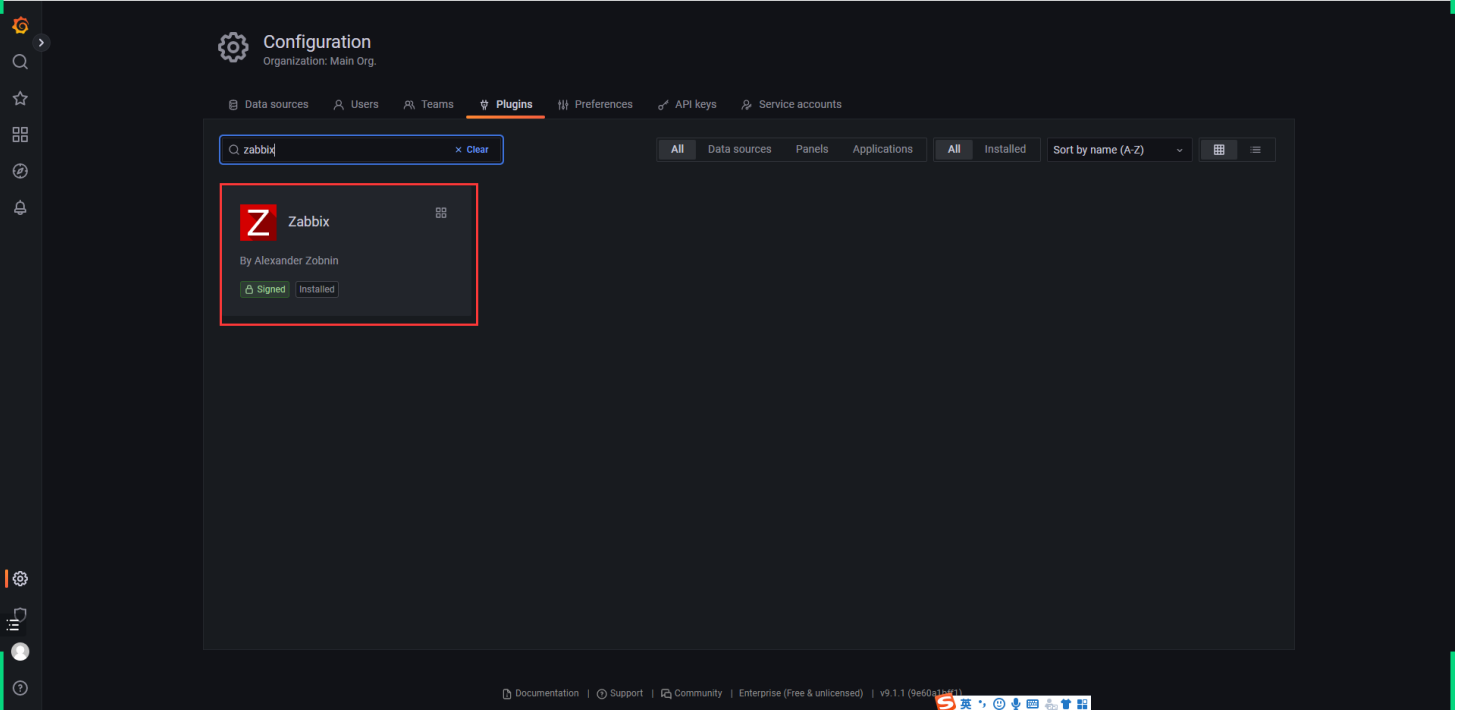
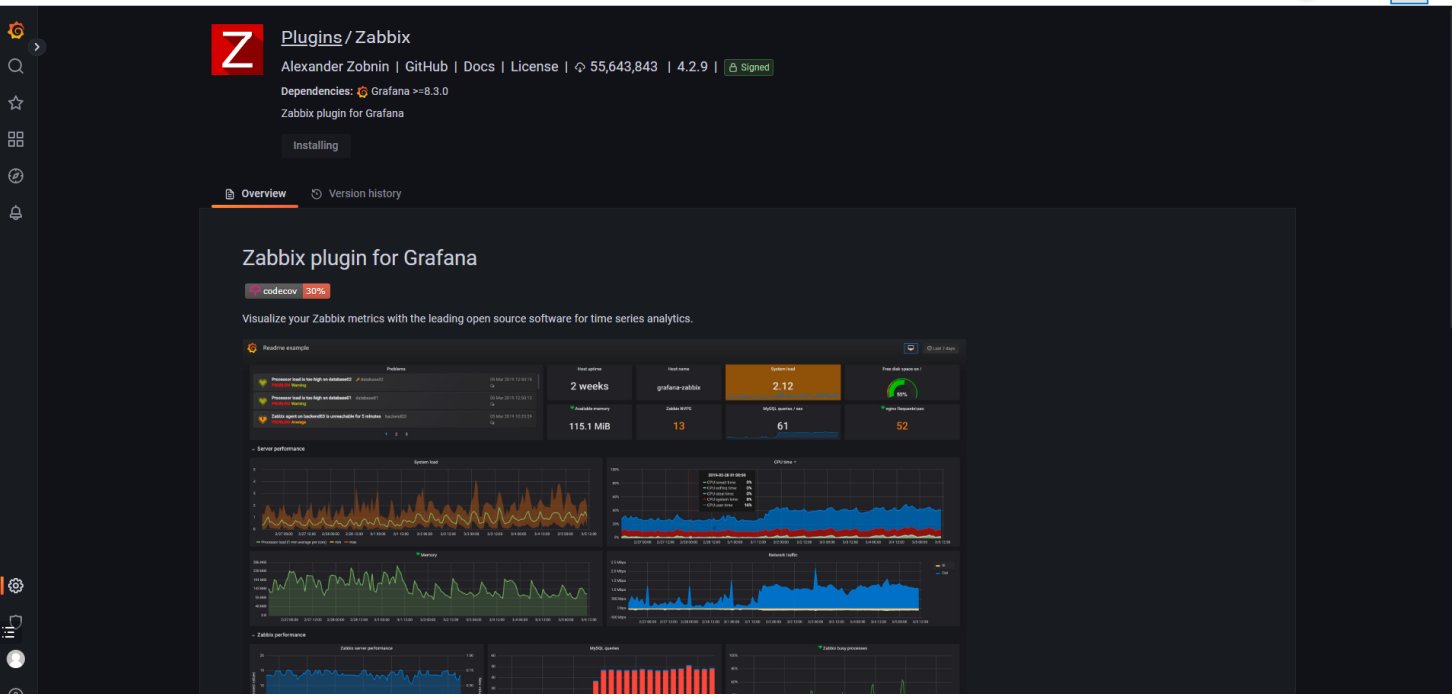
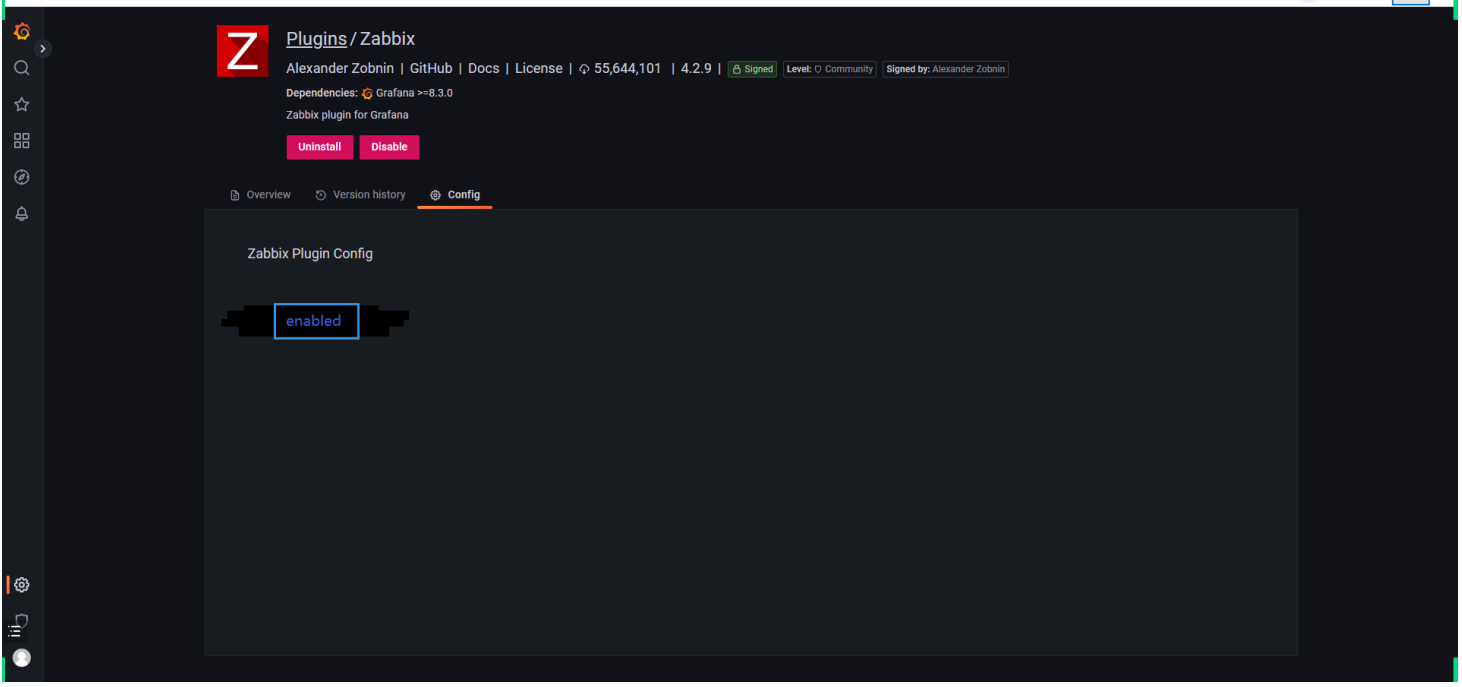
[root@web01-zbx ~]# grafana-cli plugins install alexanderzobnin-zabbix-app
✔ Downloaded alexanderzobnin-zabbix-app v4.2.9 zip successfully
[root@web01-zbx ~]# systemctl restart grafana-server
zabbix性能调优
-
Zabbix属于写多读少的业务, 所以需要针对zabbix的MySQL进行拆分。MySQL一定要使用SSD固态盘
-
将Zabbix-Agent被动监控模式, 调整为主动监控模式。
-
使用zabbix-proxy分布式监控, 在大规模监控时用于缓解Zabbix-Server压力
-
去掉无用监控项, 增加监控项的取值间隔, 减少历史数据保存周期(由housekeeper进程定时清理)
5)针对于Zabbix-server进程调优, 谁忙就加大谁的进程数量, 具体取决实际情况, 不是越大越好
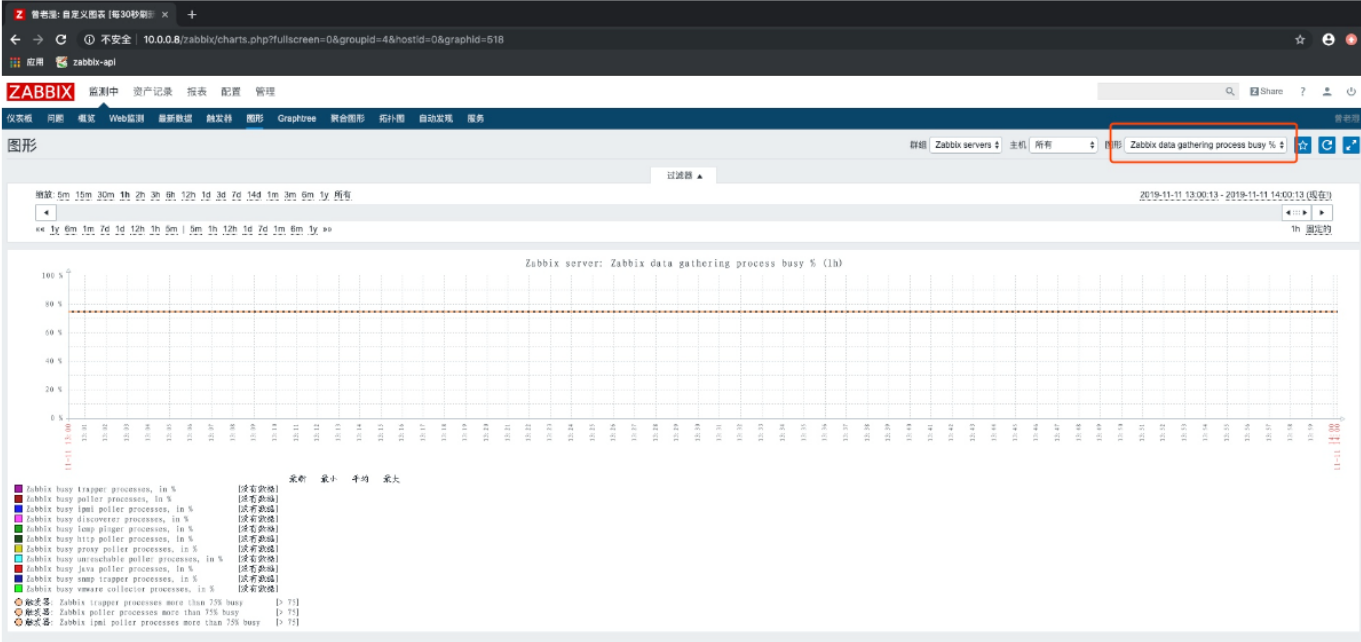
[root@web02 ~]# vim /etc/zabbix/zabbix_server.conf
StartPollers=20
StartPollersUnreachable=20
...
6)针对于Zabbix-server缓存调优, 谁的剩余内存少, 就加大它的缓存值(zabbix cache usage图表)
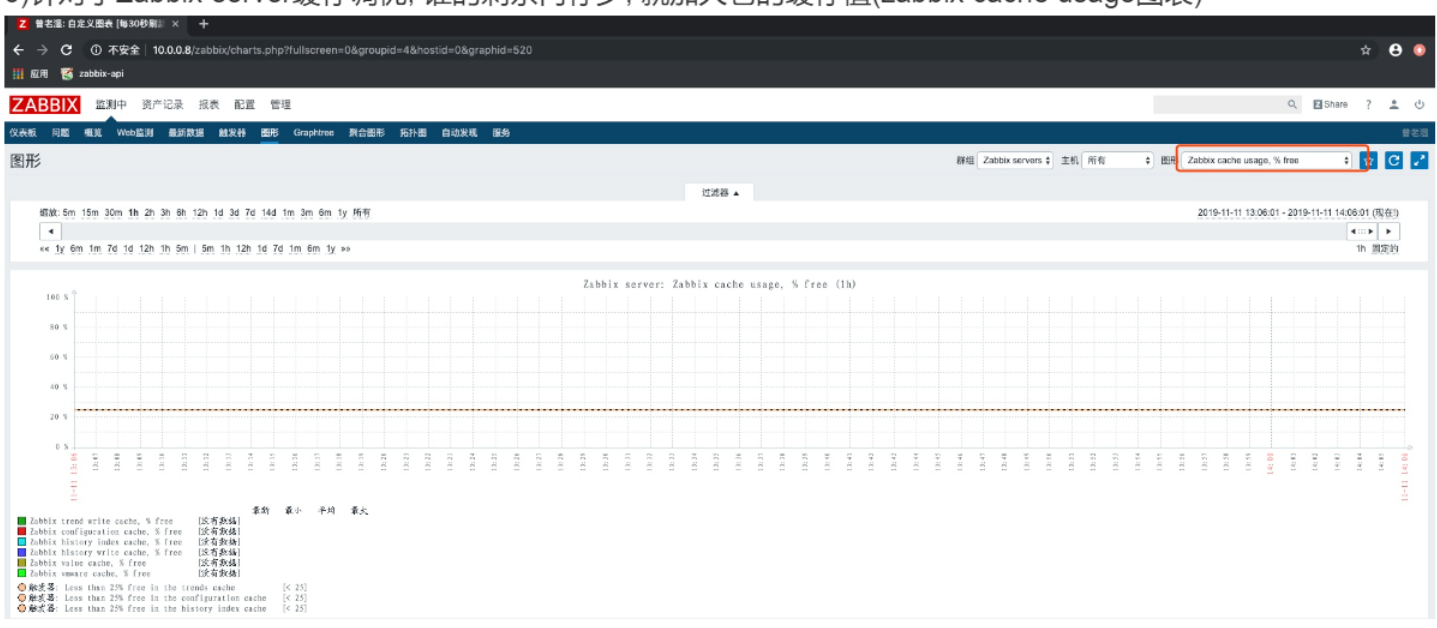
[root@web02 ~]# vim /etc/zabbix/zabbix_server.conf
CacheSize=8M
HistoryCacheSize=16M
HistoryIndexCacheSize=4M
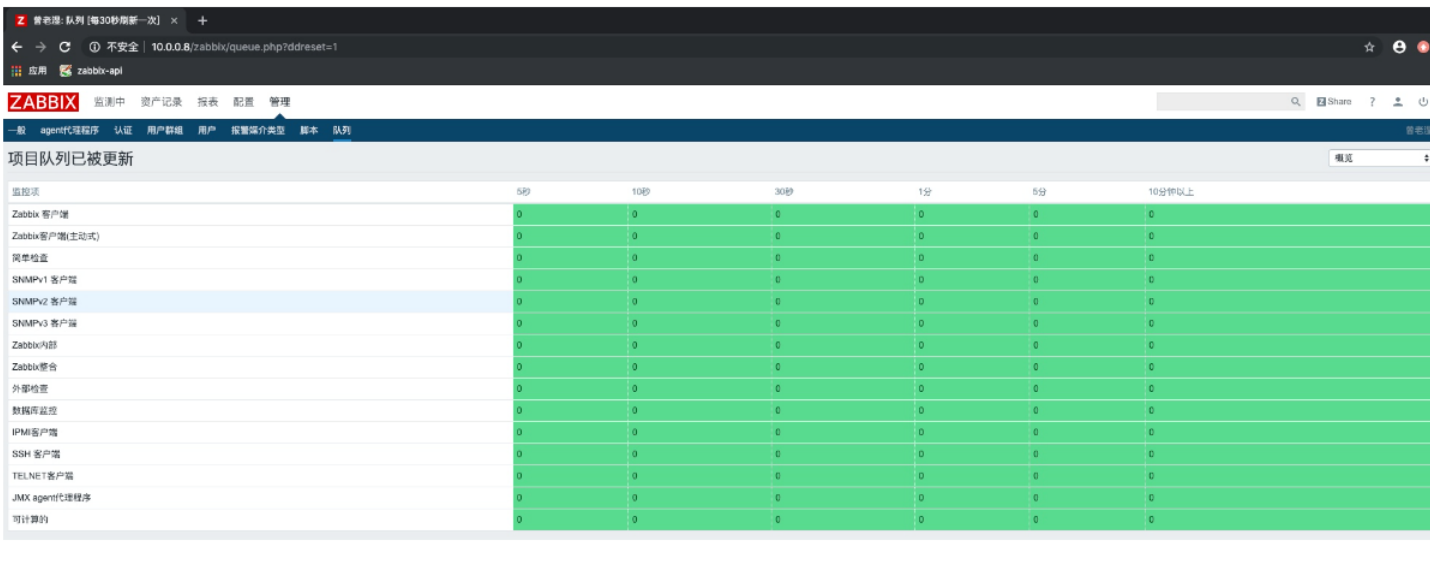
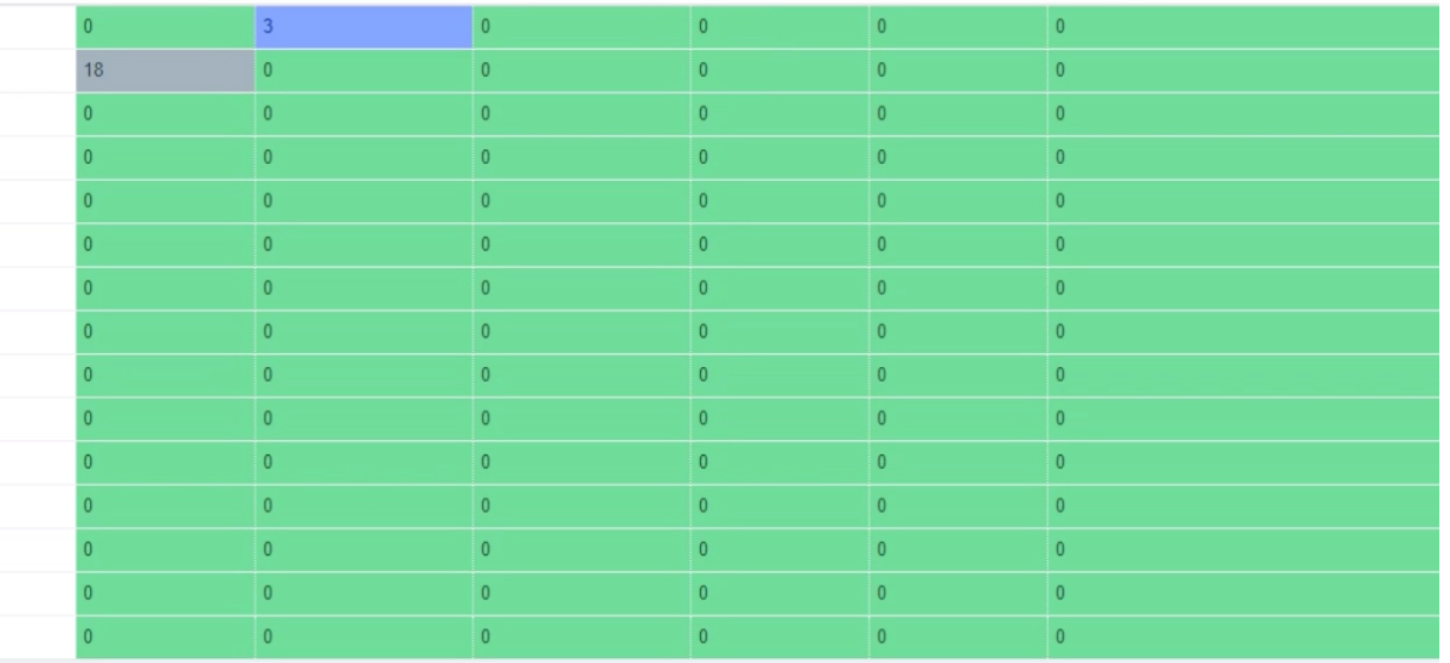
- 关注管理->队列, 是否有被延迟执行的监控项
![]()
![]()

 浙公网安备 33010602011771号