canvas基础
1.canvas是H5中的标签,像所有的dom对象一样它有自己本身的属性、方法和事件,其中就有绘图的方法,js能够调用它来进行绘图
<canvas></canvas>
2.canvas并没有绘图功能,所有的绘图工作都是由js完成的。通常通过getElementById来获取要操作的canvas
注意:最好直接设置canvas的宽和高,不要用css设置,会被拉伸。也可以在js脚本中设置宽和高。
<body>
    <canvas id="canvas" style="border:1px solid #ddd;width:800px;height:500px;"></canvas>
</body>
<script>
    window.onload=function(){
        var canvas = document.getElementById("canvas");
    }
</script>
<body>
    <canvas id="canvas" style="border:1px solid #ddd;"></canvas>
</body>
<script>
    window.onload=function(){
        var canvas = document.getElementById("canvas");
        canvas.height=500;
        canvas.width=800;
    }
</script>
3.context是canvas的对象,封装了很多绘图功能,获取这个对象的方法如下:
var context = canvas.getContext("2d");
getContext("2d");用于获取canvas的绘图环境,目前只支持2d绘图。可以绘制直线、弧线、圆、文本、矩形等。
4.画一条直线
<script>
    window.onload=function(){
        var canvas = document.getElementById("canvas");
        canvas.width=200;
        canvas.height=200;
        var context = canvas.getContext("2d");//获取该canvas的绘图环境
        context.moveTo(50,50);//起始位置
        context.lineTo(150,150);//结束位置
        context.lineWidth = 5;//线的宽度
        context.strokeStyle ="#005588";//描边颜色
        context.stroke();//描边
    }
</script>
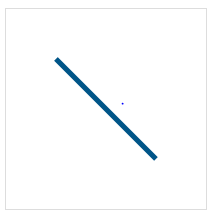
moveTo(x,y):起始位置坐标;
lineTo(x,y):画一条直线到某点;
lineWidth:线条的宽度;
stroke():描边,加上描边就能看到运动轨迹,默认是黑色轨迹。
strokeStyle:描边的颜色,可以自己设置。颜色赋值可以跟css一样设置,支持rgb,rgba等。
5.画两条直线,一条红色,一条蓝色;
<script>
    window.onload=function(){
var canvas = document.getElementById("canvas");
canvas.width=200;
canvas.height=200;
var context = canvas.getContext("2d");
context.moveTo(50,50);
context.lineTo(150,150);
//线的宽度
context.lineWidth = 5;
//线的颜色
context.strokeStyle ="red";
context.stroke();
context.moveTo(150,150);
context.lineTo(150,50);
//线的宽度
context.lineWidth = 5;
//线的颜色
context.strokeStyle ="blue";
context.stroke();
}
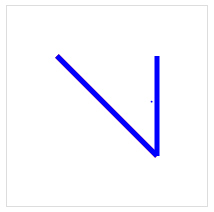
从效果图中可以看出是两条直线,不过都是蓝色的。这是因为canvas在第二次给路径上色时,是把之前的所有路径轨迹合在一起来上色的,除非咱们让canvas知道那折线和直线应该是独立开来的俩路径。
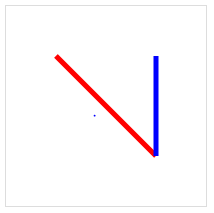
我们可以使用.beginPath()来解决,其实beginPath()可以做到上述的隔离路径绘制效果的作用,防止之前的效果被污染。
<script>
    window.onload=function(){
var canvas = document.getElementById("canvas");
canvas.width=200;
canvas.height=200;
var context = canvas.getContext("2d");
context.moveTo(50,50);
context.lineTo(150,150);
//线的宽度
context.lineWidth = 5;
//线的颜色
context.strokeStyle ="red";
context.stroke();
context.beginPath();
context.moveTo(150,150);
context.lineTo(150,50);
//线的宽度
context.lineWidth = 5;
//线的颜色
context.strokeStyle ="blue";
context.stroke();
</script>
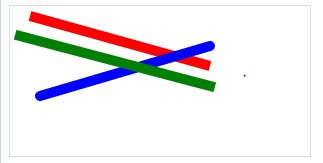
lineCap和lineJoin属性
lineCap是设定线段端点的形状(线帽),其值可以是:
butt 默认,即线条端点为平直的边缘
round 线条端点为圆角线帽
square 为线条端点添加正方形线帽


<script>
    window.onload=function(){
        var canvas=document.getElementById("canvas");
        var ctx=canvas.getContext("2d");
        ctx.lineWidth=10;
        ctx.beginPath();
        ctx.lineCap="butt";
        ctx.moveTo(20,10);
        ctx.lineTo(200,60);
        ctx.strokeStyle="red";
        ctx.stroke();

        ctx.beginPath();
        ctx.lineCap="round";
        ctx.moveTo(30,90);
        ctx.lineTo(200,40);
        ctx.strokeStyle="blue";
        ctx.stroke();

        ctx.beginPath();
        ctx.lineCap="square";
        ctx.moveTo(10,30);
        ctx.lineTo(200,80);
        ctx.strokeStyle="green";
        ctx.stroke();

    }
</script>
lineJoin则是设定折线的交接处的外角类型,其值可为:
miter 默认,折线交接处为尖角
round 折线交接处为圆角
bevel 折线交接处为斜角
<script>
    window.onload=function(){
        var canvas = document.getElementById("canvas");

        var ctx = canvas.getContext("2d");
        ctx.lineWidth=13;
        ctx.lineJoin="bevel";
        ctx.moveTo(20,20);
        ctx.lineTo(100,50);
        ctx.lineTo(20,80);
        ctx.strokeStyle="red";
        ctx.stroke();

        ctx.beginPath();
        ctx.lineJoin="round";
        ctx.moveTo(20,60);
        ctx.lineTo(100,90);
        ctx.lineTo(20,150);
        ctx.strokeStyle="green";
        ctx.stroke();

        ctx.beginPath();
        ctx.lineJoin="miter";
        ctx.moveTo(20,90);
        ctx.lineTo(100,150);
        ctx.lineTo(20,200);
        ctx.strokeStyle="blue";
        ctx.stroke();

    }
</script>

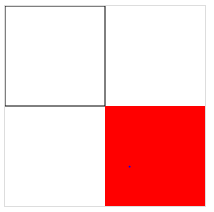
6.绘制矩形 context.fillRect(x,y,width,height) strokeRect(x,y,width,height)
<script>
    window.onload=function(){

     var canvas = document.getElementById('canvas');
     var cxt=canvas.getContext('2d');

     cxt.strokeRect(0,0,100,100);
     cxt.fillStyle="red";
     cxt.fillRect(100,100,200,200);
    }
</script>
x,y:为矩形的起始位置
width:矩形的宽度
height:矩形的高度
fillStyle:矩形的填充颜色
fillRect:填充矩形
strokeStyle:描边颜色
strokeRect:描边矩形
fillStyle和strokeStyle颜色设置可以为:
直接用颜色名称:"red" "green" "blue"
十六进制颜色值: "#EEEEFF"
rgb(1-255,1-255,1-255)
rgba(1-255,1-255,1-255,透明度)
还可以使用渐变色,接下来主要介绍线性渐变
线性渐变context.createLinearGradient(x,y,width,height);
context.createLinearGradient(0,0,800,800);//从左上角(0,0)的位置到右上角(800,800)的位置;改变坐标可以形成水平的或者垂直的渐变
addColorStop(0.0,'black');指定颜色和颜色范围,0.0表示起始位置;
skyStyle.addColorStop(1.0,'#035');1.0表示终点位置;
注意addColorStop是可以任意添加多个的。
示例代码:

var skyStyle = context.createLinearGradient(0,0,800,800);

skyStyle.addColorStop(0.0,'black');

skyStyle.addColorStop(0.5,'#035');

skyStyle.addColorStop(1.0,'#035');

context.fillStyle = skyStyle;

context.fillRect(0,0,canvas.width,canvas.height);
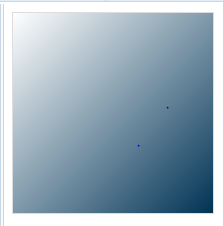
<script>
    window.onload=function(){
     var canvas = document.getElementById('canvas');
     var cxt=canvas.getContext('2d');


     var skyStyle = cxt.createLinearGradient(0,0,200,200);
     skyStyle.addColorStop(0.0,'#fff');
    // skyStyle.addColorStop(0.5,'#035');
     skyStyle.addColorStop(1.0,'#035');
     cxt.fillStyle = skyStyle;
     cxt.fillRect(0,0,canvas.width,canvas.height);
    }
</script>
清除矩形区域 context.clearRect(x,y,width,height)
<script>
    window.onload=function(){
     var canvas = document.getElementById('canvas');
     var cxt=canvas.getContext('2d');

     var skyStyle = cxt.createLinearGradient(0,0,200,200);
     skyStyle.addColorStop(0.0,'#fff');
     skyStyle.addColorStop(1.0,'#035');
     cxt.fillStyle = skyStyle;
     cxt.fillRect(0,0,canvas.width,canvas.height);
     cxt.clearRect(100,100,50,50);
    }
</script>

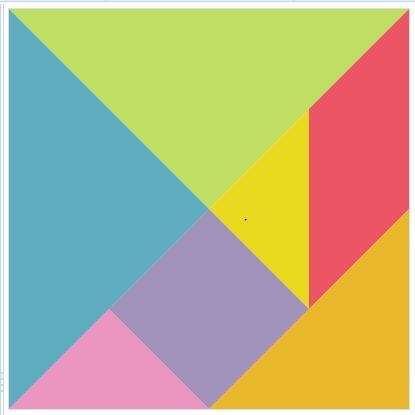
练习:绘制七巧板
<script>
//定义一个数组,数组中有7个部分,每一部分都是一个对象,每一部分又包含一个数组
var tangram=[
    {p:[{x:0,y:0},{x:800,y:0},{x:400,y:400}],color:"#BEDF64"},
    {p:[{x:0,y:0},{x:400,y:400},{x:0,y:800}],color:"#60ADC2"},
    {p:[{x:800,y:0},{x:800,y:400},{x:600,y:600},{x:600,y:200}],color:"#EB5564"},
    {p:[{x:600,y:200},{x:600,y:600},{x:400,y:400}],color:"#E9D91F"},
    {p:[{x:400,y:400},{x:600,y:600},{x:400,y:800},{x:200,y:600}],color:"#A092B9"},
    {p:[{x:200,y:600},{x:400,y:800},{x:0,y:800}],color:"#EA96C1"},
    {p:[{x:800,y:400},{x:800,y:800},{x:400,y:800}],color:"#E9B92B"}
]

    window.onload=function(){
        var canvas = document.getElementById("canvas");
        canvas.width = 800;
        canvas.height = 800;
        var context = canvas.getContext('2d');
        for(var i = 0;i < tangram.length;i++)
            draw(tangram[i],context)
    }

    function draw(piece,cxt){
        cxt.beginPath();
        cxt.moveTo(piece.p[0].x,piece.p[0].y);
        for(var i = 1; i < piece.p.length; i++)
            cxt.lineTo(piece.p[i].x,piece.p[i].y);
        cxt.closePath();
        cxt.fillStyle=piece.color;
        cxt.fill();

    }

</script>
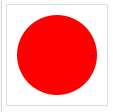
7.圆弧context.arc(x, y, radius, starAngle,endAngle, anticlockwise)
x,y:圆心坐标
startAngle:开始角度
radius:圆的半径大小
endAngle:结束角度
anticlockwise:是否逆时针,true:逆时针,false:顺时针
<script>
    window.onload=function(){
        var canvas = document.getElementById('canvas');
       var cxt=canvas.getContext('2d');

       cxt.beginPath();
       cxt.arc(100,100,80,0,Math.PI*2,true);
       cxt.closePath();
       cxt.fillStyle="red";
       cxt.fill();
    }
</script>
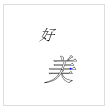
8.绘制文字
填充文字:context.fillText(text,x,y)
绘制文字轮廓 context.strokeText(text,x,y)
text:文字
x,y:文字的起点坐标
<script>
    window.onload=function(){
     var canvas = document.getElementById('canvas');
     var cxt=canvas.getContext('2d');

     cxt.beginPath();

     cxt.font="italic 30px sans-serif";
     cxt.fillText("好",70,70);
     cxt.closePath();

     cxt.font="italic 60px sans-serif";
     cxt.strokeText("美",80,150);
    }
</script>
9.保存文件canvas.toDataURL(MIME)
在canvas中绘出的图片只是canvas标签而已,不是真正的图片,是不能右键,另存为的,我们可以利用canvas.toDataURL()这个方法把canvas绘制的图形生成一幅图片,生成图片后,就能对图片进行相应的操作了。

 浙公网安备 33010602011771号