每日一题 为了工作 2020 0430 第五十九题
# coding=utf-8
import numpy as np
import operator
import matplotlib.pyplot as plt
from time import sleep
"""数据归一化"""
def autoNorm(dataSet):
# 统计矩阵中每一列的最大值和最小值
maxValue = dataSet.max(0)
minValue = dataSet.min(0)# 每一列最小值组成的列表
rangeValue = maxValue - minValue
# 获取行数
m = dataSet.shape[0]
# 先将minValue这个列表复制m行 在水平复制一次
LmSubMin = np.tile(minValue,(m,1))
# 求差值 也就是归一化公式的分子
"""
Lm' = (Lm - Lmin)/(Lmax - Lmin)
"""
normDataSet = dataSet - LmSubMin
# 复制分母矩阵
MaxSubMin = np.tile(rangeValue,(m,1))
normDataSet = normDataSet/MaxSubMin
# 返回内容 归一化后的矩阵 每一列最大最小值的差值 每一列的最小值
return normDataSet,rangeValue,minValue
"""读取文件内容"""
def fileMatrix(fileName):
fr = open(fileName,"rb")
#将文件内容全部加载到内存空间中 以列表的方式存储
arrayOfLines = fr.readlines()
numOfLines = len(arrayOfLines)
# 创建numOfLines行3列的空矩阵
returnMat = np.zeros((numOfLines, 3))
# 存放结果的列表
classLabelVector = []
index = 0
for line in arrayOfLines:
# 设置编码格式 去掉一行的首尾空格
line = line.decode("utf-8").strip()
splits = line.split("\t")
# 遍历每一行的元素 填充returnMat矩阵 该矩阵存放元数据
returnMat[index,:] = splits[0:3]
# 向列表内追加元素
classLabelVector.append(int(splits[-1]))
index += 1
return returnMat,classLabelVector
def classifyData(normData,dataSet,labels,k):
# normData 用来测试的样本
# dataSet 计算每一个测试样本中的数据到余下所有数据每一行的举例
# labels 余下测试样本的标签
# k 选取几个数据进行判定
dataSetLineNum = dataSet.shape[0]
# 对于每一行的数据都要分别计算该行到dataSet的其余行的空间举例,所以将normData的数据进行复制
normCopy = np.tile(normData,(dataSetLineNum,1))
diffMat = normCopy - dataSet
"""
距离公式是dis = {(x1-y1)^2+(x2-y2)^2+...+(xn-yn)^2}^0.5
"""
SqrtDiffMat = diffMat ** 2
# 对每一行求和
sumDistances = SqrtDiffMat.sum(axis=1)
# 开方获取最终的欧几里得距离
distance = sumDistances ** 0.5
# 对矩阵有小到大排序 最终返回的是矩阵元素的下标索引
sortIndex = distance.argsort()
classCount = {} # 存储每一种类别出现的次数 相当于map
for i in range(k):
# sortIndex 里面存储的是距离当前行欧氏距离最小的那一行所在的元数据中的下标索引位置
# labels 是元数据中每一列的真实类别
voteLabels = labels[sortIndex[i]]
# 相同的类别进行计数统计
classCount[voteLabels] = classCount.get(voteLabels,0)+1
# sort排序 最终返回一个list集合
sortClassCount = sorted(classCount.items(),key=lambda x:x[1],reverse=True)
# sortClassCount中的数据结构 [[],[],[]]
return sortClassCount[0][0]
def datingClassTest():
rate = 0.1
path = "dating.txt"
# 将数据划分为矩阵
dataMat, dataLabel = fileMatrix(path)
# 将数据进行归一化处理
normMat,rangeValues,minValues = autoNorm(dataMat)
m = normMat.shape[0] # 行号
# 将数据集按照比例进行划分 取出一部分用作训练样本集
numTestLines = int(m * rate)
errorCount = 0
for i in range(numTestLines):
# 第i行的所有列的数据
lineMessages = normMat[i,:]
# 第normMat - m 行的所有列的数据
remainMessages = normMat[numTestLines:m,:]
# 第normMat - m 行的数据类别
remainLables = dataLabel[numTestLines:m]
classify = classifyData(lineMessages,remainMessages,remainLables,4)
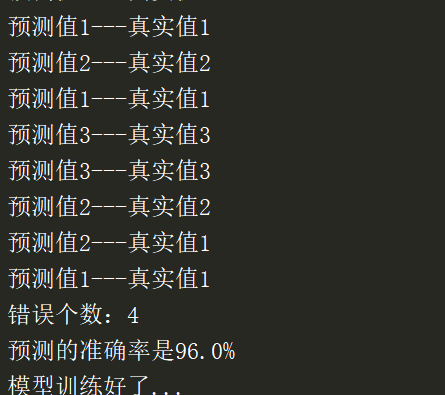
print("预测值{0}---真实值{1}".format(classify,dataLabel[i]))
if classify != dataLabel[i]:
errorCount += 1
print("错误个数:{0}".format(errorCount))
errorRate = errorCount/numTestLines
trueRate = 1-errorRate
print("预测的准确率是{0}%".format(100*trueRate))
return 1 - errorRate
def classifyPerson():
resultList = ["A","B","C"]
path = "dating.txt"
inputData = [18888,2,0.33]
datMat,dataLabel =fileMatrix(path)
normMat,rangeValue,minValue =autoNorm(datMat)
autoInput = (inputData - minValue)/rangeValue
result = classifyData(autoInput,normMat,dataLabel,3)
print("预测的结果是:"+resultList[result-1])
def createScatterDiagram():
path = "dating.txt"
dataMat,dataLabels = fileMatrix(path)
type1_x = []
type2_x = []
type3_x = []
type1_y = []
type2_y = []
type3_y = []
# 生成一个新的图像
fig = plt.figure
"""matplotlib下,一个figure图像可以包含多个子图axes"""
# subplot(numRows,numCols,plotNum)图表的整个绘图区域被分成numRows行和numCols列
# 按照从左到右,从上到下的顺序对每个子区域进行编号,左上的子区域编号为1
# plt.subplot(111)等价于plt.subplot(1,1,1)
axes = plt.subplot(111)
# 设置字体
plt.rcParams["font.sans-serif"]=["SimHei"]
index = 0
print("-----")
for i in range(len(dataLabels)):
if dataLabels[i] == 1:
type1_x.append(dataMat[i][0])
type1_y.append(dataMat[i][1])
if dataLabels[i] == 2:
type2_x.append(dataMat[i][0])
type2_y.append(dataMat[i][1])
if dataLabels[i] == 3:
type3_x.append(dataMat[i][0])
type3_y.append(dataMat[i][1])
# 绘制散点图 前两个参数表示相同长度的数组序列 s表示点的大小 c表示颜色
type1 = axes.scatter(type1_x,type1_y,20,"red")
type2 = axes.scatter(type2_x, type2_y, 40, "green")
type3 = axes.scatter(type3_x, type3_y, 50, "blue")
plt.title("标题")
plt.xlabel("水平横轴")
plt.ylabel("竖直纵轴")
# loc 设置图列位置 2是upper left
axes.legend((type1,type2,type3),("A","B","C"),loc=2)
plt.show()
if __name__ == '__main__':
print("训练开始了...")
createScatterDiagram()
sleep(5)
# 训练数据
acc = datingClassTest()
if acc > 0.9:
print("模型训练好了...")
# 测试数据
classifyPerson()


 浙公网安备 33010602011771号