
XDebug调试
安装
-
访问Xdebug
-
点击download
-
找到RELEASES,点击
custom installation instructions.![]()
-
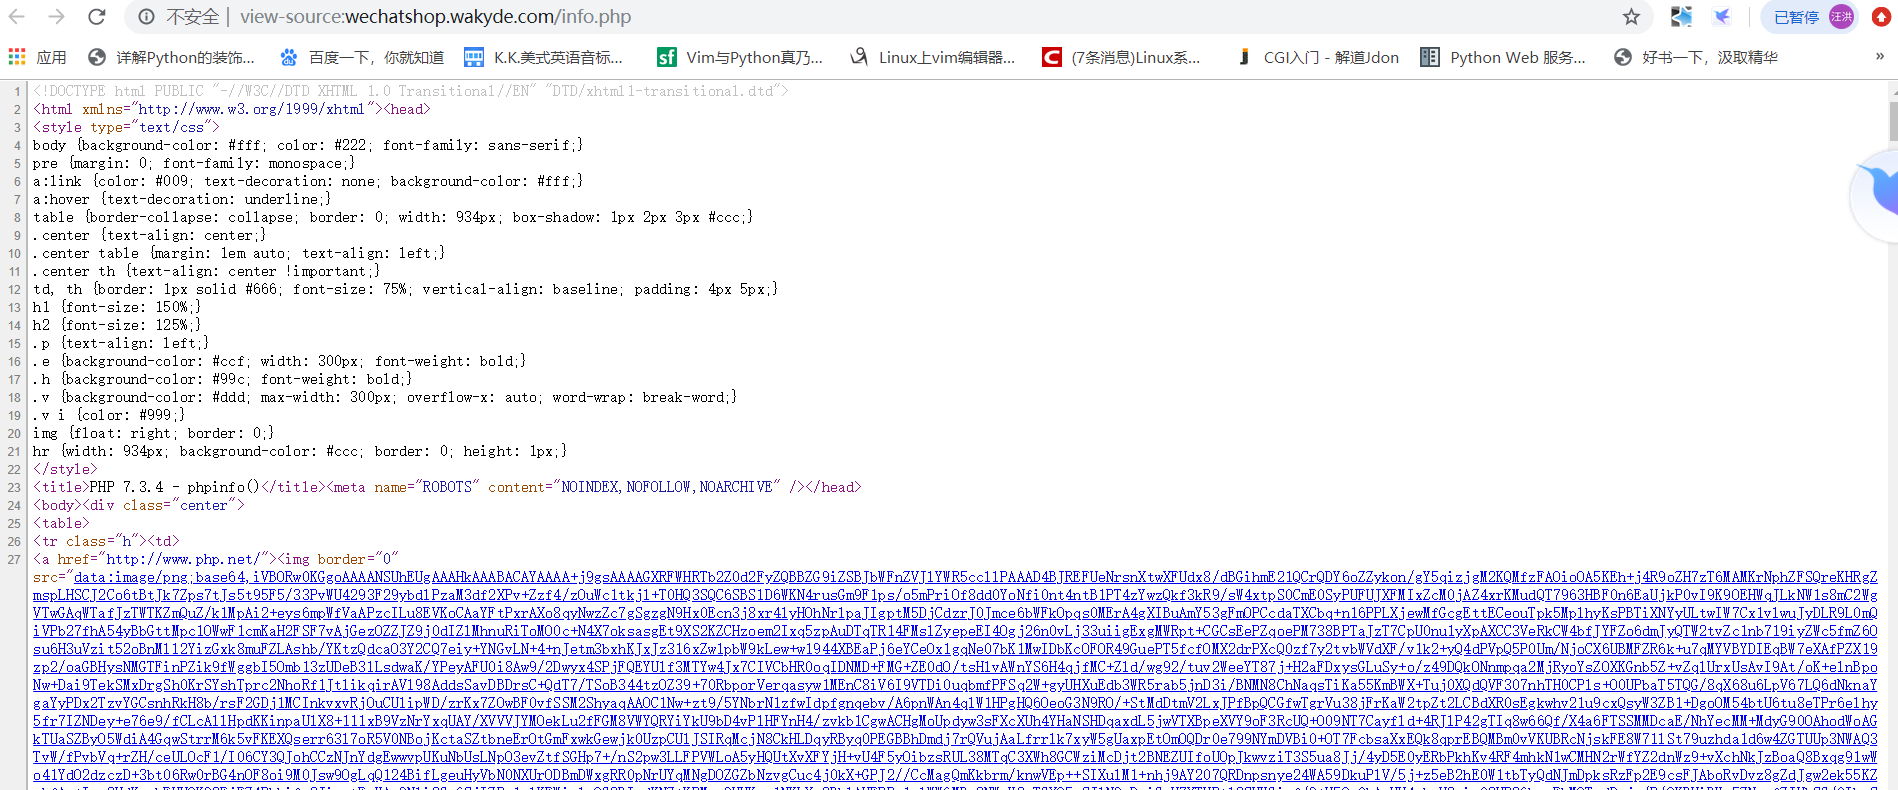
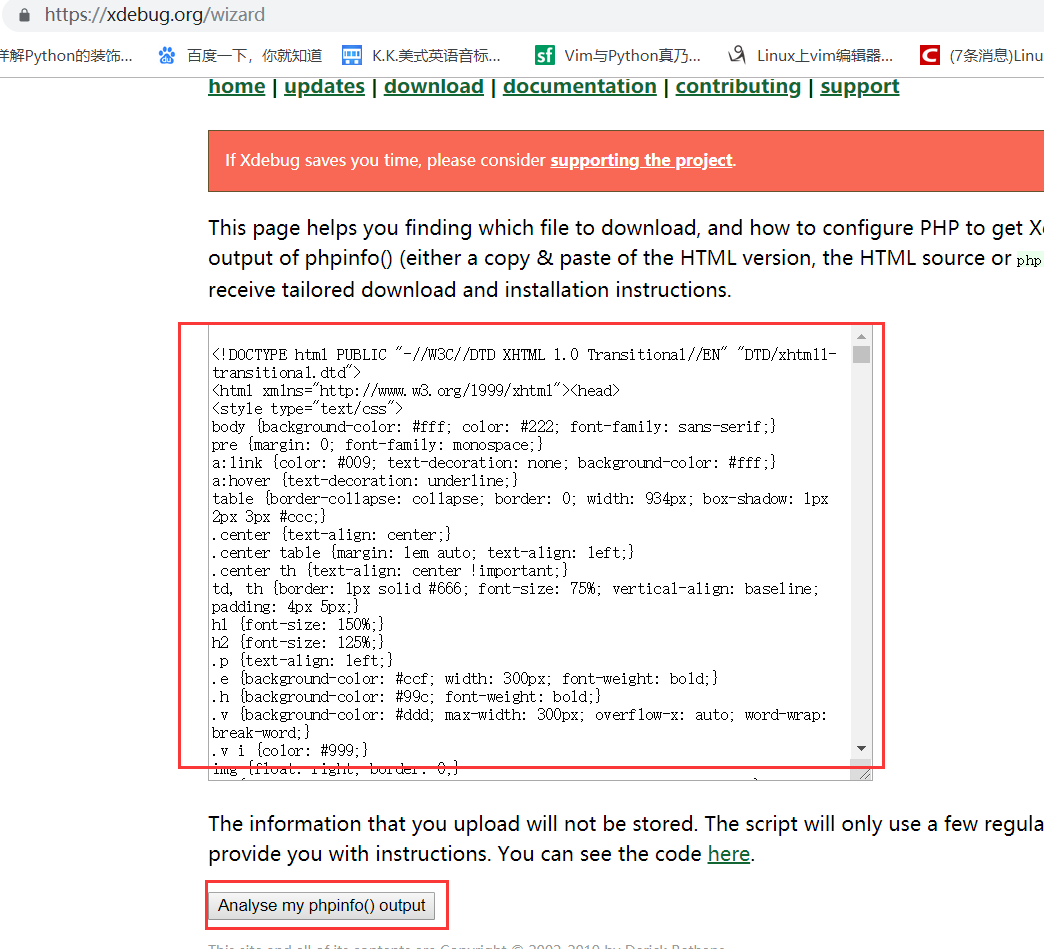
在白色框框内填入phpinfo()出来的源码
![]()
![]()
-
点击Analyse my phpinfo() output
![]()
-
然后下载
![]()
-
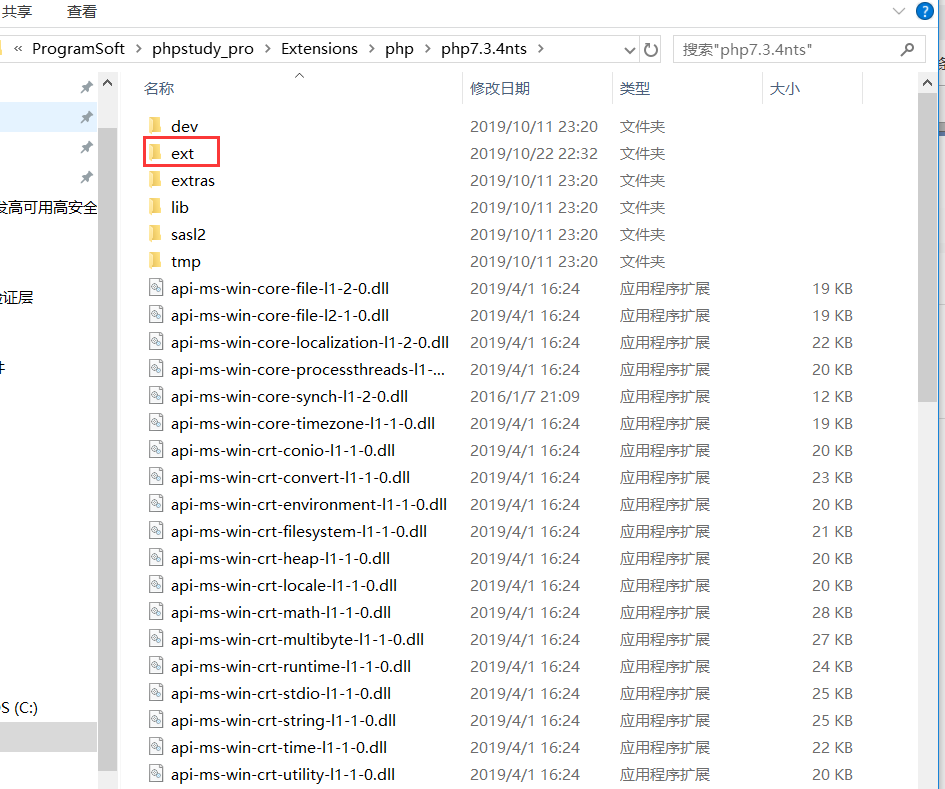
将下载好的dll文件放到php路径下ext文件的里面
![]()
-
配置php.ini
[Xdebug]
zend_extension = D:\ProgramSoft\phpstudy_pro\Extensions\php\php7.3.4nts\ext\php_xdebug-2.7.2-7.3-vc15-nts-x86_64.dll
xdebug.profiler_append = 0

xdebug.profiler_enable = 1

xdebug.profiler_enable_trigger = 0

xdebug.profiler_output_dir ="D:\ProgramSoft\phpstudy_pro\tmp\xdebug"

xdebug.trace_output_dir ="D:\ProgramSoft\phpstudy_pro\tmp\xdebug"

xdebug.profiler_output_name = "cache.out.%t-%s"
xdebug.remote_enable = 1
xdebug.remote_handler = "dbgp"
xdebug.remote_host = "127.0.0.1"
xdebug.remote_port = 9000
xdebug.remote_mode = "req"
xdebug.idekey= PHPSTROM


 浙公网安备 33010602011771号