

使用plt的scatter函数画带label的散点图,终于会了--
需确保matplot版本为3.4.2及以上
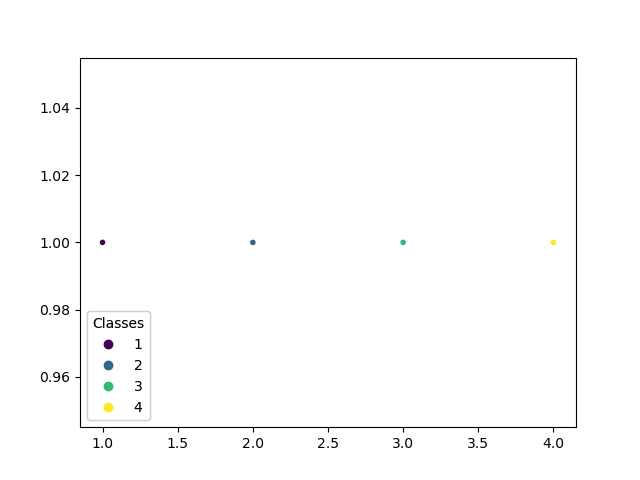
1 fig, ax = plt.subplots()
2 x = [1,2,3,4]
3 y = [1,1,1,1]
4 scatter = ax.scatter(x,y, marker='.', c=[1,2,3,4])
5 legend1 = ax.legend(*scatter.legend_elements(),loc="lower left", title="Classes")
6 ax.add_artist(legend1)
7 plt.show()
官方例子测试
 1 volume = np.random.rayleigh(27, size=40)
 2 amount = np.random.poisson(10, size=40)
 3 ranking = np.random.normal(size=40)
 4 price = np.random.uniform(1, 10, size=40)
 5
 6 fig, ax = plt.subplots()
 7
 8 # Because the price is much too small when being provided as size for ``s``,
 9 # we normalize it to some useful point sizes, s=0.3*(price*3)**2
10 scatter = ax.scatter(volume, amount, c=ranking, s=0.3*(price*3)**2,
11                      vmin=-3, vmax=3, cmap="Spectral")
12
13 # Produce a legend for the ranking (colors). Even though there are 40 different
14 # rankings, we only want to show 5 of them in the legend.
15 legend1 = ax.legend(*scatter.legend_elements(num=5),
16                     loc="upper left", title="Ranking")
17 ax.add_artist(legend1)
18
19 # Produce a legend for the price (sizes). Because we want to show the prices
20 # in dollars, we use the *func* argument to supply the inverse of the function
21 # used to calculate the sizes from above. The *fmt* ensures to show the price
22 # in dollars. Note how we target at 5 elements here, but obtain only 4 in the
23 # created legend due to the automatic round prices that are chosen for us.
24 kw = dict(prop="sizes", num=5, color=scatter.cmap(0.7), fmt="$ {x:.2f}",
25           func=lambda s: np.sqrt(s/.3)/3)
26 legend2 = ax.legend(*scatter.legend_elements(**kw),
27                     loc="lower right", title="Price")
28
29 plt.show()

参考连接:
matplotlib scatter的legend和edgecolors_iTom's blog-CSDN博客
Scatter plots with a legend — Matplotlib 3.5.1 documentation
用plt.scatter()画带label的散点图(无需循环,直接根据标签生成)

